
Lithium-ion Battery Market Size, Share & Trends, 2025 To 2033

Lithium-ion Battery Market by Battery Type (NMC, LFP, LCO, LTO, LMO, NCA), Cell Type (Prismatic, Pouch, Cylindrical), Capacity (<50 kWh, 50-100 kWh, >100 kWh), Energy Storage (Residential, Utilities) Consumer Electronics, Medical - Global Forecast to 2033


LITHIUM-ION BATTERY MARKET OVERVIEW
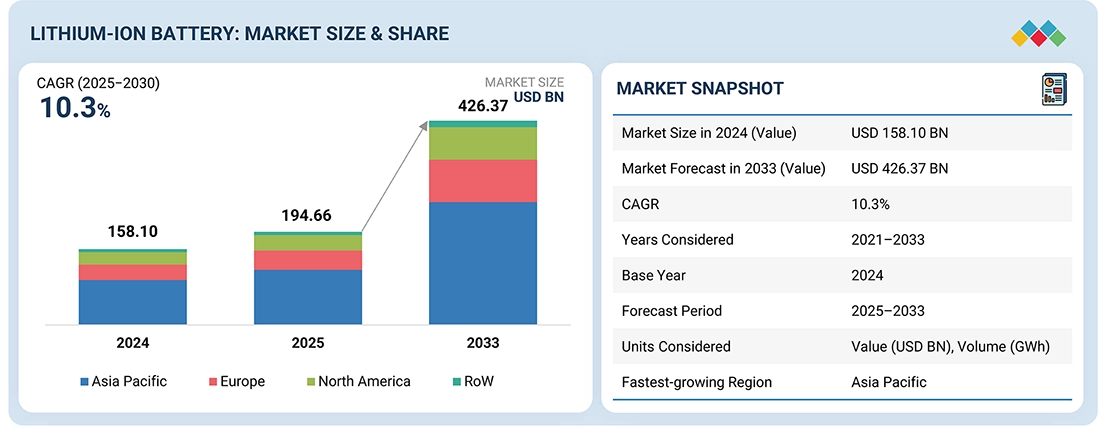
The global Lithium-ion Battery Market is expected to grow from USD 194.66 billion in 2025 to USD 426.37 billion by 2033, registering a CAGR of 10.3%. This growth is fueled by the increasing adoption of electric vehicles, the large-scale integration of renewable energy, and rising demand for advanced energy storage solutions. Key chemistries such as NMC, LFP, LCO, LTO, LMO, and NCA are experiencing strong adoption, supported by innovations in materials engineering, manufacturing efficiency, and government-backed clean energy initiatives.
LITHIUM-ION BATTERY MARKET Market Size & Forecast
The Lithium-ion Battery Industry Size is expanding rapidly due to the increasing adoption of electric vehicles, renewable energy storage systems, and advanced consumer electronics worldwide. The accelerating transition toward electrification in transportation and the rapid deployment of grid-scale energy storage solutions are major drivers supporting the expansion of the Lithium-ion Battery Industry. Additionally, continuous advancements in battery chemistry such as nickel manganese cobalt (NMC), lithium iron phosphate (LFP), and lithium cobalt oxide (LCO) are improving performance, energy density, and safety, which further strengthens the overall Lithium-ion Battery Market Growth across automotive, consumer electronics, and industrial sectors.
The Lithium-ion Battery Market Share is largely dominated by the Asia Pacific region, driven by strong manufacturing capabilities and high demand for electric vehicles and electronics in countries such as China, Japan, and South Korea. This regional dominance plays a crucial role in shaping the global Lithium-ion Battery Industry, as leading battery manufacturers continue expanding production capacity and investing in next-generation battery technologies. Major Lithium-ion Battery Market Trends include the increasing adoption of lithium iron phosphate batteries for electric vehicles, advancements in battery management systems, and the development of high-capacity cells for utility-scale energy storage. These technological improvements are strengthening the competitive landscape and increasing the overall Lithium-ion Battery Market Share of companies investing in innovative battery solutions. As demand for sustainable energy and electrified transportation continues to rise globally, the Lithium-ion Battery Market Growth is expected to accelerate further, reinforcing the long-term expansion of the Lithium-ion Battery Industry.
LITHIUM-ION BATTERY MARKET KEY TAKEAWAYS
-
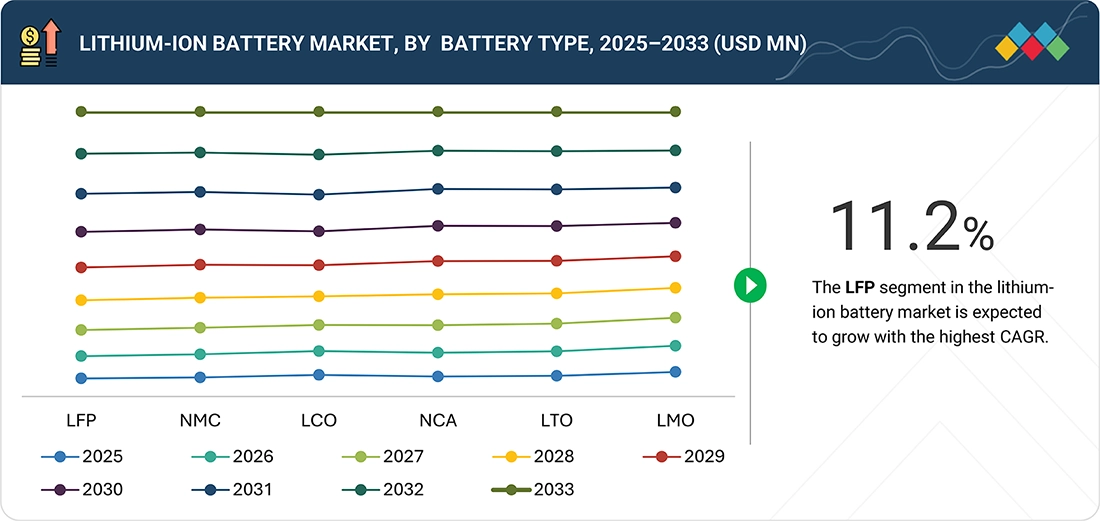
BY BATTERY TYPEThe lithium-ion battery market is divided into NMC (Nickel Manganese Cobalt), LFP (Lithium Iron Phosphate), LCO (Lithium Cobalt Oxide), LTO (Lithium Titanate), LMO (Lithium Manganese Oxide), and NCA (Nickel Cobalt Aluminum). LFP batteries are projected to experience the highest CAGR due to their better safety, longer cycle life, and lower cost, making them more appealing for electric vehicles and large-scale energy storage. NMC batteries remain dominant in high-end EV markets because of their high energy density, while LCO batteries are still commonly used in consumer electronics. LTO batteries are increasingly adopted for fast-charging and high-cycle uses, whereas LMO and NCA chemistries support specific industrial, automotive, and grid applications by balancing performance, thermal stability, and energy efficiency.
-
BY APPLICATIONThe lithium-ion battery market supports a range of applications, including electric vehicles (EVs), energy storage systems (ESS), industrial equipment, consumer electronics, and medical devices. EVs make up the largest segment, driven by the rapid electrification of passenger cars, buses, and two-wheelers as governments and OEMs promote clean mobility. Energy storage is becoming a high-growth area, fueled by large-scale renewable energy integration and the need for grid stability. Industrial uses increasingly incorporate lithium-ion batteries for automation, material handling, and backup power to boost operational efficiency. Consumer electronics, such as smartphones, laptops, and wearables, continue to depend on lithium-ion cells for their compact size and high energy output. Medical devices, including portable monitors and surgical tools, benefit from their reliability and long lifecycle. EVs are expected to hold a dominant market share, while energy storage is projected to grow the fastest, supported by global clean energy initiatives and rising investments in utility-scale storage projects.
-
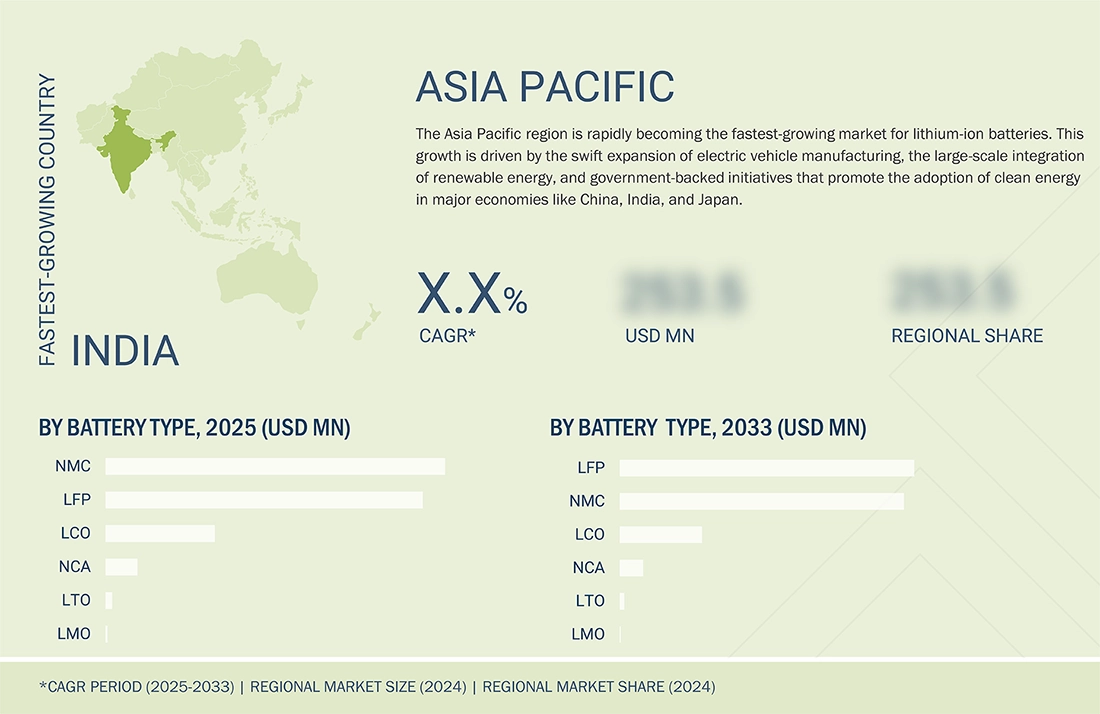
BY REGIONAsia Pacific is expected to grow the fastest in the lithium-ion battery market during the forecast period. This growth is driven by large-scale electric vehicle manufacturing, rapid expansion of renewable energy projects, and increasing investments in battery production facilities and gigafactories across key countries such as China, Japan, and India. Supportive government policies, raw material availability, and the strong presence of leading battery manufacturers further establish the region as a global hub for lithium-ion battery production and adoption.
-
COMPETITIVE LANDSCAPEMajor players, including CATL, LG Energy Solution, Panasonic, BYD, and Samsung SDI, are expanding their regional presence through gigafactory capacity increases, technological innovation, and strategic partnerships with automakers and energy companies, allowing them to meet the growing demand for lithium-ion batteries in electric vehicles, energy storage systems, and industrial applications.
The lithium-ion battery market is expected to grow significantly over the next decade, fueled by increasing adoption of electric vehicles, rising demand for renewable energy integration, and greater need for dependable energy storage solutions. Improvements in battery chemistries, manufacturing technologies, and recycling abilities are boosting performance, safety, and cost-effectiveness, making lithium-ion batteries a key driver for clean mobility, grid stability, and a sustainable energy shift across various industries.
Source: Secondary Research, Interviews with Experts, MarketsandMarkets Analysis
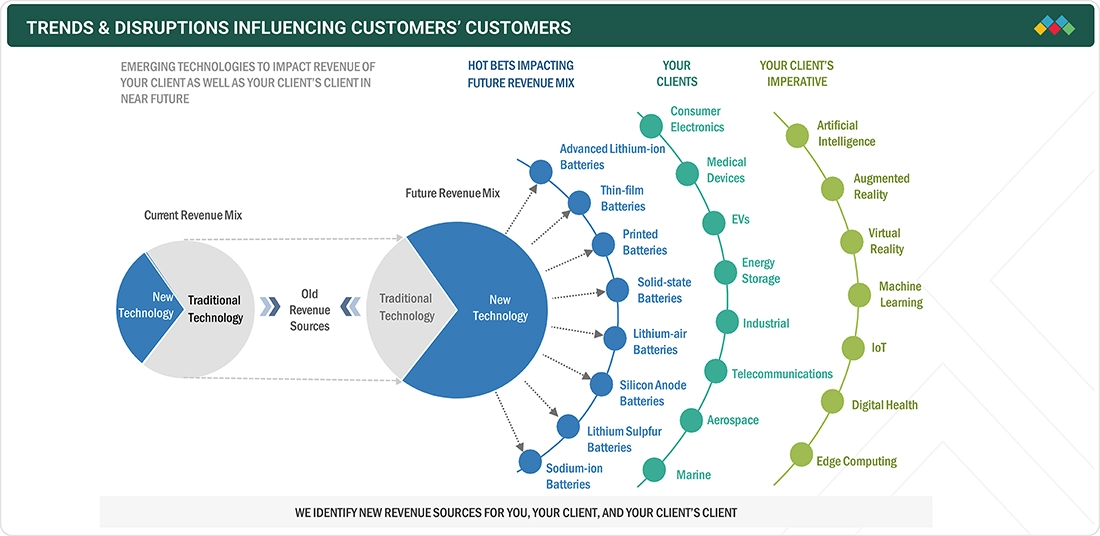
TRENDS & DISRUPTIONS IMPACTING CUSTOMERS' CUSTOMERS
The impact on customers’ businesses in the lithium-ion battery market comes from accelerating electrification trends and the increasing need for sustainable energy solutions. The automotive, energy, industrial, consumer electronics, and healthcare sectors are increasingly adopting lithium-ion batteries, with electric mobility and renewable energy integration as key focus areas. Shifts toward higher energy density chemistries, cost savings, and sustainability-driven recycling practices are directly affecting performance, lifecycle costs, and competitiveness for end users. These changes, in turn, boost the demand for advanced lithium-ion battery technologies and large-scale manufacturing capacity, shaping the market’s long-term path.
Source: Secondary Research, Interviews with Experts, MarketsandMarkets Analysis
LITHIUM-ION BATTERY MARKET DYNAMICS
Level
-
Transition to zero-emission vehicles due to clean mobility agenda

-
Growing preference for LFP batteries among EV manufacturers

Level
-
Safety concerns and high recycling and disposal costs

Level
-
New era of renewable energy capacity and storage innovations

-
Accelerated R&D efforts to develop advanced Li-ion batteries

Level
-
Competition from emerging technologies such as sodium-ion and flow batteries

-
Increased tariffs on Chinese EVs in Europe and North America

Source: Secondary Research, Interviews with Experts, MarketsandMarkets Analysis
Driver: Transition to zero-emission vehicles due to clean mobility agenda
The global shift toward zero-emission mobility is a major driver for the lithium-ion battery market. Governments are enforcing stricter emission norms, offering EV subsidies, and supporting charging infrastructure, which is accelerating EV adoption. Lithium-ion batteries, with their high energy density and efficiency, are central to enabling this transition, making them indispensable in the automotive sector.
Restraint: Safety concerns and high recycling and disposal costs
Despite rapid adoption, safety issues such as thermal runaway, fire hazards, and overheating remain critical restraints for lithium-ion batteries. Additionally, the recycling process is energy-intensive, costly, and technologically complex, posing environmental and economic challenges. These concerns continue to impact large-scale adoption, especially in regions with stringent safety and waste management regulations.
Opportunity: New era of renewable energy capacity and storage innovations
The accelerating deployment of renewable energy is opening new opportunities for lithium-ion batteries in stationary storage applications. As solar and wind capacity expand globally, lithium-ion batteries are being deployed for grid stabilization, peak load management, and backup power. Their scalability and efficiency position them as a cornerstone technology for the renewable energy transition.
Challenge: Competition from emerging technologies such as sodium-ion and flow batteries
The lithium-ion battery market faces increasing competition from alternative technologies like sodium-ion and flow batteries. These chemistries promise lower costs, improved safety, and enhanced scalability for grid-scale applications. If commercialized successfully, they could limit lithium-ion’s dominance in specific sectors, especially energy storage.
LITHIUM-ION BATTERY MARKET SIZE, SHARE & GROWTH, 2033: COMMERCIAL USE CASES ACROSS INDUSTRIES
| COMPANY | USE CASE DESCRIPTION | BENEFITS |
|---|---|---|
 |
Advanced lithium-ion batteries for EVs and grid-scale storage; advancing cell-to-pack integration for greater efficiency | Higher energy density, faster charging, strong temperature adaptability, cost efficiency |
 |
Lithium-ion batteries for electric vehicles, energy storage, and consumer electronics | Extended driving range, stable performance, improved energy efficiency |
 |
Proprietary Blade Battery technology for electric cars, buses, and commercial fleets | Enhanced safety with minimized thermal runaway risk, long service life, and optimized design for space utilization |
 |
Cylindrical and prismatic lithium-ion cells for EVs and hybrid vehicles; key supplier to leading automakers | High energy density, reliable lifecycle performance, and proven scalability for mass-market electric mobility |
 |
Lithium-ion batteries for EVs, energy storage systems, and portable electronics | High energy density, improved safety, long lifespan, and compact form factor for diverse applications |
Logos and trademarks shown above are the property of their respective owners. Their use here is for informational and illustrative purposes only.
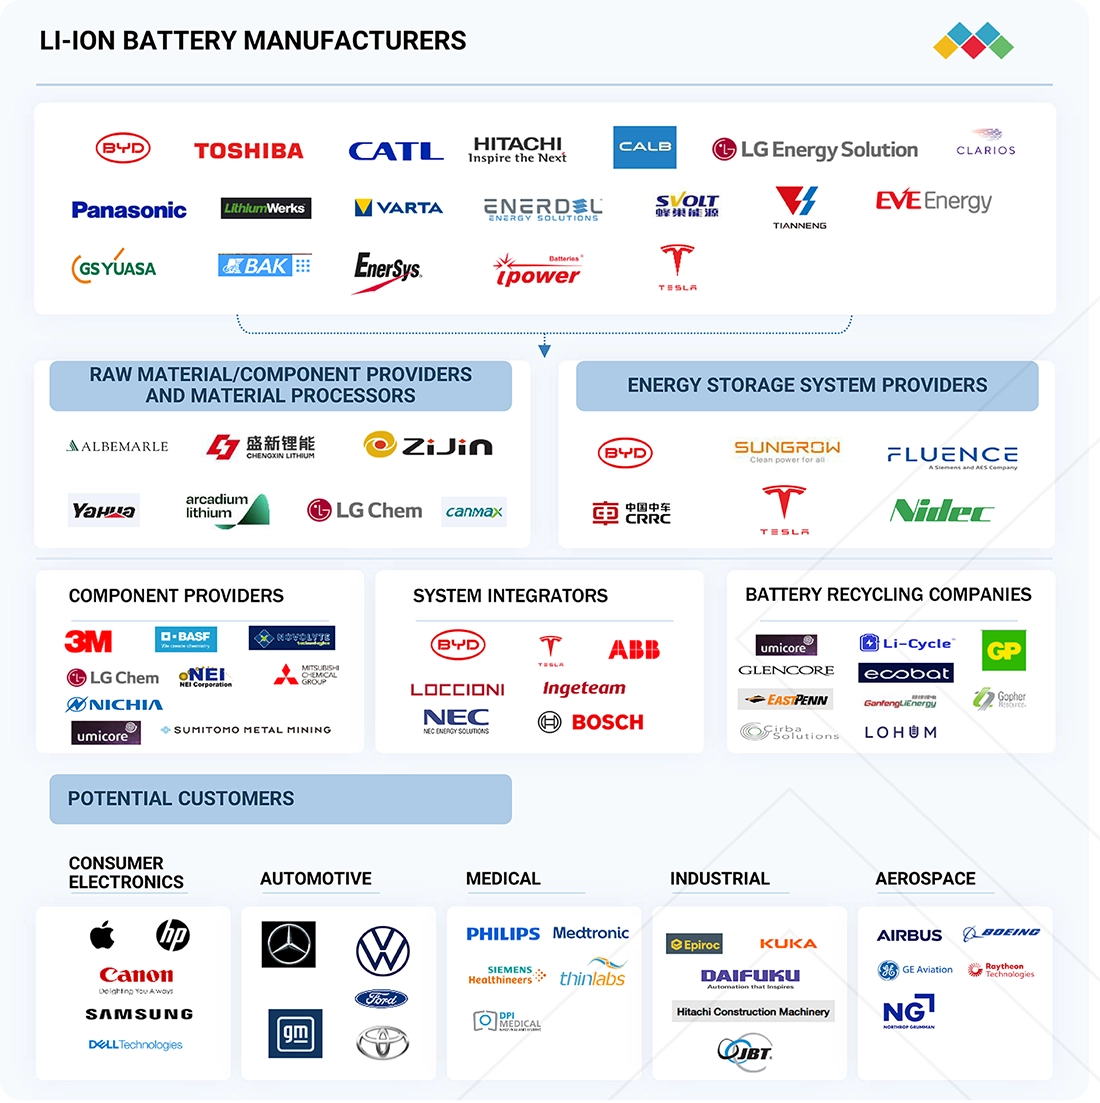
LITHIUM-ION BATTERY MARKET ECOSYSTEM
Key players in the lithium-ion battery market include CATL (China), LG Energy Solution (South Korea), Panasonic Corporation (Japan), BYD Company Ltd. (China), Samsung SDI (South Korea), and other global manufacturers. The ecosystem goes beyond cell production to include raw material and component suppliers, material processors, and system integrators that support large-scale deployment. Energy storage system providers are crucial for integrating lithium-ion solutions into grid and renewable projects, while battery recycling companies are emerging as vital stakeholders to promote sustainability, raw material recovery, and a circular economy. This interconnected ecosystem collectively fosters innovation, capacity growth, and supply chain resilience in the lithium-ion battery companies.
Logos and trademarks shown above are the property of their respective owners. Their use here is for informational and illustrative purposes only.
LITHIUM-ION BATTERY MARKET SEGMENTS
Source: Secondary Research, Interviews with Experts, MarketsandMarkets Analysis
Lithium-ion Battery Market, By Battery Type
The lithium iron phosphate (LFP) battery segment held a significant share of the lithium-ion battery market in 2024, fueled by its increasing adoption in electric vehicles and stationary energy storage systems. LFP batteries provide better safety, longer cycle life, and cost benefits compared to other chemistries, making them ideal for mass-market EVs, buses, and renewable energy projects. Their ability to deliver stable performance, endure frequent charge-discharge cycles, and reduce thermal runaway risk makes LFP a preferred choice for manufacturers and utilities seeking reliable and scalable energy solutions. As sustainability and affordability remain top priorities, LFP batteries are set to play an expanding role in the global energy transition.
Lithium-ion Battery Market, By Application
The energy storage segment held a significant share of the lithium-ion battery market in 2024, as demand for reliable and scalable storage solutions continues to grow alongside renewable energy integration. Lithium-ion batteries are increasingly deployed for grid stabilization, peak load management, and backup power applications, enabling utilities and industries to ensure consistent energy supply. Their high efficiency, modular scalability, and long cycle life make them a preferred choice for large-scale solar and wind projects as well as distributed storage systems. Rising investments in renewable infrastructure, government-backed clean energy targets, and advancements in battery performance further reinforce the prominence of this segment in shaping the global energy transition.
LITHIUM-ION BATTERY MARKET REGION
Asia Pacific to be fastest-growing region in global lithium-ion battery market during forecast period
Asia Pacific is expected to be the fastest-growing market for lithium-ion batteries, fueled by widespread electric vehicle adoption, quick expansion of renewable energy projects, and major investments in battery manufacturing capacity. The region is home to leading global manufacturers and a broad supply chain for raw materials and components, making it a key center for production and innovation. Strong government-supported initiatives promoting clean transportation and renewable energy, along with Industry 4.0 adoption in energy and manufacturing sectors, are further boosting demand. Countries like China, India, Japan, and South Korea are leading the way, solidifying Asia Pacific’s role as the primary growth driver of the global lithium-ion battery market.
The North American lithium-ion battery market is expected to grow from USD 31.93 billion in 2025 to USD 67.79 billion by 2033, with a CAGR of 9.9%. This growth is driven by combined efforts of battery makers, industry groups, and governments to cut carbon dioxide emissions. Popular chemistries like NMC, LFP, LCO, LTO, LMO, and NCA are seeing strong adoption, supported by advances in materials engineering, manufacturing efficiency, and government-supported clean energy programs.
The Asia Pacific lithium-ion battery market is projected to grow from USD 115.13 billion in 2025 to USD 256.47 billion by 2033, registering a CAGR of 10.5%. Growth is driven by a rapidly expanding hub for lithium-ion battery production, driven by strong demand across automotive, consumer electronics, and renewable energy sectors. The region has become an attractive automotive hub and a leading center for lithium-ion battery production, supported by the presence of several prominent electronics companies.
The European lithium-ion battery market is projected to attain a valuation of USD 88.26 billion by the year 2033, escalating from USD 40.23 billion in 2025, with a compound annual growth rate (CAGR) of 10.3% during the forecast period. This market is experiencing rapid expansion driven by automakers, battery manufacturers, and policymakers advocating for electrification, supply-chain localization, and energy security. Innovations in chemistries such as NMC, LFP, and LTO, coupled with substantial European Union funding and investments in gigafactories, are further expediting adoption across mobility and energy storage sectors.
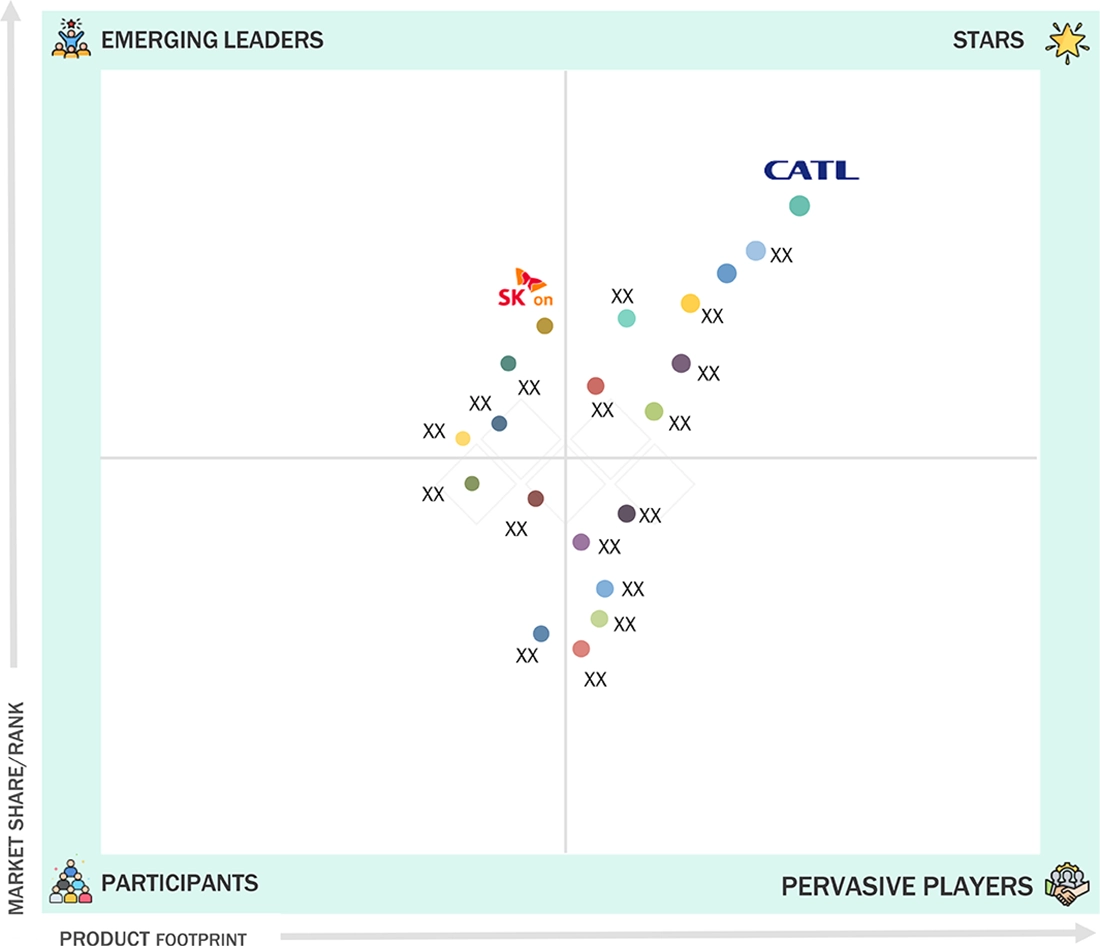
LITHIUM-ION BATTERY MARKET SIZE, SHARE & GROWTH, 2033: COMPANY EVALUATION MATRIX
In the lithium-ion battery market landscape, CATL (Star) leads with a strong global presence and a diverse portfolio that includes electric vehicle batteries, energy storage systems, and advanced battery technologies. Its large-scale manufacturing capacity, extensive partnerships with automakers worldwide, and ongoing innovation in chemistries such as LFP and NMC have established CATL as the dominant player in the industry. SK Innovation Co., Ltd. (Emerging Leader), leveraging its expertise in advanced materials and battery manufacturing, is rapidly increasing capacity and strengthening collaborations with automakers to grow its lithium-ion business. While CATL maintains market leadership through its global scale and technological expertise, SK Innovation exhibits strong growth momentum, positioning itself to move closer to the leaders’ group within the evolving lithium-ion battery market.
Source: Secondary Research, Interviews with Experts, MarketsandMarkets Analysis
LITHIUM-ION BATTERY MARKET KEY PLAYERS
LITHIUM-ION BATTERY MARKET SCOPE
| REPORT METRIC | DETAILS |
|---|---|
| Market Size in 2024 (Value) | USD 158.10 Billion |
| Market Forecast in 2033 (Value) | USD 426.37 Billion |
| Growth Rate | CAGR of 10.3% from 2025-2033 |
| Years Considered | 2021-2033 |
| Base Year | 2024 |
| Forecast Period | 2025-2033 |
| Units Considered | Value (USD Billion/Million), Volume (GWh) |
| Report Coverage | Revenue forecast, company ranking, competitive landscape, growth factors, and trends |
| Segments Covered |
|
| Regions Covered | North America, Asia Pacific, Europe, RoW |
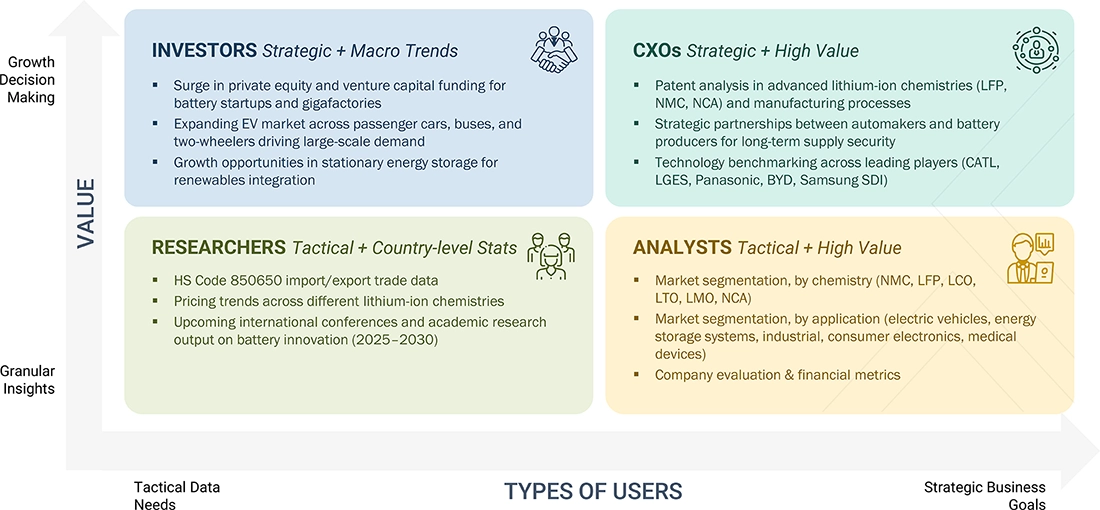
WHAT IS IN IT FOR YOU: LITHIUM-ION BATTERY MARKET SIZE, SHARE & GROWTH, 2033 REPORT CONTENT GUIDE
DELIVERED CUSTOMIZATIONS
We have successfully delivered the following deep-dive customizations:
| CLIENT REQUEST | CUSTOMIZATION DELIVERED | VALUE ADDS |
|---|---|---|
| Automotive OEM |
|
|
| Energy Storage System (ESS) Developer |
|
|
| Battery Recycling Company |
|
|
RECENT DEVELOPMENTS
- May 2025 : Contemporary Amperex Technology Co., Limited (CATL) introduced the TENER Stack, the world’s first 9 MWh ultra-large capacity energy storage system, at Entry/Exit System (EES) Europe 2025. The product was created to meet increasing global demand for high-density, flexible, and portable energy storage solutions. Aimed at utilities, developers, and industrial users, the TENER Stack offers notable improvements in space efficiency, energy performance, and cost-effectiveness. It supports various applications, including AI data centers and industrial electrification.
- April 2025 : LG Energy Solution entered into a joint venture with French metal recycling company Derichebourg Multiservices to strengthen its closed-loop battery recycling system and enhance value chain competitiveness in Europe. The partnership will establish a pre-processing facility in Bruyères-sur-Oise, northern France, to extract black mass. Construction is scheduled to begin in 2026, with operations expected to commence in 2027.
- April 2025 : CALB unveiled its latest energy storage technologies at the 2025 ESIE Summit, announcing the global mass production of its 392Ah cell and 6.25 MWh liquid-cooled container system. The company also introduced the 314Gen2.0 ultra-long-cycle cell and the 640Ah high-capacity cell, showcasing its broad portfolio of advanced, reliable, and high-performance energy storage solutions.
- March 2025 : LG Energy Solution signed an agreement with PGE Polska Grupa Energetyczna S.A., Poland’s largest energy provider, to supply 981 MWh of grid-scale energy storage system (ESS) batteries from 2026 to 2027. This marks LG's first large-scale ESS deployment from its Poland facility. The companies will jointly develop a battery energy storage facility in Zarnowiec, Poland, with commercial operations set to begin in 2027. The agreement includes a turnkey solution consisting of containerized systems and EPC services.
- March 2025 : Samsung SDI began production of its 46-series cylindrical batteries, using advanced NCA cathode and SCN anode technologies. The first batch is aimed at a U.S. customer for micro-mobility applications. The batteries are made in South Korea and assembled in Vietnam, marking a key milestone for Samsung SDI. It is the first Korean battery maker to deliver 46-series cells internationally and plans to grow its global market share.
Table of Contents
 Exclusive indicates content/data unique to MarketsandMarkets and not available with any competitors.
Methodology
The study involved four major activities in estimating the current size of the lithium-ion battery market. Exhaustive secondary research has been conducted to gather information on the market, adjacent markets, and the overall lithium-ion battery landscape. These findings, along with assumptions and projections, were validated through primary research involving interviews with industry experts and key stakeholders across the value chain. Both top-down and bottom-up approaches were utilized to estimate the overall market size. Subsequently, market breakdown and data triangulation techniques were applied to determine the sizes of various segments and subsegments. Two key sources, secondary and primary, were leveraged to conduct a comprehensive technical and commercial assessment of the lithium-ion battery market.
Secondary Research
Various secondary sources have been referred to in the secondary research process to identify and collect important information for this study. The secondary sources include annual reports, press releases, and investor presentations of companies; white papers; journals and certified publications; and articles from recognized authors, websites, directories, and databases. Secondary research has been conducted to obtain key information about the industry’s supply chain, the market’s value chain, the total pool of key players, market segmentation according to the industry trends (to the bottom-most level), regional markets, and key developments from market- and technology-oriented perspectives. The secondary data has been collected and analyzed to determine the overall market size, further validated by primary research.
Primary Research
Extensive primary research was conducted after gaining knowledge about the current scenario of the lithium-ion battery market through secondary research. Several primary interviews were conducted with experts from the demand and supply sides across four major regions: North America, Europe, Asia Pacific, and RoW. This primary data was collected through questionnaires, emails, and telephone interviews.

Note: Three tiers of companies are defined based on their total revenue as of 2024: tier 3 = revenue less than USD 500 million; tier 2 = revenue between USD 500 million and USD 5 billion; and tier 1 = revenue more than USD 5 billion. Other designations include sales, marketing, and product managers.
To know about the assumptions considered for the study, download the pdf brochure
Market Size Estimation
Both top-down and bottom-up approaches have been used to estimate and validate the total size of the lithium-ion battery market. These methods have also been used extensively to estimate the size of various subsegments in the market. The following research methodology has been used to estimate the market size:
- Major players in the industry and markets were identified through extensive secondary research.
- The industry’s value chain and market size (in terms of value) were determined through primary and secondary research processes.
- All percentage shares, splits, and breakdowns were determined using secondary sources and verified through primary sources.
Lithium-ion Battery Market : Top-Down and Bottom-Up Approach

Data Triangulation
After arriving at the overall size of the lithium-ion battery market from the market size estimation process explained above, the total market has been split into several segments and subsegments. Data triangulation and market breakdown procedures have been employed, wherever applicable, to complete the overall market engineering process and arrive at the exact statistics for all segments and subsegments of the market. The data has been triangulated by studying various factors and trends from the demand and supply sides. Additionally, the market size has been validated using top-down and bottom-up approaches.
Market Definition
The lithium-ion battery market includes a broad range of rechargeable battery technologies that use lithium ions as the core component for energy transfer. These batteries are widely used in applications such as electric vehicles (EVs), energy storage, consumer electronics, industrial machinery, and medical equipment. The market covers several chemistries, such as lithium iron phosphate (LFP), nickel manganese cobalt (NMC), lithium nickel cobalt aluminum oxide (NCA), lithium titanate oxide (LTO), lithium cobalt oxide (LCO) and lithium manganese oxide (LMO), each selected based on specific performance, safety, and cost requirements. Li-ion batteries are known for their high energy density, long service life, fast charging capability, and low maintenance. Market growth is primarily driven by the rising adoption of EVs, expanding renewable energy infrastructure, and increasing demand for compact and efficient power storage solutions across residential, commercial, and industrial sectors.
Key Stakeholders
- Lithium-ion battery manufacturers
- Government bodies and policymakers
- Standards organizations, forums, alliances, and associations
- Market research and consulting firms
- Raw material suppliers and distributors
- Research institutes and organizations
- Material and technology providers
- Battery cell and battery pack manufacturers
- Consumer electronics manufacturers
- Testing, inspection, and certification providers
- Distributors and resellers
Report Objectives
- To define, describe, and forecast the lithium-ion battery market in terms of battery type, application, and region
- To forecast the lithium ion battery market, based on installed capacity (GWh)
- To describe and forecast the market, in terms of value, with regard to four main regions: North America, Europe, Asia Pacific, and Rest of the World (RoW), along with their respective countries
- To provide detailed information regarding major factors influencing the market growth (drivers, restraints, opportunities, and challenges)
- To provide a detailed overview of the value chain of the lithium-ion battery market.
- To strategically analyze micromarkets with respect to individual growth trends, prospects, and contributions to the lithium-ion battery market
- To analyze opportunities in the market for stakeholders by identifying high-growth segments of the lithium ion battery market.
- To strategically profile key players and comprehensively analyze their market position in terms of ranking and core competencies, along with detailing the competitive landscape for market leaders
- To analyze competitive strategies, such as product launches, expansions, mergers and acquisitions, adopted by key market players in the lithium-ion battery market.
Available customizations:
With the given market data, MarketsandMarkets offers customizations according to the company’s specific needs. The following customization options are available for the report:
Company Information:
- Detailed analysis and profiling of additional market players (up to 5)
Key Questions Addressed by the Report
What is the current Lithium-ion Battery Market Size?
The global Lithium-ion Battery Market was valued at about USD 158.10 billion in 2024 and is projected to reach USD 426.37 billion by 2033, growing at a CAGR of 10.3%.
What factors are driving Lithium-ion Battery Market Growth?
The market growth is driven by the rising adoption of electric vehicles, renewable energy integration, and increasing demand for energy storage systems worldwide.
What are the major Lithium-ion Battery Market Trends?
Key trends include gigafactory expansion, advancements in battery chemistries such as LFP and NMC, and increased investments in battery manufacturing and recycling technologies.
Which industries contribute most to the Lithium-ion Battery Industry?
The major industries include electric vehicles, consumer electronics, energy storage systems, industrial equipment, and medical devices.
Which region dominates the Lithium-ion Battery Market Share?
Asia Pacific holds the largest market share due to strong EV production, large-scale battery manufacturing, and growing renewable energy projects.
What are the most common types of lithium-ion batteries used in the market?
Popular battery chemistries include Lithium Iron Phosphate (LFP), Nickel Manganese Cobalt (NMC), Lithium Cobalt Oxide (LCO), Lithium Titanate Oxide (LTO), and Nickel Cobalt Aluminum (NCA).
Why are lithium-ion batteries widely used in electric vehicles?
Lithium-ion batteries offer high energy density, lightweight design, longer cycle life, and fast charging capabilities, making them ideal for EV applications.
What are the major challenges in the Lithium-ion Battery Industry?
Key challenges include safety concerns such as thermal runaway, high recycling costs, and supply chain constraints for critical raw materials.
Who are the key companies in the Lithium-ion Battery Market Report?
Major companies include CATL, LG Energy Solution, Panasonic Holdings, BYD Company Ltd., and Samsung SDI.
What is the future outlook of the Lithium-ion Battery Market?
The market is expected to expand rapidly due to global electrification, renewable energy deployment, and increasing investments in advanced battery technologies.
Need a Tailored Report?
Customize this report to your needs
Get 10% FREE Customization
Customize This ReportPersonalize This Research
- Triangulate with your Own Data
- Get Data as per your Format and Definition
- Gain a Deeper Dive on a Specific Application, Geography, Customer or Competitor
- Any level of Personalization
Let Us Help You
- What are the Known and Unknown Adjacencies Impacting the Lithium-ion Battery Market
- What will your New Revenue Sources be?
- Who will be your Top Customer; what will make them switch?
- Defend your Market Share or Win Competitors
- Get a Scorecard for Target Partners

Custom Market Research Services
We Will Customise The Research For You, In Case The Report Listed Above Does Not Meet With Your Requirements
Get 10% Free CustomisationTESTIMONIALS

Tetsuya Ohhira
Business Development Manager-Technology Business
Nikon Corporation,
Leading Japanese MNC specializing in optics and imaging productswww.nikon.com
MarketsandMarkets™ response
is quick. Their attitude is flexible and positive. Analyst Insights are globally considered and
significant. Client Services quickly respond to our inquiry and demand. Their wide range of global
surveys help us make our strategic plan.
We hope Knowledge Store will be easier to search
for a report.
VP - Marketing & Business Development
Leading Provider of Process Control Solutions
We engaged with MarketsandMarkets on a study to perform an analysis and recommend a Go-To-Market strategy for metrology and process control in the semiconductor market. The study was tailored to our targets and needs with well-defined milestones. Our overall experience with the MarketsandMarkets team was very good throughout the project in all aspects including the analysis methodologies used, the quality and depth of primary and secondary data sets, the professionalism and flexibility of the team and the ability to meet the target schedule and milestones. We want to thank MarketsandMarkets team for a job well done.
Growth opportunities and latent adjacency in Lithium-ion Battery Market

Still Researching the
Lithium-ion Battery Ecosystem?
See the competitors, opportunity evaluation, and growth signals shaping it - Instantly!
Generate 15+ consulting-grade strategic intelligence outputs - from competitor analysis to board-ready strategy decks, tailored to your Lithium-ion Battery growth question.


Dylan
Apr, 2026
What are the key drivers of lithium-ion battery adoption over the next 5�10 years?.
Tyler
Apr, 2026
How are EVs, grid storage, and renewable integration impacting growth projections?.
Liam
Apr, 2026
Are trends like recycling, second-life applications, and circular economy included in the growth outlook?.
Aytak
Apr, 2022
I would like to have a general idea about the future of Lithium-Ion Battery Market size on a global scale and in Austria specifically..