Lung Cancer Therapeutics Market (NSCLC & SCLC) - 2010-2020 (Pipeline Assessment and Market Forecast) in G7 countries


Lung cancer is responsible for most of the deaths (due to cancer) across the globe. With just one drug slated to be launched by 2014 � Talactoferrin by Agennix AG, for patients with advanced lung cancer; having failed both chemotherapy and treatments with epidermal growth factor receptor (EFGR) - Tyrosine kinase inhibitor (TKI). Lung cancer is still an area with high unmet need for early diagnosis and limited treatment options in the advanced stages of lung cancer.
This report studies the market from 2005 to 2020 covering eleven major drugs (off-patent and pipeline) for lung cancer treatment. Growing lung cancer population is an impetus for the growth of the market. This market is expected to grow at a CAGR of 13.5% from 2015 to 2020. The U.S. was the major contributor to this market; accounting for 67% of the total sales of lung cancer drugs in 2010; whereas Avastin was the major drug accounting for 27.1% of the total sales of lung cancer drugs in 2010.
The report studies eight off-patent and patented drugs including Navelbine, Hycamtin, Taxotere, Gemzar, Alimta, Iressa, Avastin, and Tarceva. Currently, there are about five major drugs in pipeline for lung cancer; which are expecting a market launch by 2013-2014. Mage-A3 Antigen by GlaxoSmithKline commenced its phase III trial in 2007 and the completion is expected by 2022 involving 2,270 patients.
Xalkori has been launched in the market by Pfizer Inc. (U.S.) on receiving an accelerated approval from the FDA in August 2011. The drug is expected to be priced at $9,600 a month or $115,000 for patients who take them annually.
Players are implementing various growth strategies in the market to gain a competitive edge. New product launches, product pipelines, agreements and collaborations, clinical trials, and acquisitions were some of the major strategies adopted by the players from January 2006 to September 2011.
New product launches/approvals form a major growth strategy in the Lung Cancer Therapeutics Market in G7 Countries; accounting for 45% share in this market between January 2006 and September 2011, followed by pipeline drugs with a 23% share in the market and agreements and collaborations with 18% share.
Lung cancer drugs have a robust pipeline with five drugs; of which Xalkori has received a fast track approval in its late phase II. The drug (Xalkori) has been launched in the market in August 2011 in the U.S. and is under review by the European Medical Agency.
Roche, AstraZeneca, Eli Lilly and Company, Sanofi-Aventis, Pfizer, and GlaxoSmithKline rule the present market for lung cancer drugs; whereas Agennix AG & Pfizer are expected to capture about 50% of the market by 2020.
Scope of the report
The Lung Cancer Therapeutics Market research report evaluates the drugs market of lung cancer in G7 countries with respect to the current and pipeline drugs. The report analyzes geography; forecasting revenue, and trends in each of the following submarkets:
- Chemotherapy
- Navelbine
- Hycamtin
- Taxotere
- Alimta
- Gemzar
- Targeted therapies
- Avastin
- Tarceva
- Iressa
- Pipeline drugs
- ARQ 197
- Xalkori
- afatinib
- dacomitinib
- talactoferrin
The geographies covered under the report are
- North America
- U.S.
- Canada
- Europe
- U.K.
- Germany
- Italy
- France
- Spain
Each section provides market data, market drivers, trends and opportunities, key players, and competitive outlook. This report also provides market tables for covering the sub-segments and micro-markets. Additionally, it makes ways for company profiles that cover all the sub-segments. The report has been made by keeping past trends, current happenings, and future forecasts in consideration.
Lung cancer is a disease in which the cell lining of lung tissue grows beyond control and leads to the formation of tumor. There are two main types of lung cancer; small cell lung cancer that accounts for about 20%; and non-small cell lung cancer (NSCLC) that accounts for around 80% of the total lung cancers. The common cause of lung cancer is exposure to tobacco smoke. Small cell lung cancer has very high metastasis and hence is inoperable. The survival rate for such a cancer is very low after diagnosis. NSCLC is further categorized depending on the cell structure. It is primarily of three types such as squamous cell carcinoma (affecting the squamous epithelium), adenocarcinoma (affecting the glandular epithelium), and the large cell carcinoma (this is a heterogeneous group of neoplasm affecting the epithelial lining of the lung).
Non-small cell lung cancer is the most common type of lung cancer accounting for about 80% of all the lung cancers. The growth of this cancer is slower as compared to SCLC. Each type of NSCLC has different cancer cells and hence they grow and spread in different ways. The squamous cell cancer is the cancer of the squamous cells (thin and flat cells), accounting for about 30% of all NSCLC; adenocarcinoma is most common subtype of NSCLC, which develops at the edge of the lungs and in the cells in the airway, having slow growth and does not typically cause symptoms in the early stages.
Lung Cancer Population, 2005 - 2020, (Thousands)
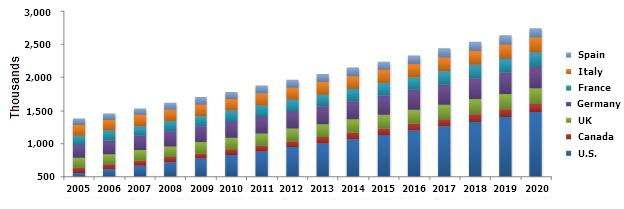
Source: Globocan
This type of cancer accounts for about 30%-35% of NSCLC. Cancers beginning in the large cells and in any part of the lungs are commonly associated with smoking and spreads quickly. These cancers account for about 10%-12% of NSCLC. Less common NSCLC include pleomorphic, carcinoid tumor, salivary gland carcinoma, and unclassified carcinoma.
 Exclusive indicates content/data unique to MarketsandMarkets and not available with any competitors.
TABLE OF CONTENTS
1 INTRODUCTION
1.1 KEY TAKE-AWAYS
1.2 REPORT DESCRIPTION
1.3 MARKETS COVERED
1.4 STAKEHOLDERS
1.5 RESEARCH METHODOLOGY
1.5.1 MARKET SIZE
1.5.2 MARKET SHARE
1.5.3 KEY DATA POINTS FROM SECONDARY SOURCES
1.5.4 KEY DATA POINTS FROM PRIMARY SOURCES
1.5.5 ASSUMPTIONS
2 EXECUTIVE SUMMARY
3 MARKET OVERVIEW
3.1 DEFINING LUNG CANCER
3.1.1 TYPES & STAGES OF LUNG CANCER
3.2 MARKET STRUCTURE
3.3 BURNING ISSUES
3.3.1 #1 CAUSE OF CANCER DEATHS WITH LEAST AMOUNT OF RESEARCH FUNDING
3.3.2 SUB-OPTIMAL DOSING DUE TO HIGH TOXICITY
3.4 WINNING IMPERATIVES
3.4.1 HIGHER EFFICACY OF A COMBINATION OF AVASTIN & TARCEVA, ATTRACT OTHER DRUG MANUFACTURERS TO ENGAGE IN CLINICAL TRIALS
3.5 MARKET DYNAMICS
3.5.1 DRIVERS & RESTRAINTS
3.5.1.1 Innovative targeted therapy drugs to drive the market for lung cancer
3.5.1.2 Rising incidence of lung cancer to drive the market for drugs
3.5.1.3 Genericization of major drugs to slow down the pace of the market
3.6 MARKET SHARE ANALYSIS
4 LUNG CANCER DRUGS MARKET
4.1 MARKET OVERVIEW
4.1.1.1 Hycamtin
4.1.1.2 Taxotere
4.1.1.3 Gemzar
4.1.1.4 Alimta
4.1.1.5 Iressa
4.1.1.6 Avastin
4.1.1.7 Tarceva
4.2 PIPELINE DRUGS
4.2.1.1 Xalkori
4.2.1.2 Afatinib
4.2.1.3 Dacomitinib (PF-00299804)
4.2.1.4 ARQ 197
4.2.1.5 Talactoferrin
5 GEOGRAPHICAL ANALYSIS
5.1 NORTH AMERICA
5.1.1 U.S.
5.1.2 CANADA
5.2 EUROPE
5.2.1 U.K.
5.2.2 GERMANY
5.2.3 FRANCE
5.2.4 ITALY
5.2.5 SPAIN
6 COMPETITIVE LANDSCAPE
6.1 INTRODUCTION
7 COMPANY PROFILES
7.1 ASTRAZENECA PLC
7.1.1 OVERVIEW
7.1.2 FINANCIALS
7.1.3 PRODUCTS & SERVICES
7.1.4 STRATEGY
7.1.5 DEVELOPMENTS
7.2 ELI LILLY AND COMPANY
7.2.1 OVERVIEW
7.2.2 FINANCIALS
7.2.3 PRODUCTS & SERVICES
7.2.4 STRATEGY
7.2.5 DEVELOPMENTS
7.3 GLAXOSMITHKLINE PLC
7.3.1 OVERVIEW
7.3.2 FINANCIALS
7.3.3 PRODUCTS & SERVICES
7.3.4 STRATEGY
7.3.5 DEVELOPMENTS
7.4 F. HOFFMANN-LA ROCHE LTD
7.4.1 OVERVIEW
7.4.2 FINANCIALS
7.4.3 PRODUCTS & SERVICES
7.4.4 STRATEGY
7.4.5 DEVELOPMENTS
7.5 SANOFI-AVENTIS
7.5.1 OVERVIEW
7.5.2 FINANCIALS
7.5.3 PRODUCTS & SERVICES
7.5.4 STRATEGY
7.5.5 DEVELOPMENTS
7.6 PFIZER INC
7.6.1 OVERVIEW
7.6.2 FINANCIALS
7.6.3 PRODUCTS & SERVICES
7.6.4 STRATEGY
7.6.5 DEVELOPMENTS
7.7 ARQULE INC
7.7.1 OVERVIEW
7.7.2 FINANCIALS
7.7.3 PRODUCTS & SERVICES
7.7.4 STRATEGY
7.7.5 DEVELOPMENTS
7.8 DAIICHI SANKYO CO. LTD
7.8.1 OVERVIEW
7.8.2 FINANCIALS
7.8.3 PRODUCTS & SERVICES
7.8.4 STRATEGY
7.8.5 DEVELOPMENT
7.9 AGENNIX AG
7.9.1 OVERVIEW
7.9.2 FINANCIALS
7.9.3 PRODUCTS & SERVICES
7.9.4 STRATEGY
7.9.5 DEVELOPMENT
7.10 BOEHRINGER INGELHEIM GMBH
7.10.1 OVERVIEW
7.10.2 FINANCIALS
7.10.3 PRODUCTS & SERVICES
7.10.4 STRATEGY
7.10.5 DEVELOPMENT
LIST OF TABLES
TABLE 1 YEARLY COST OF DRUGS, 2011 ($)
TABLE 2 DOSAGE PATTERN OF DRUGS
TABLE 3 LUNG CANCER DRUGS MARKET REVENUE, BY DRUGS, 2005 - 2020 ($MILLION)
TABLE 4 LUNG CANCER STAGES & TUMOR SIZE
TABLE 5 LUNG CANCER STAGES, TREATMENT OPTIONS & SURVIVAL RATES
TABLE 6 LUNG CANCER DRUGS � PATENT STATUS
TABLE 7 LUNG CANCER DRUGS MARKET REVENUE, BY DRUGS, 2005 - 2020 ($MILLION)
TABLE 8 LUNG CANCER DRUGS (HYCAMTIN) MARKET REVENUE, BY COUNTRY, 2005 - 2020 ($MILLION)
TABLE 9 LUNG CANCER DRUGS (TAXOTERE) MARKET REVENUE, BY COUNTRY, 2005 - 2020 ($MILLION)
TABLE 10 LUNG CANCER DRUGS (GEMZAR) MARKET REVENUE, BY COUNTRY, 2005 - 2020 ($MILLION)
TABLE 11 LUNG CANCER DRUGS (ALIMTA) MARKET REVENUE, BY COUNTRY, 2005 - 2020 ($MILLION)
TABLE 12 LUNG CANCER DRUGS (IRESSA) MARKET REVENUE, BY COUNTRY, 2005 - 2020 ($MILLION)
TABLE 13 LUNG CANCER DRUGS (AVASTIN) MARKET REVENUE, BY COUNTRY, 2005 - 2020 ($MILLION)
TABLE 14 LUNG CANCER DRUGS (TARCEVA) MARKET REVENUE, BY COUNTRY, 2005 - 2020 ($MILLION)
TABLE 15 LUNG CANCER DRUGS � PIPELINE (XALKORI) MARKET REVENUE, BY COUNTRY, 2005 - 2020 ($MILLION)
TABLE 16 LUNG CANCER DRUGS � PIPELINE (AFATINIB) MARKET REVENUE, BY COUNTRY, 2005 - 2020 ($MILLION)
TABLE 17 LUNG CANCER DRUGS � PIPELINE (DACOMITINIB) MARKET REVENUE, BY COUNTRY, 2005 - 2020 ($MILLION)
TABLE 18 LUNG CANCER DRUGS � PIPELINE (ARQ197) MARKET REVENUE, BY COUNTRY, 2005 - 2020 ($MILLION)
TABLE 19 LUNG CANCER DRUGS � PIPELINE (TALACTOFERRIN) MARKET REVENUE, BY COUNTRY, 2005 - 2020 ($MILLION)
TABLE 20 NORTH AMERICA: LUNG CANCER DRUGS MARKET REVENUE, BY COUNTRY, 2005 - 2020 ($MILLION)
TABLE 21 U.S: LUNG CANCER DRUGS MARKET REVENUE, BY DRUGS, 2005 - 2020 ($MILLION)
TABLE 22 U.S: LUNG CANCER DRUGS (PIPELINE) MARKET REVENUE, BY DRUGS, 2005 - 2020 ($MILLION)
TABLE 23 CANADA: LUNG CANCER DRUGS MARKET REVENUE, BY DRUGS, 2005 - 2020 ($MILLION)
TABLE 24 CANADA: LUNG CANCER DRUGS (PIPELINE) MARKET REVENUE, BY DRUGS, 2005 - 2020 ($MILLION)
TABLE 25 EUROPE: LUNG CANCER DRUGS MARKET REVENUE, BY COUNTRY, 2005 - 2020 ($MILLION)
TABLE 26 U.K: LUNG CANCER DRUGS MARKET REVENUE, BY DRUGS, 2005 - 2020 ($MILLION)
TABLE 27 U.K: LUNG CANCER DRUGS (PIPELINE) MARKET REVENUE, BY DRUGS, 2005 - 2020 ($MILLION)
TABLE 28 GERMANY: LUNG CANCER DRUGS MARKET REVENUE, BY DRUGS, 2005 - 2020 ($MILLION)
TABLE 29 GERMANY: LUNG CANCER DRUGS (PIPELINE) MARKET REVENUE, BY DRUGS, 2005 - 2020 ($MILLION)
TABLE 30 FRANCE: LUNG CANCER DRUGS MARKET REVENUE, BY DRUGS, 2005 - 2020 ($MILLION)
TABLE 31 FRANCE: LUNG CANCER DRUGS (PIPELINE) MARKET REVENUE, BY DRUGS, 2005 - 2020 ($MILLION)
TABLE 32 ITALY: LUNG CANCER DRUGS MARKET REVENUE, BY DRUGS, 2005 - 2020 ($MILLION)
TABLE 33 ITALY: LUNG CANCER DRUGS (PIPELINE) MARKET REVENUE, BY DRUGS, 2005 - 2020 ($MILLION)
TABLE 34 SPAIN: LUNG CANCER DRUGS MARKET REVENUE, BY DRUGS, 2005 - 2020 ($MILLION)
TABLE 35 SPAIN: LUNG CANCER DRUGS (PIPELINE) MARKET REVENUE, BY DRUGS, 2005 - 2020 ($MILLION)
TABLE 36 COMPETITIVE DEVELOPMENTS, 2006 � 2011
TABLE 37 ASTRAZENECA PLC: TOTAL REVENUE AND R&D EXPENSES, 2008 - 2010 ($MILLION)
TABLE 38 ASTRAZENECA PLC: TOTAL REVENUE, BY SEGMENTS, 2008 � 2010 ($MILLION)
TABLE 39 ASTRAZENECA PLC: TOTAL REVENUE, BY GEOGRAPHY, 2008 � 2011 ($MILLION)
TABLE 40 PRODUCT PIPELINE: PHASE II & III, JANUARY 2011
TABLE 41 ELI LILLY AND COMPANY: SALES AND R&D EXPENSES, 2008 � 2010 ($MILLION)
TABLE 42 ELI LILLY AND COMPANY: SALES, BY SEGMENTS, 2008 � 2010 ($MILLION)
TABLE 43 ELI LILLY AND COMPANY: TOTAL REVENUE, BY GEOGRAPHY, 2008 � 2010 ($MILLION)
TABLE 44 GLAXOSMITHKLINE: TOTAL REVENUE, BY SEGMENTS, 2008 � 2010 ($MILLION)
TABLE 45 GLAXOSMITHKLINE: TOTAL REVENUE, BY GEOGRAPHY, 2008 � 2010 ($MILLION)
TABLE 46 ROCHE HOLDINGS: SALES AND R&D EXPENSES, 2008 � 2010 ($MILLION)
TABLE 47 ROCHE HOLDINGS: TOTAL REVENUE, BY SEGMENTS, 2008 � 2010 ($MILLION)
TABLE 48 ROCHE HOLDINGS: PHARMACEUTICAL DIVISION MARKET REVENUE, BY GEOGRAPHY, 2008 � 2010 ($MILLION)
TABLE 49 SANOFI: SALES AND R&D EXPENSES, 2008 � 2010 ($MILLION)
TABLE 50 SANOFI: MARKET REVENUE, BY SEGMENTS, 2008 � 2010 ($MILLION)
TABLE 51 SANOFI: PHARMACEUTICAL DIVISION REVENUE, BY GEOGRAPHY, 2008 � 2010 ($MILLION)
TABLE 52 PFIZER INC.: TOTAL REVENUE AND R&D EXPENSES, 2008 � 2010 ($MILLION)
TABLE 53 PFIZER INC.: MARKET REVENUE, BY BUSINESS SEGMENTS, 2008 � 2010 ($MILLION)
TABLE 54 PFIZER INC: MARKET REVENUE BY GEOGRAPHY, 2008 � 2010 ($MILLION)
TABLE 55 ARQULE INC: SALES AND R&D EXPENSES, 2008 � 2010 ($MILLION)
TABLE 56 DAIICHI SANKYO CO. LTD: SALES AND R&D EXPENSES, 2008 � 2010 ($MILLION)
TABLE 57 AGENNIX AG: REVENUE AND R&D EXPENSES 2008 � 2010 ($MILLION)
TABLE 58 BOEHRINGER: REVENUE AND R&D DEVELOPMENT, 2008 - 2010 ($MILLION)
TABLE 59 BOEHRINGER: MARKET REVENUE, BY SEGMENTS, 2008 - 2010 ($MILLION)
TABLE 60 BOEHRINGER: MARKET REVENUE, BY GEOGRAPHY, 2008 - 2010 ($MILLION)
LIST OF FIGURES
FIGURE 1 LUNG CANCER POPULATION, 2005 - 2020 (THOUSANDS)
FIGURE 2 LUNG CANCER DRUGS MARKET SEGMENTATION
FIGURE 3 CANCER RESEARCH FUNDING, 2007 ($/DEATH)
FIGURE 4 U.S: CANCER RESEARCH FUNDING, 2008 - 2010 ($MILLION)
FIGURE 5 LUNG CANCER INCIDENCE IN NORTH AMERICA & EUROPE, 2008 - 2020 (THOUSANDS)
FIGURE 6 LUNG CANCER DRUGS MARKET SHARE, 2011 VS 2020
FIGURE 7 KEY GROWTH STRATEGIES, JANUARY 2006 � SEPTEMBER 2011

 Generating Response ...


Growth opportunities and latent adjacency in Lung Cancer Therapeutics Market