Middle East & Africa Lubricants Market by Type (Mineral Oil, Synthetic Oil, Bio-based Oil, and Greases), by Application (Passenger Vehicles, Commercial Vehicles, Aviation and Marine and Industrial Machinery and Equipment) - Global Trends & Forecasts to 2019


[145 Pages Report] The Middle East & Africa lubricants market is estimated to register a CAGR of 3.2 % between 2014 and 2019 and reach a volume of 4,871.0 KT. The demand for Middle East & Africa lubricants is increasing and will continue to increase due to the tremendous growth in the transportation and industrial sector. The development of the tourism, mining, quarrying industries in Africa and crude oil and natural gas exploration, construction industries in the Middle East is significantly contributing to the increase in lubricants consumption in the region.
The Middle East & Africa lubricants market is estimated to be worth of $14.7 billion in 2013 and is projected to reach $17.9 billion by 2019 and is growing with a CAGR of 3.4% between 2014 and 2019.
Lubricants find application in the passenger vehicles, commercial vehicles, aviation and marine and industrial machinery and equipment sectors. The Middle East & Africa lubricants market by application type has recorded significant growth in the past few years and this growth is estimated to persist in the coming years due to the increasing demand of lubricants in these applications. The high consumption of lubricants by the transportation sector drives the lubricants market in the region.
This report essentially aims to estimate the market of lubricants in the Middle East & Africa for 2014 and to project the expected demand of the same by 2019. This market research study provides a detailed qualitative and quantitative analysis of the Middle East & Africa lubricants market. The research methodology of the report involved the utilization of various secondary sources, such as encyclopedia, directories, and databases to identify and collect information useful for this extensive commercial study of the market. The primary sources�experts from related industries and suppliers�were interviewed to obtain and verify critical information as well as to assess the future prospects of the Middle East & Africa lubricants market.
Competitive developments of top players in the Middle East & Africa lubricants market have been discussed in detail. The leading players of this industry are Royal Dutch Shell plc (U.K.), ExxonMobil Corporation (U.S.), BP plc (U.K.), Chevron Corporation (U.S.), Total S.A. (France), Lukoil Oil Company (Russia), and PetroChina Company Limited (China) among others have been profiled with their recent developments and other strategic industry activities.
Scope of the Report
The market for Middle East & Africa lubricants is analyzed in terms of volume (KT) by the below-mentioned classifications.
By Type
- Mineral Oil
- Synthetic Oil
- Bio-Based Oil
- Greases
By Application
- Transportation
- Passenger Vehicles
- Commercial Vehicles
- Aviation
- Marine
- Industrial Equipment & Machinery
By Region
- Middle East
- UAE
- Iraq
- Iran
- Saudi Arabia
- Bahrain
- Qatar
- Oman
- Kuwait
- Israel
- Turkey
- Syria
- Lebanon
- Yemen
- Palestine
- Africa
- South Africa
- Kenya
- Ghana
- Zimbabwe
- Chad
- Togo
- Tanzania
- Zambia
- Namibia
- Egypt
- Algeria
- Nigeria
- Morocco
- Sudan
- Libya
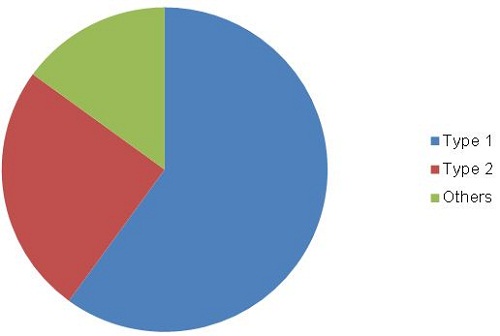
The Middle East & Africa lubricants market is growing at a significant rate, driven by the tremendous growth in the region of the transportation and industrial sectors. The development of the tourism, mining, quarrying industries in Africa and crude oil and natural gas exploration, construction industry in the Middle East is driving the growth of lubricants consumption in the region. The Middle East & Africa lubricants market in terms of volume was 4,157.7 KT in 2013, and is poised to register a CAGR of 3.2% between 2014 and 2019. The market has been segmented into four categories based on the type, namely, mineral oil, synthetic oil, bio-based and greases.
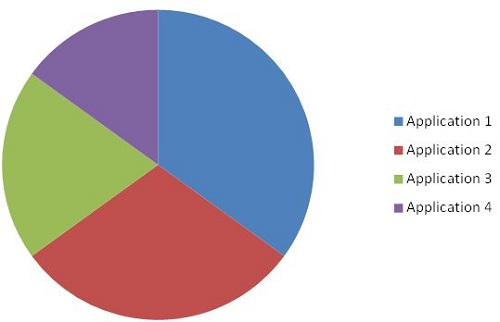
The Middle East & Africa lubricants have uses in a number of different industries. The report covers application of the Middle East & Africa lubricants in the passenger vehicles, commercial vehicles, aviation, marine and industrial machinery, and equipment sectors. The demand has increased from vehicle manufacturers for synthetic lubricants because of its advantages as compared to mineral oil lubricants. The demand from the other industries for the Middle East & Africa lubricants is also seeing an increase based on the need of lubricants for smooth running of machine parts. The major portion of Middle East & Africa lubricants is used in the transportation sector.
The report covers the Middle East & Africa lubricants market by key countries in each region. It also provides a detailed segmentation of the market on the basis of type and by application, along with projections till 2019.
MENA Lubricants Market, by Type, 2013
MENA Lubricants Market, by Application, 2013
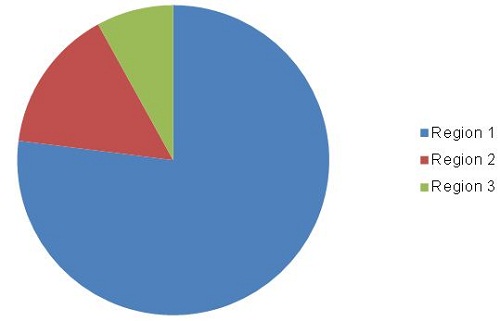
MENA Lubricants Market, by Region, 2013
Source: Secondary Research, Expert Interviews, and MarketsandMarkets Analysis
This report covers the market of Middle East & Africa Lubricants by key countries in each region. It also provides a detailed segmentation of the lubricants market on the basis of type and based on applications along with projections till 2019.
 Exclusive indicates content/data unique to MarketsandMarkets and not available with any competitors.
Table of Contents
1 Introduction (Page No. - 13)
1.1 Objectives of the Study
1.2 Market Definition
1.3 Markets Scope
1.3.1 Markets Covered
1.3.2 Years Considered in the Report
1.4 Currency and Pricing
1.5 Limitations
1.6 Stake Holders
2 Research Methodology (Page No. - 16)
2.1 Market Size Estimation
2.2 Market Crackdown & Data Triangulation
2.3 Market Share Estimation
2.3.1 Key Insights
2.3.2 Assumptions
3 Executive Summary (Page No. - 22)
4 Premium Insights (Page No. - 24)
4.1 Attractive Opportunities in the Lubricants Market
4.2 Lubricants Market: Top Lubricant Types Consumed
4.3 Lubricants Market in the Middle East & Africa
4.4 Lubricants Market: Countries With A High CAGR
4.5 Lubricants Market (2014-2019)
4.6 Life Cycle Analysis, By Region
5 Market Overview (Page No. - 28)
5.1 Introduction
5.2 Market Segmentation
5.2.1 By Types
5.2.2 By Applications
5.2.3 By Regions
5.3 Market Dynamics
5.3.1 Drivers
5.3.1.1 Massive Industrial Growth in the Middle East & Africa
5.3.1.2 Economic Development and Rising Income of Middle Class People
5.3.1.3 Growing International Passenger and Freight Traffic Driving Lubricant Sales in Aviation
5.3.1.4 Increasing Export of Minerals and Crude Oil Driving the Lubricant Demand in Marine
5.3.2 Impact Analysis
5.3.3 Restraints
5.3.3.1 Political Unrest in Some of the Middle East & African Countries
5.3.3.2 Increasing Use of Synthetic and Semi-Synthetic Lubricants
5.3.3.3 Lack of Awareness Among Automotive Lubricant Consumers
5.3.4 Impact Analysis
5.3.5 Opportunities
5.3.5.1 Rapid Industrialization in Sub-Saharan Countries
5.3.5.2 The Middle East Construction Boom Surpasses Global Growth
6 Industry Trends (Page No. - 37)
6.1 Introduction
6.2 Value Chain Analysis
6.3 Porter�s Five forces Analysis
6.3.1 Threat of New Entrants
6.3.2 Threat of Substitutes
6.3.3 Bargaining Power of Suppliers
6.3.4 Bargaining Power of Buyers
6.3.5 Intensity of Competitive Rivalry
6.4 Strategic Benchmarking
6.4.1 Expansion
6.4.2 New Product Launches
7 Middle East & African Lubricants Market, By Type (Page No. - 41)
7.1 Introduction
7.2 Market Size & Projection
7.2.1 Wide Spread Availability & Low Cost Drives the Consumption of Mineral Oil Lubricants
7.3 Mineral Oil Lubricants
7.3.1 High Intake Requirement to Enable Steady Consumption of Mineral Oil Lubricants
7.4 Synthetic Lubricants
7.4.1 Africa to Outpace Middle East Consumption
7.5 Bio-Based Lubricants
7.5.1 Biodegradable Nature of Lubricants to Push Demand
7.6 Greases
7.6.1 Increased Industrial Application Driving the Demand for Lubricants
8 Middle East & African Lubricants Market, By Application (Page No. - 49)
8.1 Introduction
8.2 Market Size & Projection
8.2.1 Growth in Automotive is Driving the Lubricant Demand
8.3 Transportation
8.3.1 Passenger Vehicles Are the Largest Consumer of Lubricants in Transportation
8.3.2 High Vehicle Demand Drives the Lubricant Consumption Market
8.4 Industrial Machinery & Equipment
8.4.1 Increased Manufacturing Activities Behind the High Growth in the Region
9 Regional Analysis (Page No. - 55)
9.1 Introduction
9.2 Middle East
9.2.1 UAE
9.2.2 Iraq
9.2.3 Iran
9.2.4 Saudi Arabia
9.2.5 Bahrain
9.2.6 Qatar
9.2.7 Oman
9.2.8 Kuwait
9.2.9 Israel
9.2.10 Turkey
9.2.11 Syria
9.2.12 Lebanon
9.2.13 Yemen
9.2.14 Palestine
9.3 Africa
9.3.1 Egypt
9.3.2 South Africa
9.3.3 Nigeria
9.3.4 Algeria
9.3.5 Morocco
9.3.6 Sudan
9.3.7 Kenya
9.3.8 Ghana
9.3.9 Zimbabwe
9.3.10 Tanzania
9.3.11 Libya
9.3.12 Togo
9.3.13 Zambia
9.3.14 Namibia
9.3.15 Chad
10 Competitive Landscape (Page No. - 95)
10.1 Overview
10.2 Expansion & Agreements: Most Popular Growth Strategies
10.3 Middle East & Africa: Market Share Analysis, By Company, 2013
10.4 Maximum Developments in 2013
10.5 Total S.A. & Lukoil: the Most Active Participants
10.6 Competitive Situation and Trends
10.6.1 Expansions
10.6.2 Agreements
10.6.3 Contracts
10.6.4 New Product Launches
11 Company Profiles (Page No. - 105)
(Overview, Financial*, Products & Services, Strategy, and Developments)
11.1 Royal Dutch Shell PLC.
11.2 Exxon Mobil Corporation
11.3 BP PLC.
11.4 Chevron Corporation
11.5 Total S.A.
11.6 Petrochina Company Limited
11.7 Sinopec Limited
11.8 Lukoil
11.9 Fuchs Petrolub AG
11.10 Idemitsu Kosan Co. Ltd.
*Details Might Not Be Captured in Case of Unlisted Companies.
12 Appendix (Page No. - 140)
12.1 Discussion Guide
12.2 Available Customizations
12.3 Related Reports
List of Tables (74 Tables)
Table 1 Lubricants Base Oil Categories
Table 2 Lubricants Market Size, By Type, 2012�2019 (KT)
Table 3 Mineral Oil Lubricants Market Size, By Region, 2012�2019 (KT)
Table 4 Synthetic Lubricants Market Size, By Region, 2012�2019 (KT)
Table 5 Bio-Based Lubricants Market Size, By Region, 2012�2019 (KT)
Table 6 Greases Market Size, By Region, 2012�2019 (KT)
Table 7 Lubricants Market Size, By Application, 2012�2019 (KT)
Table 8 Lubricants in Transportation Market Size, By Type, 2012�2019 (KT)
Table 9 Lubricants in Transportation Market Size, By Region, 2012�2019 (KT)
Table 10 Lubricants in industrial Machinery & Equipment Market Size, By Region, 2012�2019 (KT)
Table 11 Lubricants Market Size, By Region, 2012�2019 (KT)
Table 12 Middle East: Lubricants Market Size, By Country, 2012�2019 (KT)
Table 13 Middle East: Lubricants Market Size, By Country, 2012�2019 ($ Million)
Table 14 Middle East: Lubricants Market Size, By Application, 2012�2019 (KT)
Table 15 UAE: Lubricants Market Size, By Type, 2012�2019 (KT)
Table 16 UAE.: Lubricants Market Size, By Application, 2012�2019 (KT)
Table 17 Iraq: Lubricants Market Size, By Type, 2012�2019 (KT)
Table 18 Iraq: Lubricants Market Size, By Application, 2012�2019 (KT)
Table 19 Iran: Lubricants Market Size, By Type, 2012�2019 (KT)
Table 20 Iran: Lubricants Market Size, By Application, 2012�2019 (KT)
Table 21 Saudi Arabia: Lubricants Market Size, By Type, 2012�2019 (KT)
Table 22 Saudi Arabia: Lubricants Market Size, By Application, 2012�2019 (KT)
Table 23 Bahrain: Lubricants Market Size, By Type, 2012�2019 (KT)
Table 24 Bahrain: Lubricants Market Size, By Application, 2012�2019 (KT)
Table 25 Qatar: Lubricants Market Size, By Type, 2012�2019 (KT)
Table 26 Qatar: Lubricants Market Size, By Application, 2012�2019 (KT)
Table 27 Oman: Lubricants Market Size, By Type, 2012�2019 (KT)
Table 28 Oman: Lubricants Market Size, By Application, 2012�2019 (KT)
Table 29 Kuwait.: Lubricants Market Size, By Type, 2012�2019 (KT)
Table 30 Kuwait: Lubricants Market Size, By Application, 2012�2019 (KT)
Table 31 Israel: Lubricants Market Size, By Type, 2012�2019 (KT)
Table 32 Israel: Lubricants Market Size, By Application, 2012�2019 (KT)
Table 33 Turkey: Lubricants Market Size, By Type, 2012�2019 (KT)
Table 34 Turkey: Lubricants Market Size, By Application, 2012�2019 (KT)
Table 35 Syria: Lubricants Market Size, By Type, 2012�2019 (KT)
Table 36 Syria: Lubricants Market Size, By Application, 2012�2019 (KT)
Table 37 Lebanon: Lubricants Market Size, By Type, 2012�2019 (KT)
Table 38 Lebanon: Lubricants Market Size, By Application, 2012�2019 (KT)
Table 39 Yemen: Lubricants Market Size, By Type, 2012�2019 (KT)
Table 40 Yemen: Lubricants Market Size, By Application, 2012�2019 (KT)
Table 41 Palestine: Lubricants Market Size, By Type, 2012�2019 (KT)
Table 42 Palestine: Lubricants Market Size, By Application, 2012�2019 (KT)
Table 43 Africa: Lubricants Market Size, By Country, 2012�2019 (KT)
Table 44 Africa: Lubricants Market Size, By Country, 2012�2019 ($Million)
Table 45 Egypt: Lubricants Market Size, By Type, 2012�2019 (KT)
Table 46 Egypt: Lubricants Market Size, By Application, 2012�2019 (KT)
Table 47 South Africa: Lubricants Market Size, By Type, 2012�2019 (KT)
Table 48 South Africa: Lubricants Market Size, By Application, 2012�2019 (KT)
Table 49 Nigeria: Lubricants Market Size, By Type, 2012�2019 (KT)
Table 50 Nigeria: Lubricants Market Size, By Application, 2012�2019 (KT)
Table 51 Algeria: Lubricants Market Size, By Type, 2012�2019 (KT)
Table 52 Algeria: Lubricants Market Size, By Application, 2012�2019 (KT)
Table 53 Morocco: Lubricants Market Size, By Type, 2012�2019 (KT)
Table 54 Morocco: Lubricants Market Size, By Application, 2012�2019 (KT)
Table 55 Sudan: Lubricants Market Size, By Type, 2012�2019 (KT)
Table 56 Sudan: Lubricants Market Size, By Application, 2012�2019 (KT)
Table 57 Kenya: Lubricants Market Size, By Type, 2012�2019 (KT)
Table 58 Kenya: Lubricants Market Size, By Application, 2012�2019 (KT)
Table 59 Ghana: Lubricants Market Size, By Type, 2012�2019 (KT)
Table 60 Ghana: Lubricants Market Size, By Application, 2012�2019 (KT)
Table 61 Zimbabwe: Lubricants Market Size, By Type, 2012�2019 (KT)
Table 62 Zimbabwe: Lubricants Market Size, By Application, 2012�2019 (KT)
Table 63 Tanzania: Lubricants Market Size, By Type, 2012�2019 (KT)
Table 64 Tanzania: Lubricants Market Size, By Application, 2012�2019 (KT)
Table 65 Libya: Lubricants Market Size, By Type, 2012�2019 (KT)
Table 66 Libya: Lubricants Market Size, By Application, 2012�2019 (KT)
Table 67 Togo: Lubricants Market Size, By Type, 2012�2019 (KT)
Table 68 Togo: Lubricants Market Size, By Application, 2012�2019 (KT)
Table 69 Zambia: Lubricants Market Size, By Type, 2012�2019 (KT)
Table 70 Zambia: Lubricants Market Size, By Application, 2012�2019 (KT)
Table 71 Namibia: Lubricants Market Size, By Type, 2012�2019 (KT)
Table 72 Namibia: Lubricants Market Size, By Application, 2012�2019 (KT)
Table 73 Chad: Lubricants Market Size, By Type, 2012�2019 (KT)
Table 74 Chad: Lubricants Market Size, By Application, 2012�2019 (KT)
List of Figures (57 Figures)
Figure 1 Market Scope
Figure 2 Middle East & Africa Lubricants Market, Research Methodology
Figure 3 Market Size Estimation: Bottom-Up Approach
Figure 4 Market Size Estimation: Top-Down Approach
Figure 5 Break Down of Primary Interviews, By Company Type, & Designation
Figure 6 Key Data From Secondary Sources
Figure 7 Key Data From Primary Sources
Figure 8 Middle East & African Lubricants in Transportation: Market Snapshot (2014 vs 2019):
Figure 9 Middle East & African Lubricant Market Size, By Country, 2014 (KT)
Figure 10 Attractive Opportunities in the Lubricants Market
Figure 11 Mineral Lubricants Has the Maximum Consumption
Figure 12 Transportation Market Captures the Lion�s Share in the Middle East & African Lubricant Market
Figure 13 Nigeria to Emerge as A Lucrative Market
Figure 14 Lubricants Have A Promising Future in the Emerging Economies of the Middle East Region
Figure 15 African Market is Projected to Experience A Growth Phase in the Next Five Years for Lubricants
Figure 16 Lubricants Market Segmentation, By Application
Figure 17 Lubricant Market Segmentation, By Region
Figure 18 Overview of the forces Affecting the Lubricant Market
Figure 19 Market Impact of increasing Use of Synthetic Lubricants
Figure 20 Value Chain Analysis for Lubricants
Figure 21 Porter�s Five forces Analysis (2013)
Figure 22 Strategic Benchmarking: Expansion of Key Players in the Middle East & African Region
Figure 23 New Products Are Launched to Meet the Requirements of Customers
Figure 24 Synthetic Lubricants to Register the Highest CAGR in the Coming Five Years
Figure 25 Transportation Sector to Drive the Mineral Oil Lubricants Market
Figure 26 Synthetic Lubricants Consumption Set to Rise Owing to Its High Drain Out Time
Figure 27 Bio-Based Lubricants to Witness Fastest Growth in Africa
Figure 28 The Middle East & African Region to Witness High Growth
Figure 29 Transportation Segment to Have the Highest Consumption
Figure 30 Increasing Personal Vehicles Boosting the Transportation Industries Demand for Lubricants
Figure 31 The Transportation Application Segment of the Lubricants Market Will Drive the Lubricants Consumption
Figure 32 Increased Demand From Industries is Boosting the Growth of Lubricants in Industrial Machinery & Equipment Market
Figure 33 Regional Snapshot (2013) Rapid Growth Markets Are Emerging as New Hotspots
Figure 34 South Africa, Egypt, and Nigeria in Africa and Iran, Turkey, and Saudi Arabia in the Middle East Are the Emerging Markets for Lubricants
Figure 35 Transportation Sector Will Drive the Lubricants Consumption in Middle East
Figure 36 Industrialization and Inflow of Investments is Driving the Lubricants Consumption in Africa
Figure 37 Key Growth Strategies in the Lubricants Market, 2010�2014
Figure 38 Companies Primarily Adopted Organic Growth Strategies Over the Last Four Years
Figure 39 Middle East & Africa: Market Share Analysis, By Company, 2013
Figure 40 Lubricants Market Developmental Share, 2010�2014
Figure 41 Middle East & Africa Lubricants Market: Growth Strategies, By Company, 2011�2014
Figure 42 Regional Revenue Mix of the Top Five Market Players
Figure 43 Royal Dutch Shell PLC: Business Overview
Figure 44 Royal Dutch Shell PLC: SWOT Analysis
Figure 45 Exxon Mobil Corporation: Business Overview
Figure 46 Exxon Mobil Corporation: SWOT Analysis
Figure 47 BP PLC.: Business Overview
Figure 48 BP PLC: SWOT Analysis
Figure 49 Chevron Corporation: Business Overview
Figure 50 Chevron Corporation: SWOT Analysis
Figure 51 Total S.A.: Business Overview
Figure 52 Total S.A: SWOT Analysis
Figure 53 Petrochina Company Limited: Business Overview
Figure 54 Sinopec Limited: Business Overview
Figure 55 Lukoil: Business Overview
Figure 56 Fuchs Petrolub AG: Business Overview
Figure 57 Idemitsu Kosan Co. Ltd.: Business Overview


Growth opportunities and latent adjacency in Middle East & Africa Lubricants Market