Millimeter Wave Technology Market

Millimeter Wave Technology Market Size, Share, Statistics and Industry Growth Analysis Report by Product (Scanning Systems, Telecommunication Equipment), License Type (Unlicensed, Fully Licensed), Application (Mobile & Telecommunication, Automotive), Component, Frequency Band and Region - Global Forecast to 2028

Report Code: SE 3472 Apr, 2023, by marketsandmarkets.com

[302 Pages Report] The global millimeter wave technology market size is anticipated to grow from USD 2.8 billion in 2023 to USD 7.9 billion by 2028, at a CAGR of 22.8% during 2023 to 2028. Increase in broadband and mobile speeds, rising use of millimeter wave in small cell backhaul networks, and surging demand for millimeter wave technology in security and radar applications are few driving factors accrediting to the growth of millimeter wave technology industry.

Millimeter Wave Technology Market

Millimeter Wave Technology Market

Millimeter Wave Technology Market Forecast to 2028

To know about the assumptions considered for the study, Request for Free Sample Report

Millimeter Wave Technology Market Dynamics

Driver: Growing need for faster data transmission

Implementing work-from-home policies in various cities and countries has become necessary. IT and BPO sectors have made efforts to implement a smoother transition to work from home for thousands of employees. However, this has increased the chances of network bottlenecks. Users are upgrading their internet speed to obtain higher throughput. ISPs are also trying to identify locations of full nodes and splitting them to deliver optimal service. The bandwidth demand is also growing with the ever-increasing number of electronic devices and connections. Mesh network is likely to be the next investment option for ISPs to guarantee speed and access in a world with increased data traffic needs.

Restraint: Low penetration power and adverse impact on environment

The disadvantage of the limited range of millimeter wave technology would force telecom operators to increase towers and other equipment. This range can also be increased with an increase in the transmitting power. However, increased transmitting power can result in increased fuel consumption and radiation. Transmission towers also consume significant space, leading to large-scale deforestation, primarily in rural areas. In addition, several materials, such as SiGe, GaAs, InP, and GaN, that are used in circuitries that work at millimeter wave frequency are toxic, and their prolonged use can be hazardous for the environment.

Opportunity: Emergence of new applications in aerospace & defense industry

New applications for millimeter wave technology in the defense and aerospace sectors are being discovered. Satellite communication is another important application that is expected to grow in the next six years, where unallocated E- and V-band spectra are expected to be used. Millimeter wave is used in several military applications for secure and undisturbed communication in the presence of enemy threats, missile guidance systems, and other munition. Due to the lack of unallocated spectrum in microwave frequency, several military organizations, including Air Force Research Laboratory (AFRL) and Defense Advanced Research Projects Agency (DARPA), have entered the millimeter wave technology industry.

Challenge: Challenges associated with physical properties of millimeter wave

Millimeter waves open more spectrum. However, until recently, only a few electronic components could generate or receive millimeter waves, so the spectrum remained unused. Generating and receiving millimeter waves is challenging, but the traveling media is the bigger challenge associated with these high frequencies. Other major challenges are atmospheric and free-space path loss and poor foliage penetration. Physical parameter such as mechanical resonance, scattering, and non-line-of-sight Issues are the few challenges for the market.

Millimeter Wave Technology Market: Ecosystem

Millimeter Wave Technology Market by Ecosystem

Frequency sources and related components segment is expected to grow at second highest CAGR during the forecast period

Oscillator source devices are the part of frequency sources and related components, which generate 30 GHz to 300 GHz signals. The efficiency of signals generated from millimeter wave systems depends on the nature of frequencies involved in the components manufacturing process. Direct oscillators running at high frequencies are often insufficient to meet most systems’ requirements. To solve this issue, low-frequency oscillators’ frequency multiplication is used to produce the high frequencies required by millimeter wave devices. The basic components in such frequency oscillators are mainly Schottky diodes and varactors. The disadvantage of these components is that they are not compatible with transistors. Thus, the manufacturers of frequency source components focus on creating transistor-based frequency multiplier chains. This could lend greater cost-effectiveness to millimeter wave products, as frequency sources are the most expensive components in millimeter wave devices.

 57–95 GHz segment is expected to grow at highest CAGR during the forecast period

The ascendency of this segment can be attributed to its high demand as it tends numerous applications such as autonomous mining, security and perimeter protection, traffic monitoring, and automated cruise control. The E-band and V-band, which lie in the 57–95 GHz frequency band, are mainly used for telecom applications. This factor is expected to increase the dominance of this frequency band further. Millimeter bands such as V-band (60 GHz) and E-band (70/80 GHz) are suitable for HetNet backhaul as they allow for access network aggregation of traffic from several base stations, which can then be transferred to the mobile switching centers and finally, the core network. Backhaul links using the V-band or the E-band are well suited to support 5G due to their 10 Gbps to 25 Gbps data throughput capabilities.

Mobile & telecommunication segment is expected to grow at highest CAGR during the forecast period

Mobile & telecommunication is a major end-use segment of millimeter wave technology, primarily relying on the communication infrastructure. The E-band and V-band segments are widely preferred frequencies in mobile backhaul solutions. With significant advancements in 5G technology, millimeter wave components have also been gaining traction for the past couple of years. For instance, a laser system manufacturer in the UK has used 5G technology on its factory floor to deliver a digitized design process that includes video and AR/VR. The smart factory used 5G to connect cameras and transfer high-definition image data onto a cloud network in real time. These factors attributed for the growth of mobile & telecommunication segment for millimeter wave technology market share.

Millimeter wave technology market in Asia Pacific is expected to foresee the highest CAGR during the forecast period

The Asia Pacific region is anticipated to foresee the highest growth during the forecast period. Asia Pacific is a key market for millimeter wave technology with significant growth potential owing to the scope for the use of this technology in various applications in the region. The market growth in this region can be attributed to the high population density in Asia Pacific, which makes millimeter wave technology increasingly suitable for use in the region. This is due to this technology’s inherent high data transfer capabilities and its ability to penetrate through obstacles without being genotoxic.

Millimeter Wave Technology Market by Region

Millimeter Wave Technology Market Statistics by Region

To know about the assumptions considered for the study, download the pdf brochure

Key Market Players

Major vendors in the millimeter wave technology companies include Axxcss Wireless Solutions, Inc. (US), NEC Corporation (Japan), Siklu Communication (US), L3HARRIS Technologies, Inc. (US), Smiths Group PLC (UK), Millimeter Wave Products Inc. (US), Farran Technology (Ireland), Eravant (US), Keysight Technologies, Inc. (US), Avait Networks, Inc. (US), Vubiq Networks, Inc. (US), ELVA-1 (Latvia), Verana Networks (US), FastBack Networks (US), and Anokiwave (US).

Get online access to the report on the World's First Market Intelligence Cloud

  • Easy to Download Historical Data & Forecast Numbers
  • Company Analysis Dashboard for high growth potential opportunities
  • Research Analyst Access for customization & queries
  • Competitor Analysis with Interactive dashboard
  • Latest News, Updates & Trend analysis
Request Sample

Scope of the Report

Segment

Subsegment

Estimated Value

USD 2.8 billion

Expected Value 

USD 7.9 billion

Growth Rate

CAGR of 22.8%

Market size available for years

2019—2028

Base year

2022

Forecast period

2023—2028

Units

Value (USD Million/USD Billion)
Volume (Thousand Units)

Segments covered

Component, product, frequency band, license type, and end use

Geographic regions covered

North America, Europe, Asia Pacific, and RoW

Companies covered

Axxcss Wireless Solutions, Inc. (US), NEC Corporation (Japan), Siklu Communication (US), L3HARRIS Technologies, Inc. (US), Smiths Group PLC (UK), Millimeter Wave Products Inc. (US), Farran Technology (Ireland), Eravant (US), Keysight Technologies, Inc. (US), Avait Networks, Inc. (US), Vubiq Networks, Inc. (US), ELVA-1 (Latvia), Verana Networks (US), FastBack Networks (US), and Anokiwave (US) among others

Millimeter Wave Technology Market Highlights

The study categorizes the millimeter wave technology market based on component, product, frequency band, license type, end use and region.

Segment

Subsegment

By Component:

  • Antennas & Transceiver Components
  • Frequency Sources & Related Components
  • Communication & Networking Components
  • Imaging Components
  • RF & Radio Components
  • Sensors & Controls
  • Interface Components
  • Power & Battery Components
  • Others

By Product

  • Scanning Systems
  • Radar and Satellite Communication Systems
  • Telecommunication Equipment
  • Others

By Frequency Band

  • 24–57 GHz 
  • 57–86 GHz 
  • 86–300 GHz

By License Type

  • Light Licensed Frequency Millimeter Wave
  • Unlicensed Frequency Millimeter Wave
  • Fully Licensed Frequency Millimeter Wave

By End Use

  • Mobile & Telecommunication
  • Consumer & Commercial
  • Healthcare
  • Industrial
  • Automotive & Transportation
  • Imaging

By Region

  • North America
    • US
    • Canada
    • Mexico
  • Europe
    • UK
    • France
    • Germany
    • Rest of Europe
  • Asia Pacific
    • China
    • South Korea
    • Japan
    • India
    • Rest of Asia Pacific
  • RoW
    • Middle East & Africa
    • South America

Recent Developments

  • In March 2023, Siklu has made a strategic agreement with WAV and MBSI WAV. These companies are full-service distributors of LTE, wireless broadband, fiber, networking, and Wi-Fi equipment. This development would provide pre-sales engineering, stocking, network design, and post-sales services for Siklu’s solutions operating in the 60/70 and 80 GHz bands. This service caters to various applications such as residential connectivity and video security.
  • In June 2022, Researchers at Tokyo Tech and NEC Corporation have launched a phased-array beamformer for the 5G millimeter wave (mmWave) band. This product enables ultra-low latency in communication along with data rates of over 10 Gbps and a massive capacity to accommodate several users.
  • December 2021, The company proclaimed that it is the first to deliver a complete CTIA-authorized 5G mmWave Over-The-Air (OTA) test system for authenticating device transceiver performance in a laboratory environment, speeding up the rollout of wireless connectivity broadband across the US.

Frequently Asked Questions (FAQ):

To speak to our analyst for a discussion on the above findings, click Speak to Analyst

TABLE OF CONTENTS
 
1 INTRODUCTION (Page No. - 36)
    1.1 STUDY OBJECTIVES 
    1.2 MARKET DEFINITION 
           1.2.1 INCLUSIONS AND EXCLUSIONS
    1.3 MARKET SCOPE 
           1.3.1 MARKETS COVERED
           1.3.2 REGIONAL SCOPE
           1.3.3 YEARS CONSIDERED
    1.4 CURRENCY CONSIDERED 
    1.5 STAKEHOLDERS 
    1.6 SUMMARY OF CHANGES 
           1.6.1 RECESSION IMPACT
 
2 RESEARCH METHODOLOGY (Page No. - 41)
    2.1 RESEARCH DATA 
           FIGURE 1 MILLIMETER WAVE TECHNOLOGY MARKET: RESEARCH DESIGN
           2.1.1 SECONDARY DATA
                    2.1.1.1 Key secondary sources
                    2.1.1.2 Key data from secondary sources
           2.1.2 PRIMARY DATA
                    2.1.2.1 Key primary sources
                    2.1.2.2 Key data from primary sources
                    2.1.2.3 Breakdown of primaries
                    2.1.2.4 Insights from primaries
    2.2 FACTOR ANALYSIS 
           2.2.1 INTRODUCTION
           2.2.2 DEMAND-SIDE ANALYSIS
                    FIGURE 2 RESEARCH METHODOLOGY: MARKET SIZE ESTIMATION APPROACH
                    FIGURE 3 MARKET SIZE ESTIMATION METHODOLOGY USING REVENUE OF MARKET PLAYERS
           2.2.3 SUPPLY-SIDE ANALYSIS
                    FIGURE 4 MARKET SIZE ESTIMATION METHODOLOGY: BOTTOM-UP APPROACH, BY TYPE
    2.3 MARKET SIZE ESTIMATION 
           2.3.1 BOTTOM-UP APPROACH
                    2.3.1.1 Approach to derive market size using bottom-up analysis
                               FIGURE 5 MILLIMETER WAVE TECHNOLOGY MARKET: BOTTOM-UP APPROACH
           2.3.2 TOP-DOWN APPROACH
                    2.3.2.1 Approach to derive market size using top-down analysis
                               FIGURE 6 MARKET SIZE ESTIMATION METHODOLOGY: TOP-DOWN APPROACH
    2.4 MARKET BREAKDOWN AND DATA TRIANGULATION 
           FIGURE 7 DATA TRIANGULATION
    2.5 ASSUMPTIONS 
           2.5.1 FORECASTING ASSUMPTIONS
           2.5.2 GROWTH RATE ASSUMPTIONS
           2.5.3 RESEARCH ASSUMPTIONS
    2.6 LIMITATIONS 
    2.7 RISK ASSESSMENT 
    2.8 RECESSION IMPACT 
 
3 EXECUTIVE SUMMARY (Page No. - 57)
    TABLE 1 GLOBAL MILLIMETER WAVE TECHNOLOGY MARKET, 2019–2028
    FIGURE 8 GDP GROWTH PROJECTION TILL 2023 FOR MAJOR ECONOMIES
    FIGURE 9 TELECOMMUNICATION EQUIPMENT SEGMENT TO LEAD MILLIMETER WAVE TECHNOLOGY MARKET DURING FORECAST PERIOD
    FIGURE 10 FULLY LICENSED SEGMENT TO ACCOUNT FOR LARGEST SHARE OF MILLIMETER WAVE TECHNOLOGY MARKET BY 2028
    FIGURE 11 57–95 GHZ SEGMENT TO HOLD LARGEST MARKET SHARE DURING FORECAST PERIOD
    FIGURE 12 FREQUENCY SOURCES & RELATED COMPONENTS SEGMENT TO HOLD LARGEST MARKET SHARE DURING FORECAST PERIOD
    FIGURE 13 MOBILE & TELECOMMUNICATION SEGMENT TO DOMINATE MILLIMETER WAVE TECHNOLOGY MARKET DURING FORECAST PERIOD
    FIGURE 14 NORTH AMERICA TO ACCOUNT FOR LARGEST SHARE OF MILLIMETER WAVE TECHNOLOGY MARKET BY 2028
 
4 PREMIUM INSIGHTS (Page No. - 63)
    4.1 ATTRACTIVE OPPORTUNITIES FOR PLAYERS IN MILLIMETER WAVE TECHNOLOGY MARKET 
           FIGURE 15 INCREASING USE OF MILLIMETER WAVE TECHNOLOGY IN VARIOUS INDUSTRIES AND SECTORS
    4.2 MILLIMETER WAVE TECHNOLOGY MARKET, BY PRODUCT 
           FIGURE 16 TELECOMMUNICATION EQUIPMENT SEGMENT TO LEAD MILLIMETER WAVE TECHNOLOGY MARKET DURING FORECAST PERIOD
    4.3 MILLIMETER WAVE TECHNOLOGY MARKET, BY LICENSE TYPE 
           FIGURE 17 FULLY LICENSED SEGMENT TO HOLD LARGEST SHARE OF MILLIMETER WAVE TECHNOLOGY MARKET DURING FORECAST PERIOD
    4.4 NORTH AMERICAN MILLIMETER WAVE TECHNOLOGY MARKET, BY END USE AND COUNTRY 
           FIGURE 18 MOBILE & TELECOMMUNICATION SEGMENT AND US TO HOLD LARGEST SHARES OF NORTH AMERICAN MILLIMETER WAVE TECHNOLOGY MARKET IN 2028
    4.5 MILLIMETER WAVE TECHNOLOGY MARKET, BY COUNTRY 
           FIGURE 19 ASIA PACIFIC TO REGISTER HIGHEST CAGR IN MILLIMETER WAVE TECHNOLOGY MARKET DURING FORECAST PERIOD
 
5 MARKET OVERVIEW (Page No. - 66)
    5.1 INTRODUCTION 
    5.2 MARKET DYNAMICS 
           FIGURE 20 MILLIMETER WAVE TECHNOLOGY MARKET: DRIVERS, RESTRAINTS, OPPORTUNITIES, AND CHALLENGES
           5.2.1 DRIVERS
                    FIGURE 21 MILLIMETER WAVE TECHNOLOGY MARKET: DRIVERS AND THEIR IMPACT
                    5.2.1.1 Increase in broadband and mobile speeds
                               FIGURE 22 FIXED BROADBAND SPEEDS
                               FIGURE 23 MOBILE (CELLULAR) SPEEDS
                    5.2.1.2 Rising use of millimeter wave technology in small-cell backhaul networks
                               FIGURE 24 GLOBAL MOBILE DATA TRAFFIC (PER MONTH)
                    5.2.1.3 High demand for millimeter wave technology in security and radar applications
                               TABLE 2 MILLIMETER WAVE FREQUENCIES AND APPLICATIONS
                    5.2.1.4 Growing need for faster data transmission
                               TABLE 3 DEVELOPMENTS IN 60 GHZ FWA SOLUTIONS
           5.2.2 RESTRAINTS
                    FIGURE 25 MILLIMETER WAVE TECHNOLOGY MARKET: RESTRAINTS AND THEIR IMPACT
                    5.2.2.1 Low penetration power and adverse impact on environment
           5.2.3 OPPORTUNITIES
                    FIGURE 26 MILLIMETER WAVE TECHNOLOGY MARKET: OPPORTUNITIES AND THEIR IMPACT
                    5.2.3.1 Surging use of 5G and millimeter wave technologies
                               FIGURE 27 GLOBAL NUMBER OF 5G SUBSCRIBERS, 2020–2028 (MILLION)
                    5.2.3.2 Emergence of new applications in aerospace & defense industry
                    5.2.3.3 Emergence of autonomous vehicles
                    5.2.3.4 Rising number of Internet of Things (IoT)-based devices
                               FIGURE 28 NUMBER OF IOT DEVICES, 2020–2028 (BILLION UNITS)
                    5.2.3.5 Rising use of V-band millimeter waves for last-mile connectivity
           5.2.4 CHALLENGES
                    FIGURE 29 MILLIMETER WAVE TECHNOLOGY MARKET: CHALLENGES AND THEIR IMPACT
                    5.2.4.1 Challenges associated with physical properties of millimeter waves
                               TABLE 4 CHALLENGES ASSOCIATED WITH PHYSICAL PARAMETERS OF MILLIMETER WAVES
    5.3 TRENDS/DISRUPTIONS IMPACTING CUSTOMERS’ BUSINESSES 
           FIGURE 30 REVENUE SHIFT FOR MILLIMETER WAVE TECHNOLOGY MARKET PLAYERS
    5.4 AVERAGE SELLING PRICE (ASP) ANALYSIS 
           5.4.1 AVERAGE SELLING PRICE OF PRODUCTS OFFERED BY KEY PLAYERS
                    FIGURE 31 AVERAGE SELLING PRICE OF PRODUCTS OFFERED BY THREE KEY PLAYERS
                    TABLE 5 AVERAGE SELLING PRICE OF PRODUCTS OFFERED BY THREE KEY PLAYERS (USD)
                    TABLE 6 KEY PROVIDERS OF MILLIMETER WAVE TELECOMMUNICATION PRODUCTS
                    TABLE 7 KEY PROVIDERS OF MILLIMETER WAVE SCANNING PRODUCTS
                    TABLE 8 KEY PROVIDERS OF MILLIMETER WAVE RADAR AND SATELLITE PRODUCTS
    5.5 VALUE CHAIN ANALYSIS 
           FIGURE 32 MILLIMETER WAVE TECHNOLOGY MARKET: VALUE CHAIN ANALYSIS
           5.5.1 RESEARCH AND PRODUCT DEVELOPMENT
           5.5.2 MANUFACTURING
           5.5.3 PRODUCT DISTRIBUTION
           5.5.4 SYSTEM INTEGRATORS
           5.5.5 END USE
    5.6 ECOSYSTEM ANALYSIS 
           FIGURE 33 KEY PARTICIPANTS IN MILLIMETER WAVE TECHNOLOGY ECOSYSTEM
           TABLE 9 MILLIMETER WAVE TECHNOLOGY MARKET: ECOSYSTEM ANALYSIS
    5.7 TECHNOLOGY ANALYSIS 
           5.7.1 MILLIMETER WAVE TECHNOLOGY
           5.7.2 TERAHERTZ WAVES
                    TABLE 10 MILLIMETER WAVE TECHNOLOGY VS. TERAHERTZ WAVE TECHNOLOGY
    5.8 PATENT ANALYSIS 
           FIGURE 34 PATENT ANALYSIS
           TABLE 11 NOTICEABLE PATENTS RELATED TO MILLIMETER WAVE TECHNOLOGY
    5.9 TRADE ANALYSIS 
           FIGURE 35 IMPORT DATA FOR HS CODE 851761 FOR TOP FIVE COUNTRIES IN MILLIMETER WAVE TECHNOLOGY MARKET, 2018–2022 (USD MILLION)
           FIGURE 36 EXPORT DATA FOR HS CODE 851761 FOR TOP FIVE COUNTRIES IN MILLIMETER WAVE TECHNOLOGY MARKET, 2018–2022 (USD MILLION)
    5.10 CASE STUDY ANALYSIS 
           5.10.1 TELECOMMUNICATION
                    5.10.1.1 Porsche Informatik connected campus buildings using LightPointe AireLink 60 SX system
                    5.10.1.2 Skycom1 relies on HaulPass V60s V-Band Wireless links
           5.10.2 IMAGING
                    5.10.2.1 First-to-market radio-wave Breast Imaging System achieved with network analyzer
                    5.10.2.2 Memorial Sloan-Kettering Cancer Center found cure for network congestion with high-speed outdoor wireless links from LightPointe
           5.10.3 AUTOMOTIVE & TRANSPORTATION
                    5.10.3.1 LightPointe connected buildings of Public Transportation Department in Washington State
                    5.10.3.2 Proxim Solutions enabled seamless surveillance along Tenerife Tram Line in Spain
           5.10.4 INDUSTRIAL
                    5.10.4.1 High-capacity industrial wireless connectivity for ArcelorMittal
                    5.10.4.2 Kingston Technology deployed HaulPass V60s wireless broadband for disaster recovery and campus network expansion
           5.10.5 CONSUMER & COMMERCIAL
                    5.10.5.1 Martin Agency deployed LightPointe Free Space Optics wireless bridge to connect buildings
                    5.10.5.2 City of Mission Viejo deployed cost-effective broadband wireless gigabit ethernet link at Potocki Conference Center
    5.11 PORTER’S FIVE FORCES ANALYSIS 
           TABLE 12 MILLIMETER WAVE TECHNOLOGY MARKET: PORTER’S FIVE FORCES ANALYSIS
           5.11.1 DEGREE OF COMPETITION
           5.11.2 THREAT OF NEW ENTRANTS
           5.11.3 THREAT OF SUBSTITUTES
           5.11.4 BARGAINING POWER OF BUYERS
           5.11.5 BARGAINING POWER OF SUPPLIERS
    5.12 KEY CONFERENCES AND EVENTS, 2023–2024 
           TABLE 13 MILLIMETER WAVE TECHNOLOGY MARKET: CONFERENCES AND EVENTS
    5.13 KEY STAKEHOLDERS AND BUYING CRITERIA 
           5.13.1 KEY STAKEHOLDERS IN BUYING PROCESS
                    FIGURE 37 INFLUENCE OF STAKEHOLDERS ON BUYING PROCESS, BY TOP THREE END USES
                    TABLE 14 INFLUENCE OF STAKEHOLDERS ON BUYING PROCESS, BY TOP THREE END USES (%)
           5.13.2 BUYING CRITERIA
                    FIGURE 38 KEY BUYING CRITERIA FOR TOP THREE END USES
    5.14 TARIFF AND REGULATORY LANDSCAPE 
           5.14.1 TARIFFS
                    TABLE 15 TARIFFS FOR BASE STATIONS OF APPARATUS FOR TRANSMISSION OR RECEPTION OF VOICE, IMAGES, OR OTHER DATA EXPORTED BY CHINA
                    TABLE 16 TARIFFS FOR BASE STATIONS OF APPARATUS FOR TRANSMISSION OR RECEPTION OF VOICE, IMAGES, OR OTHER DATA EXPORTED BY HUNGARY
                    TABLE 17 TARIFFS FOR BASE STATIONS OF APPARATUS FOR TRANSMISSION OR RECEPTION OF VOICE, IMAGES, OR OTHER DATA EXPORTED BY VIETNAM
                    TABLE 18 TARIFFS FOR BASE STATIONS OF APPARATUS FOR TRANSMISSION OR RECEPTION OF VOICE, IMAGES, OR OTHER DATA EXPORTED BY SWEDEN
                    TABLE 19 TARIFFS FOR BASE STATIONS OF APPARATUS FOR TRANSMISSION OR RECEPTION OF VOICE, IMAGES, OR OTHER DATA EXPORTED BY US
           5.14.2 REGULATIONS
 
6 SOFTWARE AND SERVICES ASSOCIATED WITH MILLIMETER WAVE TECHNOLOGY (Page No. - 102)
    6.1 SOFTWARE 
    6.2 SERVICES 
    6.3 DESIGNING AND CONSULTING 
           6.3.1 INTEGRATION AND DEPLOYMENT
           6.3.2 SUPPORT AND MAINTENANCE
 
7 MILLIMETER WAVE TECHNOLOGY IN MOBILE AND WIRELESS BACKHAUL (Page No. - 104)
    7.1 MOBILE AND WIRELESS BACKHAUL 
 
8 MILLIMETER WAVE TECHNOLOGY MARKET, BY COMPONENT (Page No. - 105)
    8.1 INTRODUCTION 
    8.2 MARKET SIZE ESTIMATION FOR COMPONENT SEGMENTS 
           FIGURE 39 ANTENNA & TRANSCEIVER COMPONENTS SEGMENT TO REGISTER HIGHEST CAGR IN MILLIMETER WAVE TECHNOLOGY MARKET DURING FORECAST PERIOD
           TABLE 20 MILLIMETER WAVE TECHNOLOGY MARKET, BY COMPONENT, 2019–2022 (USD MILLION)
           TABLE 21 MILLIMETER WAVE TECHNOLOGY MARKET, BY COMPONENT, 2023–2028 (USD MILLION)
    8.3 ANTENNA & TRANSCEIVER COMPONENTS 
           8.3.1 FUNCTIONING OF MILLIMETER WAVE-BASED EQUIPMENT HIGHLY AFFECTED BY ANTENNAS AND TRANSCEIVERS
           TABLE 22 MAJOR PROVIDERS OF MILLIMETER WAVE ANTENNAS
    8.4 FREQUENCY SOURCES & RELATED COMPONENTS 
           8.4.1 MAINLY OSCILLATOR SOURCE DEVICES THAT GENERATE MILLIMETER WAVES
    8.5 COMMUNICATION & NETWORKING COMPONENTS 
           8.5.1 COMMUNICATION & NETWORKING COMPONENTS PLAY VITAL ROLE IN TELECOMMUNICATION
    8.6 IMAGING COMPONENTS 
           8.6.1 IMAGING COMPONENTS FIND APPLICATIONS IN AUTOMOTIVE, MEDICAL, AND INDUSTRIAL INSPECTION
    8.7 RF & RADIO COMPONENTS 
           8.7.1 USED IN MILLIMETER WAVE RADIOS FOR SMALL-CELL BACKHAUL APPLICATIONS
    8.8 SENSORS & CONTROLS 
           8.8.1 USED IN MILLIMETER WAVE SCANNERS
    8.9 INTERFACE COMPONENTS 
           8.9.1 MAINLY INCLUDE INPUT AND OUTPUT CONTROLS
    8.10 POWER & BATTERY COMPONENTS 
           8.10.1 MILLIMETER WAVE TECHNOLOGY PLAYS IMPORTANT ROLE IN IMPLEMENTING WIRELESS POWER TRANSFER TECHNOLOGY
    8.11 OTHERS 
 
9 MILLIMETER WAVE TECHNOLOGY MARKET, BY FREQUENCY BAND (Page No. - 114)
    9.1 INTRODUCTION 
           FIGURE 40 57–86 GHZ SEGMENT TO REGISTER HIGHEST CAGR IN MILLIMETER WAVE TECHNOLOGY MARKET DURING FORECAST PERIOD
           TABLE 23 MILLIMETER WAVE TECHNOLOGY MARKET, BY FREQUENCY BAND, 2019–2022 (USD MILLION)
           TABLE 24 MILLIMETER WAVE TECHNOLOGY MARKET, BY FREQUENCY BAND, 2023–2028 (USD MILLION)
           FIGURE 41 AVERAGE PRICE PER FREQUENCY BAND (GHZ) IN 2022 (USD)
    9.2 24–57 GHZ 
           9.2.1 INCREASING USE OF MILLIMETER WAVES WITH FREQUENCY BANDS BETWEEN 24 AND 57 GHZ IN TELECOMMUNICATIONS INDUSTRY
    9.3 57–95 GHZ 
           9.3.1 INCREASING APPLICATIONS OF MILLIMETER WAVES WITH FREQUENCY BANDS BETWEEN 57 AND 86 GHZ IN AUTOMOTIVE, HEALTHCARE, AND TELECOMMUNICATIONS INDUSTRIES
           TABLE 25 CHARACTERISTICS OF V-BAND AND E-BAND
           9.3.2 V-BAND
           9.3.3 E-BAND
    9.4 95–300 GHZ 
           9.4.1 RISING USE OF MILLIMETER WAVES WITH FREQUENCY BANDS BETWEEN 95 AND 300 GHZ FOR TELECOMMUNICATION IN AEROSPACE & DEFENSE INDUSTRY
 
10 MILLIMETER WAVE TECHNOLOGY MARKET, BY LICENSE TYPE (Page No. - 122)
     10.1 INTRODUCTION 
             FIGURE 42 UNLICENSED SEGMENT TO REGISTER HIGHEST CAGR IN MILLIMETER WAVE TECHNOLOGY MARKET DURING FORECAST PERIOD
             TABLE 26 MILLIMETER WAVE TECHNOLOGY MARKET, BY LICENSE TYPE, 2019–2022 (USD MILLION)
             TABLE 27 MILLIMETER WAVE TECHNOLOGY MARKET, BY LICENSE TYPE, 2023–2028 (USD MILLION)
     10.2 LIGHT LICENSED 
             10.2.1 ENABLES POINT-TO-POINT WIRELESS COMMUNICATION
     10.3 UNLICENSED 
             10.3.1 UNAFFECTED BY WIND OR SUNLIGHT
     10.4 FULLY LICENSED 
             10.4.1 WIDELY ADOPTED IN TELECOMMUNICATIONS INDUSTRY
 
11 MILLIMETER WAVE TECHNOLOGY MARKET, BY PRODUCT (Page No. - 127)
     11.1 INTRODUCTION 
             FIGURE 43 TELECOMMUNICATION EQUIPMENT SEGMENT TO REGISTER HIGHEST CAGR IN MILLIMETER WAVE TECHNOLOGY MARKET DURING FORECAST PERIOD
             TABLE 28 MILLIMETER WAVE TECHNOLOGY MARKET, BY PRODUCT, 2019–2022 (USD MILLION)
             TABLE 29 MILLIMETER WAVE TECHNOLOGY MARKET, BY PRODUCT, 2023–2028 (USD MILLION)
             TABLE 30 MILLIMETER WAVE TECHNOLOGY MARKET, BY PRODUCT, 2019–2022 (THOUSAND UNITS)
             TABLE 31 MILLIMETER WAVE TECHNOLOGY MARKET, BY PRODUCT, 2023–2028 (THOUSAND UNITS)
     11.2 SCANNING SYSTEMS 
             TABLE 32 SCANNING SYSTEMS: MILLIMETER WAVE TECHNOLOGY MARKET, BY TYPE, 2019–2022 (USD MILLION)
             TABLE 33 SCANNING SYSTEMS: MILLIMETER WAVE TECHNOLOGY MARKET, BY TYPE, 2023–2028 (USD MILLION)
             TABLE 34 SCANNING SYSTEMS: NORTH AMERICA MILLIMETER WAVE TECHNOLOGY MARKET, BY COUNTRY, 2019–2022 (USD MILLION)
             TABLE 35 SCANNING SYSTEMS: NORTH AMERICA MILLIMETER WAVE TECHNOLOGY MARKET, BY COUNTRY, 2023–2028 (USD MILLION)
             TABLE 36 SCANNING SYSTEMS: EUROPE MILLIMETER WAVE TECHNOLOGY MARKET, BY COUNTRY, 2019–2022 (USD MILLION)
             TABLE 37 SCANNING SYSTEMS: EUROPE MILLIMETER WAVE TECHNOLOGY MARKET, BY COUNTRY, 2023–2028 (USD MILLION)
             TABLE 38 SCANNING SYSTEMS: ASIA PACIFIC MILLIMETER WAVE TECHNOLOGY MARKET, BY COUNTRY, 2019–2022 (USD MILLION)
             TABLE 39 SCANNING SYSTEMS: ASIA PACIFIC MILLIMETER WAVE TECHNOLOGY MARKET, BY COUNTRY, 2023–2028 (USD MILLION)
             TABLE 40 SCANNER SYSTEMS: ROW MILLIMETER WAVE TECHNOLOGY MARKET, BY REGION, 2019–2022 (USD MILLION)
             TABLE 41 SCANNER SYSTEMS: ROW MILLIMETER WAVE TECHNOLOGY MARKET, BY REGION, 2023–2028 (USD MILLION)
             TABLE 42 SCANNING SYSTEMS: MILLIMETER WAVE TECHNOLOGY MARKET, BY COMPONENT, 2019–2022 (USD MILLION)
             TABLE 43 SCANNER SYSTEMS: MILLIMETER WAVE TECHNOLOGY MARKET, BY COMPONENT, 2023–2028 (USD MILLION)
             11.2.1 ACTIVE SCANNERS
                        11.2.1.1 Direct millimeter wave energy at subject and interpret reflected energy
             11.2.2 PASSIVE SCANNERS
                        11.2.2.1 Generate images using ambient radiation and radiation discharged from human body or objects
     11.3 RADAR & SATELLITE COMMUNICATION SYSTEMS 
             TABLE 44 RADAR & SATELLITE COMMUNICATION SYSTEMS: MILLIMETER WAVE TECHNOLOGY MARKET, BY TYPE, 2019–2022 (USD MILLION)
             TABLE 45 RADAR & SATELLITE COMMUNICATION SYSTEMS: MILLIMETER WAVE TECHNOLOGY MARKET, BY TYPE, 2023–2028 (USD MILLION)
             TABLE 46 RADAR & SATELLITE COMMUNICATION SYSTEMS: NORTH AMERICA MILLIMETER WAVE TECHNOLOGY MARKET, BY COUNTRY, 2019–2022 (USD MILLION)
             TABLE 47 RADAR & SATELLITE COMMUNICATION SYSTEMS: NORTH AMERICA MILLIMETER WAVE TECHNOLOGY MARKET, BY COUNTRY, 2023–2028 (USD MILLION)
             TABLE 48 RADAR & SATELLITE COMMUNICATION SYSTEMS: EUROPE MILLIMETER WAVE TECHNOLOGY MARKET, BY COUNTRY, 2019–2022 (USD MILLION)
             TABLE 49 RADAR & SATELLITE COMMUNICATION SYSTEMS: EUROPE MILLIMETER WAVE TECHNOLOGY MARKET, BY COUNTRY, 2023–2028 (USD MILLION)
             TABLE 50 RADAR & SATELLITE COMMUNICATION SYSTEMS: ASIA PACIFIC MILLIMETER WAVE TECHNOLOGY MARKET, BY COUNTRY, 2019–2022 (USD MILLION)
             TABLE 51 RADAR & SATELLITE COMMUNICATION SYSTEMS: ASIA PACIFIC MILLIMETER WAVE TECHNOLOGY MARKET, BY COUNTRY, 2023–2028 (USD MILLION)
             TABLE 52 RADAR & SATELLITE COMMUNICATION SYSTEMS: ROW MILLIMETER WAVE TECHNOLOGY MARKET, BY REGION, 2019–2022 (USD MILLION)
             TABLE 53 RADAR & SATELLITE COMMUNICATION SYSTEMS: ROW MILLIMETER WAVE TECHNOLOGY MARKET, BY REGION, 2023–2028 (USD MILLION)
             TABLE 54 RADAR & SATELLITE COMMUNICATION SYSTEMS: MILLIMETER WAVE TECHNOLOGY MARKET, BY COMPONENT, 2019–2022 (USD MILLION)
             TABLE 55 RADAR & SATELLITE COMMUNICATION SYSTEMS: MILLIMETER WAVE TECHNOLOGY MARKET, BY COMPONENT, 2023–2028 (USD MILLION)
             11.3.1 PERIMETER SURVEILLANCE RADAR SYSTEMS (PSRS)
                        11.3.1.1 Used to monitor critical and highly secured areas
             11.3.2 APPLICATION-SPECIFIC RADAR SYSTEMS
                        11.3.2.1 Used in automobile and defense applications
             11.3.3 SATELLITE COMMUNICATION SYSTEMS
                        11.3.3.1 Incorporated mainly into repeaters for use in V-band and E-band
     11.4 TELECOMMUNICATION EQUIPMENT 
             11.4.1 MOBILE BACKHAUL EQUIPMENT
                        11.4.1.1 Refers to procedure of transmitting data to backbone network
             11.4.2 SMALL-CELL EQUIPMENT
                        11.4.2.1 Uses unlicensed 60 GHz frequency band
             11.4.3 MACROCELL EQUIPMENT
                        11.4.3.1 Used in wide outdoor coverage ranging from 3 to 5 km (1.8–3 miles)
                                     TABLE 56 TELECOMMUNICATION EQUIPMENT: MILLIMETER WAVE TECHNOLOGY MARKET, BY TYPE, 2019–2022 (USD MILLION)
                                     TABLE 57 TELECOMMUNICATION EQUIPMENT: MILLIMETER WAVE TECHNOLOGY MARKET, BY TYPE, 2023–2028 (USD MILLION)
                                     TABLE 58 TELECOMMUNICATION EQUIPMENT: NORTH AMERICA MILLIMETER WAVE TECHNOLOGY MARKET, BY COUNTRY, 2019–2022 (USD MILLION)
                                     TABLE 59 TELECOMMUNICATION EQUIPMENT: NORTH AMERICA MILLIMETER WAVE TECHNOLOGY MARKET, BY COUNTRY, 2023–2028 (USD MILLION)
                                     TABLE 60 TELECOMMUNICATION EQUIPMENT: EUROPE MILLIMETER WAVE TECHNOLOGY MARKET, BY COUNTRY, 2019–2022 (USD MILLION)
                                     TABLE 61 TELECOMMUNICATION EQUIPMENT: EUROPE MILLIMETER WAVE TECHNOLOGY MARKET, BY COUNTRY, 2023–2028 (USD MILLION)
                                     TABLE 62 TELECOMMUNICATION EQUIPMENT: ASIA PACIFIC MILLIMETER WAVE TECHNOLOGY MARKET, BY COUNTRY, 2019–2022 (USD MILLION)
                                     TABLE 63 TELECOMMUNICATION EQUIPMENT: ASIA PACIFIC MILLIMETER WAVE TECHNOLOGY MARKET, BY COUNTRY, 2023–2028 (USD MILLION)
                                     TABLE 64 TELECOMMUNICATION EQUIPMENT: ROW MILLIMETER WAVE TECHNOLOGY MARKET, BY REGION, 2019–2022 (USD MILLION)
                                     TABLE 65 TELECOMMUNICATION EQUIPMENT: ROW MILLIMETER WAVE TECHNOLOGY MARKET, BY REGION, 2023–2028 (USD MILLION)
                                     TABLE 66 TELECOMMUNICATION EQUIPMENT: MILLIMETER WAVE TECHNOLOGY MARKET, BY COMPONENT, 2019–2022 (USD MILLION)
                                     TABLE 67 TELECOMMUNICATION EQUIPMENT: MILLIMETER WAVE TECHNOLOGY MARKET, BY COMPONENT, 2023–2028 (USD MILLION)
     11.5 OTHERS 
               TABLE 68 OTHERS: NORTH AMERICA MILLIMETER WAVE TECHNOLOGY MARKET, BY COUNTRY, 2019–2022 (USD MILLION)
               TABLE 69 OTHERS: NORTH AMERICA MILLIMETER WAVE TECHNOLOGY MARKET, BY COUNTRY, 2023–2028 (USD MILLION)
               TABLE 70 OTHERS: EUROPE MILLIMETER WAVE TECHNOLOGY MARKET, BY COUNTRY, 2019–2022 (USD MILLION)
               TABLE 71 OTHERS: EUROPE MILLIMETER WAVE TECHNOLOGY MARKET, BY COUNTRY, 2023–2028 (USD MILLION)
               TABLE 72 OTHERS: ASIA PACIFIC MILLIMETER WAVE TECHNOLOGY MARKET, BY COUNTRY, 2019–2022 (USD MILLION)
               TABLE 73 OTHERS: ASIA PACIFIC MILLIMETER WAVE TECHNOLOGY MARKET, BY COUNTRY, 2023–2028 (USD MILLION)
               TABLE 74 OTHERS: ROW MILLIMETER WAVE TECHNOLOGY MARKET, BY REGION, 2019–2022 (USD MILLION)
               TABLE 75 OTHERS: ROW MILLIMETER WAVE TECHNOLOGY MARKET, BY REGION, 2023–2028 (USD MILLION)
 
12 MILLIMETER WAVE TECHNOLOGY MARKET, BY END USE (Page No. - 150)
     12.1 INTRODUCTION 
             FIGURE 44 MOBILE & TELECOMMUNICATION SEGMENT TO REGISTER HIGHEST CAGR IN MILLIMETER WAVE TECHNOLOGY MARKET DURING FORECAST PERIOD
             TABLE 76 MILLIMETER WAVE TECHNOLOGY MARKET, BY END USE, 2019–2022 (USD MILLION)
             TABLE 77 MILLIMETER WAVE TECHNOLOGY MARKET, BY END USE, 2023–2028 (USD MILLION)
     12.2 MOBILE & TELECOMMUNICATION 
             12.2.1 ADVANCEMENTS IN 5G TECHNOLOGY
                        TABLE 78 MOBILE & TELECOMMUNICATION: NORTH AMERICA MILLIMETER WAVE TECHNOLOGY MARKET, BY COUNTRY, 2019–2022 (USD MILLION)
                        TABLE 79 MOBILE & TELECOMMUNICATION: NORTH AMERICA MILLIMETER WAVE TECHNOLOGY MARKET, BY COUNTRY, 2023–2028 (USD MILLION)
                        TABLE 80 MOBILE & TELECOMMUNICATION: EUROPE MILLIMETER WAVE TECHNOLOGY MARKET, BY COUNTRY, 2019–2022 (USD MILLION)
                        TABLE 81 MOBILE & TELECOMMUNICATION: EUROPE MILLIMETER WAVE TECHNOLOGY MARKET, BY COUNTRY, 2023–2028 (USD MILLION)
                        TABLE 82 MOBILE & TELECOMMUNICATION: ASIA PACIFIC MILLIMETER WAVE TECHNOLOGY MARKET, BY COUNTRY, 2019–2022 (USD MILLION)
                        TABLE 83 MOBILE & TELECOMMUNICATION: ASIA PACIFIC MILLIMETER WAVE TECHNOLOGY MARKET, BY COUNTRY, 2023–2028 (USD MILLION)
                        TABLE 84 MOBILE & TELECOMMUNICATION: ROW MILLIMETER WAVE TECHNOLOGY MARKET, BY REGION, 2019–2022 (USD MILLION)
                        TABLE 85 MOBILE & TELECOMMUNICATION: ROW MILLIMETER WAVE TECHNOLOGY MARKET, BY REGION, 2023–2028 (USD MILLION)
     12.3 CONSUMER & COMMERCIAL 
             12.3.1 INCREASING USE OF MILLIMETER WAVE TECHNOLOGY IN WIRELESS SENSORS AND WIRELESS SECURITY APPLICATIONS
                        TABLE 86 CONSUMER & COMMERCIAL: NORTH AMERICA MILLIMETER WAVE TECHNOLOGY MARKET, BY COUNTRY, 2019–2022 (USD MILLION)
                        TABLE 87 CONSUMER & COMMERCIAL: NORTH AMERICA MILLIMETER WAVE TECHNOLOGY MARKET, BY COUNTRY, 2023–2028 (USD MILLION)
                        TABLE 88 CONSUMER & COMMERCIAL: EUROPE MILLIMETER WAVE TECHNOLOGY MARKET, BY COUNTRY, 2019–2022 (USD MILLION)
                        TABLE 89 CONSUMER & COMMERCIAL: EUROPE MILLIMETER WAVE TECHNOLOGY MARKET, BY COUNTRY, 2023–2028 (USD MILLION)
                        TABLE 90 CONSUMER & COMMERCIAL: ASIA PACIFIC MILLIMETER WAVE TECHNOLOGY MARKET, BY COUNTRY, 2019–2022 (USD MILLION)
                        TABLE 91 CONSUMER & COMMERCIAL: ASIA PACIFIC MILLIMETER WAVE TECHNOLOGY MARKET, BY COUNTRY, 2023–2028 (USD MILLION)
                        TABLE 92 CONSUMER & COMMERCIAL: ROW MILLIMETER WAVE TECHNOLOGY MARKET, BY REGION, 2019–2022 (USD MILLION)
                        TABLE 93 CONSUMER & COMMERCIAL: ROW MILLIMETER WAVE TECHNOLOGY MARKET, BY REGION, 2023–2028 (USD MILLION)
     12.4 HEALTHCARE 
             12.4.1 RISING USE OF MILLIMETER WAVE TECHNOLOGY IN MEDICAL SCANNING AND IMAGING APPLICATIONS
                        TABLE 94 HEALTHCARE: NORTH AMERICA MILLIMETER WAVE TECHNOLOGY MARKET, BY COUNTRY, 2019–2022 (USD MILLION)
                        TABLE 95 HEALTHCARE: NORTH AMERICA MILLIMETER WAVE TECHNOLOGY MARKET, BY COUNTRY, 2023–2028 (USD MILLION)
                        TABLE 96 HEALTHCARE: EUROPE MILLIMETER WAVE TECHNOLOGY MARKET, BY COUNTRY, 2019–2022 (USD MILLION)
                        TABLE 97 HEALTHCARE: EUROPE MILLIMETER WAVE TECHNOLOGY MARKET, BY COUNTRY, 2023–2028 (USD MILLION)
                        TABLE 98 HEALTHCARE: ASIA PACIFIC MILLIMETER WAVE TECHNOLOGY MARKET, BY COUNTRY, 2019–2022 (USD MILLION)
                        TABLE 99 HEALTHCARE: ASIA PACIFIC MILLIMETER WAVE TECHNOLOGY MARKET, BY COUNTRY, 2023–2028 (USD MILLION)
                        TABLE 100 HEALTHCARE: ROW MILLIMETER WAVE TECHNOLOGY MARKET, BY REGION, 2019–2022 (USD MILLION)
                        TABLE 101 HEALTHCARE: ROW MILLIMETER WAVE TECHNOLOGY MARKET, BY REGION, 2023–2028 (USD MILLION)
     12.5 INDUSTRIAL 
             12.5.1 GROWING ADOPTION OF MILLIMETER WAVE TECHNOLOGY FOR LEVEL MEASUREMENTS
                        TABLE 102 INDUSTRIAL: NORTH AMERICA MILLIMETER WAVE TECHNOLOGY MARKET, BY COUNTRY, 2019–2022 (USD MILLION)
                        TABLE 103 INDUSTRIAL: NORTH AMERICA MILLIMETER WAVE TECHNOLOGY MARKET, BY COUNTRY, 2023–2028 (USD MILLION)
                        TABLE 104 INDUSTRIAL: EUROPE MILLIMETER WAVE TECHNOLOGY MARKET, BY COUNTRY, 2019–2022 (USD MILLION)
                        TABLE 105 INDUSTRIAL: EUROPE MILLIMETER WAVE TECHNOLOGY MARKET, BY COUNTRY, 2023–2028 (USD MILLION)
                        TABLE 106 INDUSTRIAL: ASIA PACIFIC MILLIMETER WAVE TECHNOLOGY MARKET, BY COUNTRY, 2019–2022 (USD MILLION)
                        TABLE 107 INDUSTRIAL: ASIA PACIFIC MILLIMETER WAVE TECHNOLOGY MARKET, BY COUNTRY, 2023–2028 (USD MILLION)
                        TABLE 108 INDUSTRIAL: ROW MILLIMETER WAVE TECHNOLOGY MARKET, BY REGION, 2019–2022 (USD MILLION)
                        TABLE 109 INDUSTRIAL: ROW MILLIMETER WAVE TECHNOLOGY MARKET, BY REGION, 2023–2028 (USD MILLION)
     12.6 AUTOMOTIVE & TRANSPORTATION 
             12.6.1 INCREASING INCORPORATION OF MILLIMETER WAVE RADARS INTO AUTONOMOUS VEHICLES
                        TABLE 110 AUTOMOTIVE & TRANSPORTATION: NORTH AMERICA MILLIMETER WAVE TECHNOLOGY MARKET, BY COUNTRY, 2019–2022 (USD MILLION)
                        TABLE 111 AUTOMOTIVE & TRANSPORTATION: NORTH AMERICA MILLIMETER WAVE TECHNOLOGY MARKET, BY COUNTRY, 2023–2028 (USD MILLION)
                        TABLE 112 AUTOMOTIVE & TRANSPORTATION: EUROPE MILLIMETER WAVE TECHNOLOGY MARKET, BY COUNTRY, 2019–2022 (USD MILLION)
                        TABLE 113 AUTOMOTIVE & TRANSPORTATION: EUROPE MILLIMETER WAVE TECHNOLOGY MARKET, BY COUNTRY, 2023–2028 (USD MILLION)
                        TABLE 114 AUTOMOTIVE & TRANSPORTATION: ASIA PACIFIC MILLIMETER WAVE TECHNOLOGY MARKET, BY COUNTRY, 2019–2022 (USD MILLION)
                        TABLE 115 AUTOMOTIVE & TRANSPORTATION: ASIA PACIFIC MILLIMETER WAVE TECHNOLOGY MARKET, BY COUNTRY, 2023–2028 (USD MILLION)
                        TABLE 116 AUTOMOTIVE & TRANSPORTATION: ROW MILLIMETER WAVE TECHNOLOGY MARKET, BY REGION, 2019–2022 (USD MILLION)
                        TABLE 117 AUTOMOTIVE & TRANSPORTATION: ROW MILLIMETER WAVE TECHNOLOGY MARKET, BY REGION, 2023–2028 (USD MILLION)
     12.7 AEROSPACE & DEFENSE 
             12.7.1 RISING USE OF MILLIMETER WAVE TECHNOLOGY IN AIRCRAFT AND SATELLITES
                        TABLE 118 AEROSPACE & DEFENSE: NORTH AMERICA MILLIMETER WAVE TECHNOLOGY MARKET, BY COUNTRY, 2019–2022 (USD MILLION)
                        TABLE 119 AEROSPACE & DEFENSE: NORTH AMERICA MILLIMETER WAVE TECHNOLOGY MARKET, BY COUNTRY, 2023–2028 (USD MILLION)
                        TABLE 120 AEROSPACE & DEFENSE: EUROPE MILLIMETER WAVE TECHNOLOGY MARKET, BY COUNTRY, 2019–2022 (USD MILLION)
                        TABLE 121 AEROSPACE & DEFENSE: EUROPE MILLIMETER WAVE TECHNOLOGY MARKET, BY COUNTRY, 2023–2028 (USD MILLION)
                        TABLE 122 AEROSPACE & DEFENSE: ASIA PACIFIC MILLIMETER WAVE TECHNOLOGY MARKET, BY COUNTRY, 2019–2022 (USD MILLION)
                        TABLE 123 AEROSPACE & DEFENSE: ASIA PACIFIC MILLIMETER WAVE TECHNOLOGY MARKET, BY COUNTRY, 2023–2028 (USD MILLION)
                        TABLE 124 AEROSPACE & DEFENSE: ROW MILLIMETER WAVE TECHNOLOGY MARKET, BY REGION, 2019–2022 (USD MILLION)
                        TABLE 125 AEROSPACE & DEFENSE: ROW MILLIMETER WAVE TECHNOLOGY MARKET, BY REGION, 2023–2028 (USD MILLION)
     12.8 IMAGING 
             12.8.1 RISING ADOPTION OF MILLIMETER WAVE-BASED IMAGING PRODUCTS AT AIRPORTS AND CONCERTS
                        TABLE 126 IMAGING: NORTH AMERICA MILLIMETER WAVE TECHNOLOGY MARKET, BY COUNTRY, 2019–2022 (USD MILLION)
                        TABLE 127 IMAGING: NORTH AMERICA MILLIMETER WAVE TECHNOLOGY MARKET, BY COUNTRY, 2023–2028 (USD MILLION)
                        TABLE 128 IMAGING: EUROPE MILLIMETER WAVE TECHNOLOGY MARKET, BY COUNTRY, 2019–2022 (USD MILLION)
                        TABLE 129 IMAGING: EUROPE MILLIMETER WAVE TECHNOLOGY MARKET, BY COUNTRY, 2023–2028 (USD MILLION)
                        TABLE 130 IMAGING: ASIA PACIFIC MILLIMETER WAVE TECHNOLOGY MARKET, BY COUNTRY, 2019–2022 (USD MILLION)
                        TABLE 131 IMAGING: ASIA PACIFIC MILLIMETER WAVE TECHNOLOGY MARKET, BY COUNTRY, 2023–2028 (USD MILLION)
                        TABLE 132 IMAGING: ROW MILLIMETER WAVE TECHNOLOGY MARKET, BY REGION, 2019–2022 (USD MILLION)
                        TABLE 133 IMAGING: ROW MILLIMETER WAVE TECHNOLOGY MARKET, BY REGION, 2023–2028 (USD MILLION)
 
13 MILLIMETER WAVE TECHNOLOGY MARKET, BY REGION (Page No. - 177)
     13.1 INTRODUCTION 
             FIGURE 45 NORTH AMERICA TO ACCOUNT FOR LARGEST SHARE OF MILLIMETER WAVE TECHNOLOGY MARKET FROM 2023 TO 2028
             TABLE 134 MILLIMETER WAVE TECHNOLOGY MARKET, BY REGION, 2019–2022 (USD MILLION)
             TABLE 135 MILLIMETER WAVE TECHNOLOGY MARKET, BY REGION, 2023–2028 (USD MILLION)
             TABLE 136 MILLIMETER WAVE TECHNOLOGY MARKET, BY REGION, 2019–2022 (THOUSAND UNITS)
             TABLE 137 MILLIMETER WAVE TECHNOLOGY MARKET, BY REGION, 2023–2028 (THOUSAND UNITS)
     13.2 NORTH AMERICA 
             13.2.1 NORTH AMERICA: RECESSION IMPACT
                        FIGURE 46 NORTH AMERICA: SNAPSHOT OF MILLIMETER WAVE TECHNOLOGY MARKET
                        TABLE 138 NORTH AMERICA: MILLIMETER WAVE TECHNOLOGY MARKET, BY COUNTRY, 2019–2022 (USD MILLION)
                        TABLE 139 NORTH AMERICA: MILLIMETER WAVE TECHNOLOGY MARKET, BY COUNTRY, 2023–2028 (USD MILLION)
                        TABLE 140 NORTH AMERICA: MILLIMETER WAVE TECHNOLOGY MARKET, BY END USE, 2019–2022 (USD MILLION)
                        TABLE 141 NORTH AMERICA: MILLIMETER WAVE TECHNOLOGY MARKET, BY END USE, 2023–2028 (USD MILLION)
                        TABLE 142 NORTH AMERICA: MILLIMETER WAVE TECHNOLOGY MARKET, BY PRODUCT, 2019–2022 (USD MILLION)
                        TABLE 143 NORTH AMERICA: MILLIMETER WAVE TECHNOLOGY MARKET, BY PRODUCT, 2023–2028 (USD MILLION)
             13.2.2 US
                        13.2.2.1 Large presence of key companies offering millimeter wave technology
                                    TABLE 144 US: MILLIMETER WAVE TECHNOLOGY MARKET, BY END USE, 2019–2022 (USD MILLION)
                                    TABLE 145 US: MILLIMETER WAVE TECHNOLOGY MARKET, BY END USE, 2023–2028 (USD MILLION)
                                    TABLE 146 US: MILLIMETER WAVE TECHNOLOGY MARKET, BY PRODUCT, 2019–2022 (USD MILLION)
                                    TABLE 147 US: MILLIMETER WAVE TECHNOLOGY MARKET, BY PRODUCT, 2023–2028 (USD MILLION)
             13.2.3 CANADA
                        13.2.3.1 Rise in number of 5G rollouts
                                    TABLE 148 CANADA: MILLIMETER WAVE TECHNOLOGY MARKET, BY END USE, 2019–2022 (USD MILLION)
                                    TABLE 149 CANADA: MILLIMETER WAVE TECHNOLOGY MARKET, BY END USE, 2023–2028 (USD MILLION)
                                    TABLE 150 CANADA: MILLIMETER WAVE TECHNOLOGY MARKET, BY PRODUCT, 2019–2022 (USD MILLION)
                                    TABLE 151 CANADA: MILLIMETER WAVE TECHNOLOGY MARKET, BY PRODUCT, 2023–2028 (USD MILLION)
             13.2.4 MEXICO
                        13.2.4.1 Expanding telecommunications industry with rising adoption of 5G technology
                                    TABLE 152 MEXICO: MILLIMETER WAVE TECHNOLOGY MARKET, BY END USE, 2019–2022 (USD MILLION)
                                    TABLE 153 MEXICO: MILLIMETER WAVE TECHNOLOGY MARKET, BY END USE, 2023–2028 (USD MILLION)
                                    TABLE 154 MEXICO: MILLIMETER WAVE TECHNOLOGY MARKET, BY PRODUCT, 2019–2022 (USD MILLION)
                                    TABLE 155 MEXICO: MILLIMETER WAVE TECHNOLOGY MARKET, BY PRODUCT, 2023–2028 (USD MILLION)
     13.3 EUROPE 
             13.3.1 EUROPE: RECESSION IMPACT
                        FIGURE 47 EUROPE: SNAPSHOT OF MILLIMETER WAVE TECHNOLOGY MARKET
                        TABLE 156 EUROPE: MILLIMETER WAVE TECHNOLOGY MARKET, BY COUNTRY, 2019–2022 (USD MILLION)
                        TABLE 157 EUROPE: MILLIMETER WAVE TECHNOLOGY MARKET, BY COUNTRY, 2023–2028 (USD MILLION)
                        TABLE 158 EUROPE: MILLIMETER WAVE TECHNOLOGY MARKET, BY END USE, 2019–2022 (USD MILLION)
                        TABLE 159 EUROPE: MILLIMETER WAVE TECHNOLOGY MARKET, BY END USE, 2023–2028 (USD MILLION)
                        TABLE 160 EUROPE: MILLIMETER WAVE TECHNOLOGY MARKET, BY PRODUCT, 2019–2022 (USD MILLION)
                        TABLE 161 EUROPE: MILLIMETER WAVE TECHNOLOGY MARKET, BY PRODUCT, 2023–2028 (USD MILLION)
             13.3.2 UK
                        13.3.2.1 Increased government-led investments in telecommunications industry
                                    TABLE 162 UK: MILLIMETER WAVE TECHNOLOGY MARKET, BY END USE, 2019–2022 (USD MILLION)
                                    TABLE 163 UK: MILLIMETER WAVE TECHNOLOGY MARKET, BY END USE, 2023–2028 (USD MILLION)
                                    TABLE 164 UK: MILLIMETER WAVE TECHNOLOGY MARKET, BY PRODUCT, 2019–2022 (USD MILLION)
                                    TABLE 165 UK: MILLIMETER WAVE TECHNOLOGY MARKET, BY PRODUCT, 2023–2028 (USD MILLION)
             13.3.3 GERMANY
                        13.3.3.1 Increased deployment of millimeter wave technology in various industries
                                    TABLE 166 GERMANY: MILLIMETER WAVE TECHNOLOGY MARKET, BY END USE, 2019–2022 (USD MILLION)
                                    TABLE 167 GERMANY: MILLIMETER WAVE TECHNOLOGY MARKET, BY END USE, 2023–2028 (USD MILLION)
                                    TABLE 168 GERMANY: MILLIMETER WAVE TECHNOLOGY MARKET, BY PRODUCT, 2019–2022 (USD MILLION)
                                    TABLE 169 GERMANY: MILLIMETER WAVE TECHNOLOGY MARKET, BY PRODUCT, 2023–2028 (USD MILLION)
             13.3.4 FRANCE
                        13.3.4.1 Technological shift from 4G to 5G
                                    TABLE 170 FRANCE: MILLIMETER WAVE TECHNOLOGY MARKET, BY END USE, 2019–2022 (USD MILLION)
                                    TABLE 171 FRANCE: MILLIMETER WAVE TECHNOLOGY MARKET, BY END USE, 2023–2028 (USD MILLION)
                                    TABLE 172 FRANCE: MILLIMETER WAVE TECHNOLOGY MARKET, BY PRODUCT, 2019–2022 (USD MILLION)
                                    TABLE 173 FRANCE: MILLIMETER WAVE TECHNOLOGY MARKET, BY PRODUCT, 2023–2028 (USD MILLION)
             13.3.5 REST OF EUROPE
                        TABLE 174 REST OF EUROPE: MILLIMETER WAVE TECHNOLOGY MARKET, BY END USE, 2019–2022 (USD MILLION)
                        TABLE 175 REST OF EUROPE: MILLIMETER WAVE TECHNOLOGY MARKET, BY END USE, 2023–2028 (USD MILLION)
                        TABLE 176 REST OF EUROPE: MILLIMETER WAVE TECHNOLOGY MARKET, BY PRODUCT, 2019–2022 (USD MILLION)
                        TABLE 177 REST OF EUROPE: MILLIMETER WAVE TECHNOLOGY MARKET, BY PRODUCT, 2023–2028 (USD MILLION)
     13.4 ASIA PACIFIC 
             13.4.1 ASIA PACIFIC: RECESSION IMPACT
                        FIGURE 48 ASIA PACIFIC: SNAPSHOT OF MILLIMETER WAVE TECHNOLOGY MARKET
                        TABLE 178 ASIA PACIFIC: MILLIMETER WAVE TECHNOLOGY MARKET, BY COUNTRY, 2019–2022 (USD MILLION)
                        TABLE 179 ASIA PACIFIC: MILLIMETER WAVE TECHNOLOGY MARKET, BY COUNTRY, 2023–2028 (USD MILLION)
                        TABLE 180 ASIA PACIFIC: MILLIMETER WAVE TECHNOLOGY MARKET, BY END USE, 2019–2022 (USD MILLION)
                        TABLE 181 ASIA PACIFIC: MILLIMETER WAVE TECHNOLOGY MARKET, BY END USE, 2023–2028 (USD MILLION)
                        TABLE 182 ASIA PACIFIC: MILLIMETER WAVE TECHNOLOGY MARKET, BY PRODUCT, 2019–2022 (USD MILLION)
                        TABLE 183 ASIA PACIFIC: MILLIMETER WAVE TECHNOLOGY MARKET, BY PRODUCT, 2023–2028 (USD MILLION)
             13.4.2 CHINA
                        13.4.2.1 Large customer base of telecommunication services
                                    TABLE 184 CHINA: MILLIMETER WAVE TECHNOLOGY MARKET, BY END USE, 2019–2022 (USD MILLION)
                                    TABLE 185 CHINA: MILLIMETER WAVE TECHNOLOGY MARKET, BY END USE, 2023–2028 (USD MILLION)
                                    TABLE 186 CHINA: MILLIMETER WAVE TECHNOLOGY MARKET, BY PRODUCT, 2019–2022 (USD MILLION)
                                    TABLE 187 CHINA: MILLIMETER WAVE TECHNOLOGY MARKET, BY PRODUCT, 2023–2028 (USD MILLION)
             13.4.3 JAPAN
                        13.4.3.1 Expanding mobile & telecommunications and automotive industries
                                    TABLE 188 JAPAN: MILLIMETER WAVE TECHNOLOGY MARKET, BY END USE, 2019–2022 (USD MILLION)
                                    TABLE 189 JAPAN: MILLIMETER WAVE TECHNOLOGY MARKET, BY END USE, 2023–2028 (USD MILLION)
                                    TABLE 190 JAPAN: MILLIMETER WAVE TECHNOLOGY MARKET, BY PRODUCT, 2019–2022 (USD MILLION)
                                    TABLE 191 JAPAN: MILLIMETER WAVE TECHNOLOGY MARKET, BY PRODUCT, 2023–2028 (USD MILLION)
             13.4.4 SOUTH KOREA
                        13.4.4.1 Presence of strong telecommunication infrastructure and easy availability of 5G mobile phones
                                    TABLE 192 SOUTH KOREA: MILLIMETER WAVE TECHNOLOGY MARKET, BY END USE, 2019–2022 (USD MILLION)
                                    TABLE 193 SOUTH KOREA: MILLIMETER WAVE TECHNOLOGY MARKET, BY END USE, 2023–2028 (USD MILLION)
                                    TABLE 194 SOUTH KOREA: MILLIMETER WAVE TECHNOLOGY MARKET, BY PRODUCT, 2019–2022 (USD MILLION)
                                    TABLE 195 SOUTH KOREA: MILLIMETER WAVE TECHNOLOGY MARKET, BY PRODUCT, 2023–2028 (USD MILLION)
             13.4.5 INDIA
                        13.4.5.1 Increasing investments in 5G infrastructure and rise in number of 5G mobile phone manufacturers
                                    TABLE 196 INDIA: MILLIMETER WAVE TECHNOLOGY MARKET, BY END USE, 2019–2022 (USD MILLION)
                                    TABLE 197 INDIA: MILLIMETER WAVE TECHNOLOGY MARKET, BY END USE, 2023–2028 (USD MILLION)
                                    TABLE 198 INDIA: MILLIMETER WAVE TECHNOLOGY MARKET, BY PRODUCT, 2019–2022 (USD MILLION)
                                    TABLE 199 INDIA: MILLIMETER WAVE TECHNOLOGY MARKET, BY PRODUCT, 2023–2028 (USD MILLION)
             13.4.6 REST OF ASIA PACIFIC
                        TABLE 200 REST OF ASIA PACIFIC: MILLIMETER WAVE TECHNOLOGY MARKET, BY END USE, 2019–2022 (USD MILLION)
                        TABLE 201 REST OF ASIA PACIFIC: MILLIMETER WAVE TECHNOLOGY MARKET, BY END USE, 2023–2028 (USD MILLION)
                        TABLE 202 REST OF ASIA PACIFIC: MILLIMETER WAVE TECHNOLOGY MARKET, BY PRODUCT, 2019–2022 (USD MILLION)
                        TABLE 203 REST OF ASIA PACIFIC: MILLIMETER WAVE TECHNOLOGY MARKET, BY PRODUCT, 2023–2028 (USD MILLION)
     13.5 ROW 
             13.5.1 ROW: RECESSION IMPACT
                        TABLE 204 ROW: MILLIMETER WAVE TECHNOLOGY MARKET, BY REGION, 2019–2022 (USD MILLION)
                        TABLE 205 ROW: MILLIMETER WAVE TECHNOLOGY MARKET, BY REGION, 2023–2028 (USD MILLION)
                        TABLE 206 ROW: MILLIMETER WAVE TECHNOLOGY MARKET, BY END USE, 2019–2022 (USD MILLION)
                        TABLE 207 ROW: MILLIMETER WAVE TECHNOLOGY MARKET, BY END USE, 2023–2028 (USD MILLION)
                        TABLE 208 ROW: MILLIMETER WAVE TECHNOLOGY MARKET, BY PRODUCT, 2019–2022 (USD MILLION)
                        TABLE 209 ROW: MILLIMETER WAVE TECHNOLOGY MARKET, BY PRODUCT, 2023–2028 (USD MILLION)
             13.5.2 MIDDLE EAST & AFRICA
                        13.5.2.1 Increased adoption of millimeter wave technology in industrial sector and aerospace & defense and telecommunications industries
                                    TABLE 210 MIDDLE EAST & AFRICA: MILLIMETER WAVE TECHNOLOGY MARKET, BY END USE, 2019–2022 (USD MILLION)
                                    TABLE 211 MIDDLE EAST & AFRICA: MILLIMETER WAVE TECHNOLOGY MARKET, BY END USE, 2023–2028 (USD MILLION)
                                    TABLE 212 MIDDLE EAST & AFRICA: MILLIMETER WAVE TECHNOLOGY MARKET, BY PRODUCT, 2019–2022 (USD MILLION)
                                    TABLE 213 MIDDLE EAST & AFRICA: MILLIMETER WAVE TECHNOLOGY MARKET, BY PRODUCT, 2023–2028 (USD MILLION)
             13.5.3 SOUTH AMERICA
                        13.5.3.1 Rising 5G deployments and partnerships of local players with global players
                                    TABLE 214 SOUTH AMERICA: MILLIMETER WAVE TECHNOLOGY MARKET, BY END USE, 2019–2022 (USD MILLION)
                                    TABLE 215 SOUTH AMERICA: MILLIMETER WAVE TECHNOLOGY MARKET, BY END USE, 2023–2028 (USD MILLION)
                                    TABLE 216 SOUTH AMERICA: MILLIMETER WAVE TECHNOLOGY MARKET, BY PRODUCT, 2019–2022 (USD MILLION)
                                    TABLE 217 SOUTH AMERICA: MILLIMETER WAVE TECHNOLOGY MARKET, BY PRODUCT, 2023–2028 (USD MILLION)
 
14 COMPETITIVE LANDSCAPE (Page No. - 226)
     14.1 OVERVIEW 
     14.2 KEY STRATEGIES ADOPTED BY MAJOR MARKET PLAYERS 
             TABLE 218 OVERVIEW OF STRATEGIES ADOPTED BY KEY MILLIMETER WAVE TECHNOLOGY PROVIDERS
     14.3 REVENUE ANALYSIS 
             FIGURE 49 REVENUE ANALYSIS OF KEY COMPANIES IN PAST FIVE YEARS
     14.4 MARKET SHARE ANALYSIS, 2022 
             TABLE 219 MILLIMETER WAVE TECHNOLOGY MARKET: DEGREE OF COMPETITION
     14.5 COMPANY EVALUATION QUADRANT 
             14.5.1 STARS
             14.5.2 PERVASIVE PLAYERS
             14.5.3 EMERGING LEADERS
             14.5.4 PARTICIPANTS
                        FIGURE 50 MILLIMETER WAVE TECHNOLOGY MARKET (GLOBAL): COMPANY EVALUATION QUADRANT, 2022
     14.6 COMPETITIVE BENCHMARKING (25 COMPANIES) 
             TABLE 220 END USE: COMPANY FOOTPRINT
             TABLE 221 PRODUCT: COMPANY FOOTPRINT
             TABLE 222 REGION: COMPANY FOOTPRINT
     14.7 STARTUP/SME EVALUATION QUADRANT 
             14.7.1 PROGRESSIVE COMPANIES
             14.7.2 RESPONSIVE COMPANIES
             14.7.3 DYNAMIC COMPANIES
             14.7.4 STARTING BLOCKS
                        FIGURE 51 MILLIMETER WAVE TECHNOLOGY MARKET: STARTUP/SME EVALUATION QUADRANT, 2022
     14.8 COMPETITIVE SCENARIO AND TRENDS 
             14.8.1 PRODUCT LAUNCHES
                        TABLE 223 MILLIMETER WAVE TECHNOLOGY MARKET: PRODUCT LAUNCHES, JANUARY 2020–MARCH 2023
             14.8.2 DEALS
                        TABLE 224 MILLIMETER WAVE TECHNOLOGY MARKET: DEALS, JANUARY 2020–MARCH 2023
 
15 COMPANY PROFILES (Page No. - 243)
(Business Overview, Products/Solutions/Services Offered, Recent Developments, MnM view (Key strengths/Right to win, Strategic choices made, Weakness/competitive threats)*  
     15.1 INTRODUCTION 
     15.2 KEY PLAYERS 
             15.2.1 AXXCSS WIRELESS SOLUTIONS
                        TABLE 225 AXXCSS WIRELESS SOLUTIONS: COMPANY OVERVIEW
             15.2.2 NEC CORPORATION
                        TABLE 226 NEC CORPORATION: COMPANY OVERVIEW
                        FIGURE 52 NEC CORPORATION: COMPANY SNAPSHOT
             15.2.3 SIKLU COMMUNICATION
                        TABLE 227 SIKLU COMMUNICATION: COMPANY OVERVIEW
             15.2.4 L3HARRIS
                        TABLE 228 L3HARRIS: COMPANY OVERVIEW
                        FIGURE 53 L3HARRIS TECHNOLOGIES: COMPANY SNAPSHOT
             15.2.5 SMITHS GROUP PLC
                        TABLE 229 SMITHS GROUP: COMPANY OVERVIEW
                        FIGURE 54 SMITHS GROUP PLC: COMPANY SNAPSHOT
             15.2.6 ERAVANT (FORMERLY SAGE MILLIMETER)
                        TABLE 230 ERAVANT: COMPANY OVERVIEW
             15.2.7 AVIAT NETWORKS
                        TABLE 231 AVIAT NETWORKS: COMPANY OVERVIEW
                        FIGURE 55 AVIAT NETWORKS: COMPANY SNAPSHOT
             15.2.8 FARRAN TECHNOLOGY
                        TABLE 232 FARRAN TECHNOLOGY: COMPANY OVERVIEW
             15.2.9 MILLIMETER WAVE PRODUCTS INC.
                        TABLE 233 MILLIMETER WAVE PRODUCTS: COMPANY OVERVIEW
             15.2.10 KEYSIGHT TECHNOLOGIES, INC.
                        TABLE 234 KEYSIGHT TECHNOLOGIES: COMPANY OVERVIEW
                        FIGURE 56 KEYSIGHT TECHNOLOGIES: COMPANY SNAPSHOT
     15.3 OTHER PLAYERS 
             15.3.1 VUBIQ NETWORKS, INC.
             15.3.2 ELVA-1
             15.3.3 VERANA NETWORKS
             15.3.4 CABLEFREE
             15.3.5 FASTBACK NETWORKS
             15.3.6 QUINSTAR TECHNOLOGY
             15.3.7 LIGHTPOINTE COMMUNICATIONS, INC. (LIGHTPOINTE WIRELESS)
             15.3.8 TREX ENTERPRISES CORPORATION (TREX)
             15.3.9 NUCTECH
             15.3.10 KYOCERA
             15.3.11 RADWIN
             15.3.12 IGNITENET
             15.3.13 KRATOS DEFENSE & SECURITY SOLUTIONS
             15.3.14 ANOKIWAVE
             15.3.15 SPACEK LABS
             15.3.16 CAMBIUM NETWORKS
*Details on Business Overview, Products/Solutions/Services Offered, Recent Developments, MnM view (Key strengths/Right to win, Strategic choices made, Weakness/competitive threats)* might not be captured in case of unlisted companies.  
 
16 APPENDIX (Page No. - 295)
     16.1 DISCUSSION GUIDE 
     16.2 KNOWLEDGESTORE: MARKETSANDMARKETS’ SUBSCRIPTION PORTAL 
     16.3 CUSTOMIZATION OPTIONS 
     16.4 RELATED REPORTS 
     16.5 AUTHOR DETAILS 
 

The study involved four major activities in estimating the current size for millimeter wave technology market. Exhaustive secondary research was done to collect information on the market, related market, peer market, and parent market. The next step was to validate these findings, assumptions, and sizing with industry experts across value chains through primary research. Both top-down and bottom-up approach was employed to estimate the overall market size. Subsequently, market breakdown and data triangulation were used to estimate the market size of segments and subsegments.

Secondary Research

Secondary research process referred for this study include various secondary sources were referred to for identifying and collecting information related to this study. This research study involved extensive use of secondary sources, directories, and databases—such as annual reports or presentations of companies, industry association publications, technical handbooks, the World Economic Outlook, trade websites, Bloomberg, Hoovers, BusinessWeek, Factiva, and OneSource—to identify and collect information useful for this technical, market-oriented, and commercial study of the millimeter wave technology market. Primary sources mainly included several industry experts from the core and related industries, suppliers, manufacturers, distributors, product and service providers, technology developers, alliances, standards, and certification organizations related to various parts of the value chain of the millimeter wave technology market. Key players in the millimeter wave technology market have been identified through secondary research, and their market ranking has been determined through primary and secondary research.

In-depth interviews have been conducted with various primary respondents, including key industry participants, subject matter experts (SMEs), C-level executives of key market players, and industry consultants, to obtain and verify critical qualitative and quantitative information on the millimeter wave technology market and assess its growth prospects. The following illustration shows the research methodology applied in making this report on the millimeter wave technology market.

Primary Research

Extensive primary research has been conducted after understanding and analyzing the current scenario of the millimeter wave technology market through secondary research. Several primary interviews have been conducted with key opinion leaders from the demand and supply sides across four main regions: North America, Europe, Asia Pacific, and RoW. Approximately 25% of the primary interviews have been conducted with demand-side respondents, while 75% have been conducted with supply-side respondents. The primary data has been collected mainly through telephonic interviews, which comprised 80% of the total primary interviews. Questionnaires and e-mails have also been used to collect data.

Millimeter Wave Technology Market Size, and Share

To know about the assumptions considered for the study, download the pdf brochure

Market Size Estimation

In the complete market engineering process, top-down and bottom-up approaches and several data triangulation methods have been used to estimate and forecast the size of the overall market and its segments and subsegments listed in this report. The key players in the millimeter wave technology market have been identified through secondary research, and their market share in the respective regions has been determined through primary and secondary research. The entire procedure includes studying annual and financial reports of the top market players and extensive interviews with industry experts, such as chief executive officers (CEO), vice presidents, directors, and marketing executives, for key insights.

All percentage shares, splits, and breakdowns have been determined using secondary sources and verified through primary sources. All the parameters affecting the markets covered in this research study have been accounted for, viewed in detail, verified through primary research, and analyzed to obtain the final quantitative and qualitative data. This data has been consolidated and supplemented with detailed inputs and analysis from MarketsandMarkets, and presented in this report. The following figure represents this study's overall market size estimation process.

Millimeter Wave Technology Market: Bottom-Up Approach

Millimeter Wave Technology Market Size, and Bottom-Up Approach

Data Triangulation

After arriving at the overall market size from the estimation process explained above, the total market was split into several segments and subsegments. To complete the overall market engineering process and arrive at the exact statistics for all the segments and subsegments, data triangulation and market breakdown procedures were employed, wherever applicable. The data was triangulated by studying various factors and trends from demand and supply sides. The market size was also validated using top-down and bottom-up approaches.

Market Definition

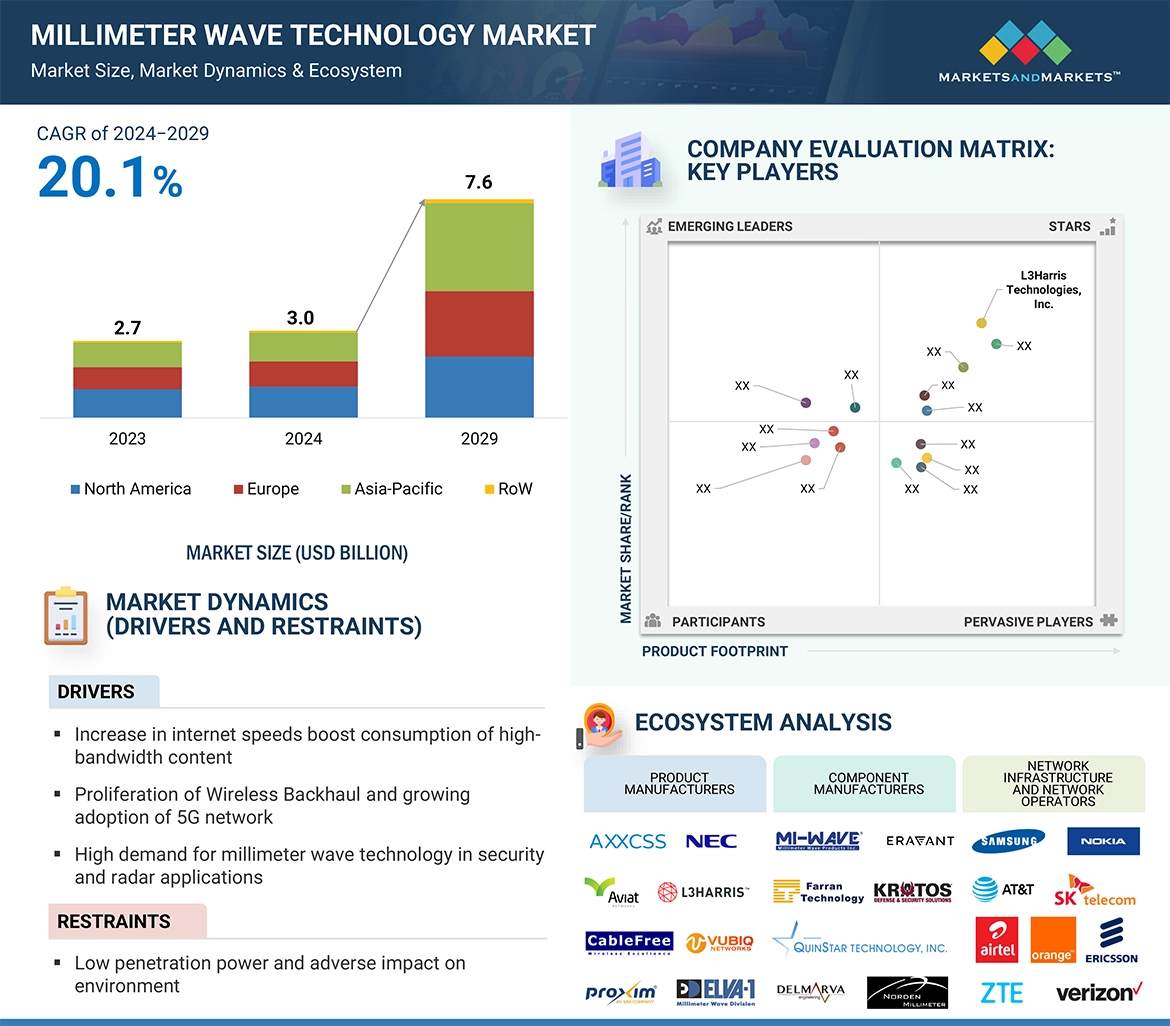
Millimeter wave, also known as extremely high frequency (EHF) or very high frequency (VHF), is the band of spectrum between 30 gigahertz (GHz) and 300 GHz. These waves are named so because their wavelengths range from 1 millimeter to 10 millimeters. Previously, millimeter waves were mainly used in military and satellite communication applications. However, this technology has been gaining traction in mobile and telecom applications, mainly for 5G. In the context of wireless communication, millimeter waves generally refer to bands of the spectrum of around 38 GHz, 60 GHz, and 94 GHz.

Key Stakeholders

  •  The intended audience for this report is as follows:
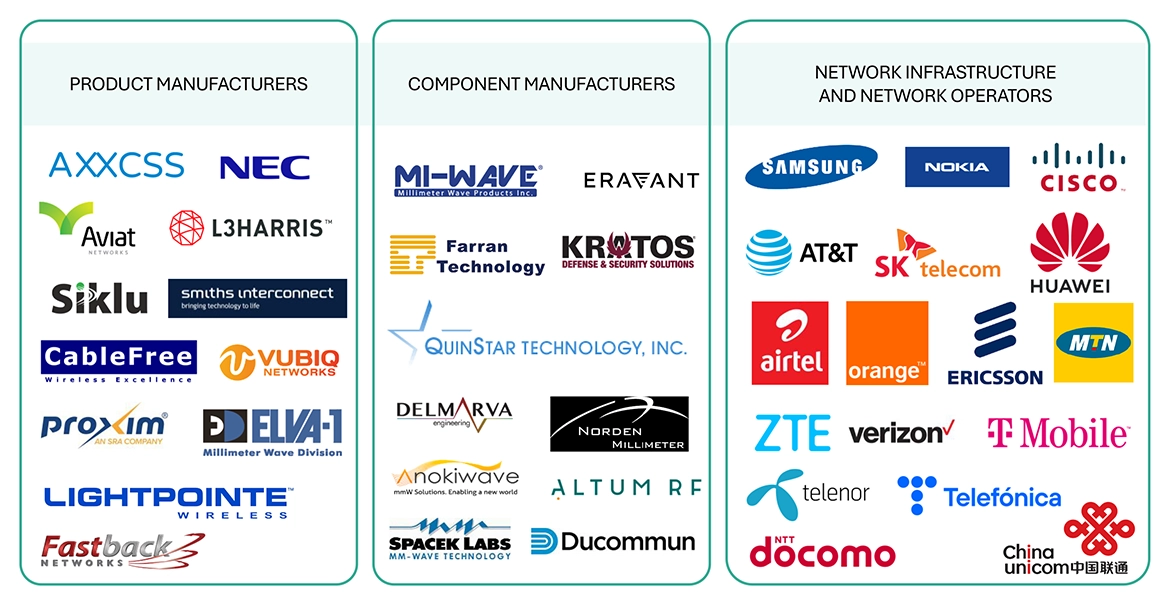
  • Companies in the millimeter wave technology market
  • Providers of millimeter wave components
  • Technical standards organizations
  • Research institutes and organizations
  • Government and financial institutions
  • Venture capitalists
  • Private equity firms

Study Objectives

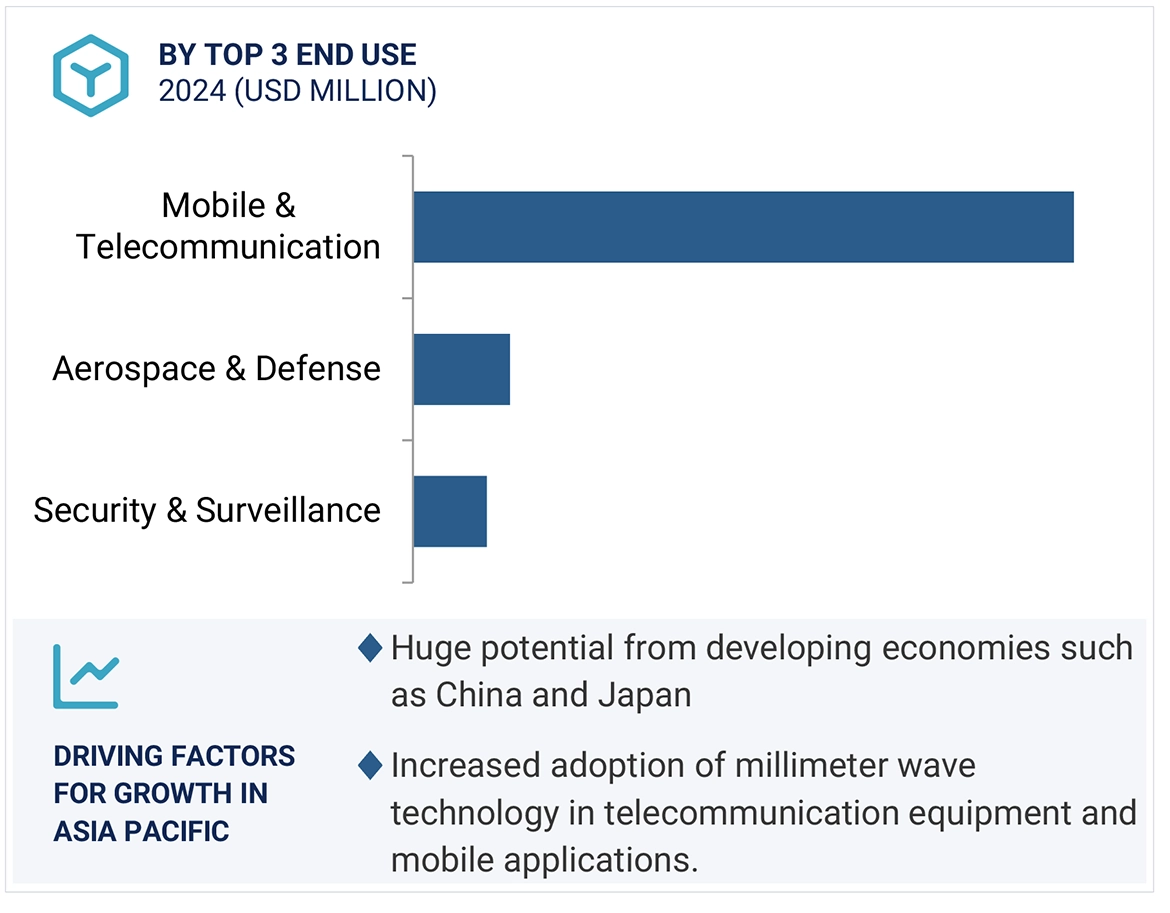
  • To define, describe, and forecast the millimeter wave technology market, in terms of value and volume, based on product, frequency band, license type, end use, component, and region
  • To forecast the market size in four main regions—North America, Europe, Asia Pacific, and the Rest of the World (RoW)
  • To provide detailed information regarding the major factors influencing the growth of the market (drivers, restraints, opportunities, and challenges)
  • To provide value chain analysis, ecosystem, Porter’s five forces analysis, trade data analysis, pricing analysis, patents analysis, tariffs, and regulatory landscape of the market
  • To provide a detailed analysis of the impact of the recession on the millimeter wave technology market
  • To strategically analyze micromarkets1 with respect to individual growth trends, prospects, and contributions to the total market
  • To strategically profile the key players in the millimeter wave technology market and comprehensively analyze their market share and core competencies2
  • To analyze the competitive developments such as product launches, collaborations, partnerships, and acquisitions in the market
  • To provide detailed information on the competitive landscape of the market

Available Customizations

MarketsandMarkets offers customizations according to the company’s specific needs and with the given market data. The following customization options are available for the report:

  • Additional country-level analysis of the millimeter wave technology market
  • Profiling additional market players (upto 5)

Product Analysis

  • Product matrix that gives a detailed comparison of the product portfolio of each company in millimeter wave technology market

Company Information

  • Detailed analysis and profiling of additional market players (up to 5)
Custom Market Research Services

We will customize the research for you, in case the report listed above does not meet with your exact requirements. Our custom research will comprehensively cover the business information you require to help you arrive at strategic and profitable business decisions.

Request Customization

Instant Answers with GPT - Ask Now!

Ask real questions. Get complete answers !
Report Code
SE 3472
Published ON
Apr, 2023
Choose License Type
BUY NOW
  • SHARE
X
Request Customization
Speak to Analyst
Speak to Analyst
OR FACE-TO-FACE MEETING
PERSONALIZE THIS RESEARCH
  • Triangulate with your Own Data
  • Get Data as per your Format and Definition
  • Gain a Deeper Dive on a Specific Application, Geography, Customer or Competitor
  • Any level of Personalization
REQUEST A FREE CUSTOMIZATION
LET US HELP YOU!
  • What are the Known and Unknown Adjacencies Impacting the Millimeter Wave Technology Market
  • What will your New Revenue Sources be?
  • Who will be your Top Customer; what will make them switch?
  • Defend your Market Share or Win Competitors
  • Get a Scorecard for Target Partners
CUSTOMIZED WORKSHOP REQUEST
+1-888-600-6441
  • Call Us
  • +1-888-600-6441 (Corporate office hours)
  • +1-888-600-6441 (US/Can toll free)
  • +44-800-368-9399 (UK office hours)
CONNECT WITH US
ABOUT TRUST ONLINE
©2024 MarketsandMarkets Research Private Ltd. All rights reserved
DMCA.com Protection Status Website Feedback