Connected Living Room Market by Products (Smart/3D, LED/LCD/OLED TV, set top box, Home theater (Projector, Audio Equipment), Blu-ray player, Gaming console), by Technology (Processor, Memory, Sensor, Connectivity) & by Geography - Global Trend & Forecast to 2013 - 2020


The race is on to bridge the gap among different consumer electronics devices used in living rooms. The living room devices in the early 80s were majorly televisions. With the inventions and evolution of the consumer electronics industry, new products like the digital set-top box, digital video recorder, home theater systems, digital media players like Blu-ray players, and gaming consoles have made their entry into the living room. The transformation of the living room into a digital entertainment hub of a home has been influenced by a variety of factors. One of these major factors has been the beginning of the shift towards digitization, making the use and storage of media content very convenient and highly user friendly. Thus, the analysis says that the total connected living room market is expected to cross $957.65 billion by 2020 with a single digit growth rate. Currently, the market value is approximately $612.36 billion.
The major living room devices that have been covered in this research study are smartphones, tablets, laptops, TVs, set-top boxes, DVRs, home theater systems, gaming consoles, and blu-ray players. These devices have evolved to become an integral part of a typical connected living room. The development of newer and more advanced wired and wireless connectivity technologies have also contributed to growth of these devices. These technologies offered by the connected living room market have made the storage, sharing and transfer of high quality media content simpler.
The major companies involved in this market are Samsung Electronics (South Korea), Sony Corporation (Japan), Samsung (South Korea), Motorola (U.S.), LG Electronics (South Korea), BenQ Corporation (Taiwan), Nintendo (Japan), Comcast Corporation (U.S.), and Pioneer Corp. (Japan).
KEY TAKE-AWAYS
- The global connected living room market is estimated to grow at a modest CAGR from 2014 till 2020 and to cross $957.65 billion by the end of these five years.
- Currently, smartphones contribute to 39% and televisions contribute to more than 25% of the global market. This share is expected to increase to more than 44% and 24% respectively by the end of 2020.
- Factors such as evolving technology and changing consumer behavior are affecting each type of devices. For instance, a declining trend is observed in the set-top box and Blu-ray player markets.
- OLED TVs are expected to dominate the television market for the next five years and CCFL backlit LCD TVs and Plasma TVs shall witness a rapid decline in their shipments.
- Porter's analysis in detail, market life cycle analysis along with technology and market roadmaps, evolution and time-lines of each type of living room devices, and their respective markets.
- Detailed segmentation of the market by technology and products with a focus on markets of high growth and emerging technologies.
- The future of each type of related devices and technologies and industry from both - technical and market-oriented perspectives with techno-market oriented roadmaps.
- Detailed pricing and cost analysis of each type of connected living room device, along with future scenarios in prices and dynamics of changes in prices.
- Detailed competitive landscape with identification of the key players in each type of product market, in-depth market share analysis with individual revenue, market shares, and market share rankings.
- Complete value chain, allied industry segments, and value chain analysis of the industry and their impacts on the connected living room market.
The connected living room has a very broad market classification. The living room devices in the early 80s were majorly televisions. With the inventions and evolution of the consumer electronics industry, new products such as the digital set-top box, digital video recorder, home theater systems, digital media players like Blu-ray players, and gaming consoles have made their entry into the living room. The transformation of the living room into a digital entertainment hub of a home has been influenced by a variety of factors. One of these major factors has been the beginning of the shift towards digitization, making the use and storage of media content very convenient and highly user friendly.
The major living room devices that have been covered in this research study are smartphones, tablets, laptops, TVs, set-top boxes, DVRs, home theater systems, gaming consoles, and blu-ray players. These devices have evolved to become an integral part of a typical in-room entertainment system. The development of newer and more advanced wired and wireless connectivity technologies have also contributed to growth of these devices. These technologies have made the storage, sharing and transfer of high quality media content simpler.
Along with the product-wise segmentation, the total market is also analyzed according to geographies and components. North America is considered as the largest value based consumer market and it is no different for the consumer electronics segment. Other regions covered in the report are Europe, APAC, and ROW.
Connected Living Room Devices Market, By Product Types, 2013 � 2020 ($Billion)
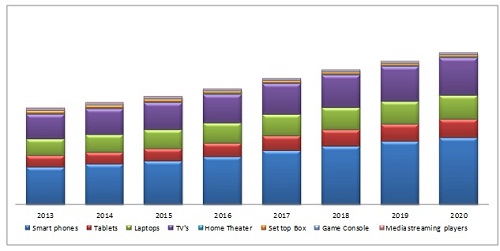
Source: MarketsandMarkets Analysis
The figure above gives an overview of the total connected living room devices revenue market. It can be observed from the figure that more than 39% of the total revenue is contributed by the smartphones. High volume and low average cost is the major reason for this. Rest of the market value is contributed by TV, set-top boxes, blu-ray players, gaming consoles, and home theater systems.
The total connected living room market is expected to cross $957.65 billion by 2020 at a CAGR of 6.8%, calculated from 2014 to 2020.
Few of the major companies profiled in the report are Samsung Electronics (South Korea), Sony Corporation (Japan), LG Electronics (South Korea), BenQ Corporation (Taiwan), Nintendo (Japan), and Samsung (South Korea).
 Exclusive indicates content/data unique to MarketsandMarkets and not available with any competitors.
Table Of Contents
1 Introduction (Page No.-23)
1.1 Key Take-Aways
1.2 Report Description
1.3 Markets Covered
1.4 Companies Covered in the Report
1.5 Stakeholders
1.6 Report Assumptions
1.7 Research Methodology
1.7.1 Market Size Estimation
1.7.2 Market Crackdown & Data Triangulation
1.7.3 Market Forecasting Model
1.7.4 Key Data Points Taken From Secondary Sources
1.7.5 Key Data Points Taken From Primary Sources
2 Executive Summary (Page No.-40)
3 Market Overview (Page No.-42)
3.1 Introduction
3.2 History & Evolution
3.2.1 Digitization of Living Rooms
3.2.2 Evolution of Multimedia Devices
3.3 Value Chain Analysis
3.3.1 Television Systems Value Chain
3.3.1.1 Component Manufacturers
3.3.1.2 Equipment Suppliers
3.3.1.3 Oem Vendors
3.3.1.4 Software Services Vendors
3.3.2 Set-Top Box Value Chain
3.3.2.1 Component Manufacturers
3.3.2.2 Oem Vendors
3.3.2.3 Over-the-Top Content Providers & TV Broadcast Vendors
3.4 Key Market Statistics
3.5 Market Dynamics
3.5.1 Market Drivers
3.5.1.1 Huge Government Body Support For Digitization
3.5.1.2 Emergence of Technologies For Connectivity Amongst Home Devices
3.5.1.3 Integration of User-Interactive Features Into Home Infotainment
3.5.1.4 Advancements Towards Higher-Resolutions Driving the Display Market
3.5.2 Market Restraints
3.5.2.1 Red Ocean Strategy
3.5.2.2 Compatibility - Critical Factor in the Buying Decision Process
3.5.2.3 Intellectual Property Rights � Restricting Sales
3.5.3 Market Opportunities
3.5.3.1 Technology Penetration Into Emerging Markets
3.5.3.2 Smart Homes, Intelligent & Connected Homes- Connected Living Room, A Start
3.5.4 Burning Issues
3.5.4.1 High Technological Fragmentation - Standardization of Formats
3.5.5 Winning Imperatives
3.5.5.1 Convergence of Product Functionalities
3.5.6 Porter�s Analysis
3.5.6.1 Threat of New Entrants
3.5.6.2 Threat of Competitors
3.5.6.3 Bargaining Power of Suppliers
3.5.6.4 Bargaining Power of Buyers
3.5.6.5 Degree of Competition
4 Connected Living Room Market, By Product (Page No.-75)
4.1 Introduction
4.2 Smartphones
4.3 Tablets
4.4 Laptops
4.5 TV Systems
4.5.1 TV Systems Market By Display Technology
4.5.1.1 Crt TV
4.5.1.2 LED TV
4.5.1.3 Lcd TV
4.5.1.4 Plasma TV
4.5.1.5 Oled TV
4.5.2 TV Systems Market By Geography
4.5.3 TV Systems Market By Features
4.5.3.1 Smart TV
4.5.3.1.1 Smart TV Market By Geography
4.5.3.2 3d TV
4.5.3.2.1 3d TV Market By Geography
4.6 Set-Top Boxes
4.6.1 Set-Top Box Market By Types
4.6.1.1 Cable Stbs
4.6.1.2 Satellite Stbs
4.6.1.3 Iptv Stbs
4.6.1.4 Dtt Stbs
4.6.2 Set-Top Box Market By Resolution
4.6.2.1 Standard Definition
4.6.2.2 High Definition
4.6.3 Set-Top Box Market By Geography
4.7 Media Streaming Players
4.7.1 DVD Players
4.7.1.1 DVD Player Market By Geography
4.7.2 Blu-Ray Players
4.7.2.1 Blu-Ray Player Market By Geography
4.8 Home Theater Systems
4.8.1 Home Theater System Market Overview
4.8.2 Home Theater Projectors
4.8.2.1 HT Projectors Market By Resolution
4.8.2.1.1 720p HT Projector
4.8.2.1.2 1080p HT Projector
4.8.2.1.3 4k HT Projector
4.8.2.2 HT Projector Market By Geography
4.8.3 Home Theater Audio Systems
4.8.3.1 Audio Systems Market By Output Channels
4.8.3.1.1 Channels System
4.8.3.1.2 Channels System
4.8.3.1.3 Channels System
4.8.3.2 Audio Systems Market By Geography
4.9 Gaming Consoles
4.9.1 Gaming Consoles Market By Geography
4.9.2 Gaming Consoles Market By Generation
4.9.2.1 7th Generation Gaming Consoles
4.9.2.2 8th Generation Gaming Consoles
5 Connected Living Room Market By Technology (Page No.-151)
5.1 Introduction
5.2 CLR Technology Market Overview
5.3 Chipsets For Wireless Connectivity
5.4 Processors
5.4.1 Generic Digital Signal Processor (DSP)
5.4.2 Microcontroller Unit (MCU)
5.5 Memory Ic
5.5.1 Dram
5.5.2 Flash Nand
5.6 Sensors
5.6.1 Image Sensors
5.6.2 Accelerometers
5.6.3 Magnetic Sensors
5.7 LED Driver Ic
6 Connected Living Room Market By Geography (Page No.-170)
6.1 Introduction
6.2 North America
6.2.1 Smartphone
6.2.2 Tablets
6.2.3 Laptops
6.2.4 Television Systems
6.2.5 Set-Top Box Market
6.2.6 DVD Player Market
6.2.7 Blu-Ray Player Market
6.2.8 HT Projector Market
6.2.9 Audio Systems Market
6.2.10 Gaming Consoles� Market
6.3 Europe
6.3.1 Smartphones
6.3.2 Tablets
6.3.3 Laptops
6.3.4 Television Systems
6.3.5 Set-Top Box Market
6.3.6 DVD Player Market
6.3.7 Blu-Ray Player Market
6.3.8 HT Projector Market
6.3.9 Audio Systems Market
6.3.10 Gaming Consoles Market
6.4 APAC
6.4.1 Smartphones
6.4.2 Tablets
6.4.3 Laptops
6.4.4 Television Systems
6.4.5 Set-Top Box Market
6.4.6 DVD Player Market
6.4.7 Blu-Ray Player Market
6.4.8 HT Projector Market
6.4.9 Audio Systems Market
6.4.10 Gaming Consoles Market
6.5 ROW
6.5.1 Smartphones
6.5.2 Tablets
6.5.3 Laptops
6.5.4 Television Systems
6.5.5 Set-Top Box Market
6.5.6 DVD Player Market
6.5.7 Blu-Ray Player Market
6.5.8 HT Projector Market
6.5.9 Audio Systems� Market
6.5.10 Gaming Consoles Market
7 Competitive Landscape (Page No.-238)
7.1 Overview
7.2 Market Share Analysis
7.2.1 Smartphone: Market Share Analysis
7.2.2 Television Systems: Market Share Analysis
7.2.3 Set-Top Box: Market Share Analysis
7.2.4 Gaming Consoles: Market Share Analysis
7.3 Competitive Situation and Trends
7.3.1 New Product Developments & Announcements
7.3.2 Agreements, Partnerships, Investments, Joint Ventures & Collaborations
7.3.3 Mergers & Acquisitions
7.3.4 Awards & Recognitions
8 Company Profiles (Overview, Products and Services, Financials, Strategy & Development)* (Page No.-254)
8.1 Benq Corporation
8.2 Echostar Corporation
8.3 Koninklijke Philips N.V.
8.4 LG Electronics
8.5 Motorola Mobility Holdings. Inc.
8.6 Nintendo Co., Ltd
8.7 Pace PLC
8.8 Panasonic Corporation
8.9 Samsung Electronics
8.10 Sony Corporation
8.11 Technicolor SA
8.12 TIVO, Inc.
*Details on Overview, Products and Services, Financials, Strategy & Development Might Not Be Capturedin Case of Unlisted Companies.
Appendix (Page No.-331)
Key Secondary Sources
List of Tables (152 Tables)
Table 1 Connected Living Room Market, Major Companies
Table 2 General Assumptions, Terminology & Application Key Notes
Table 3 Connected Living Room Devices Market Size, By Product, 2013�2020 ($Billion)
Table 4 Time-Line: Shift to Digitalization, By Countries
Table 5 Porter�s Analysis: Range
Table 6 Index Table For Impact Analysis
Table 7 Global Connected Living Room Market Size, By Product, 2013�2020 ($Billion)
Table 8 Global Market Overview From Smartphone, 2013-2020
Table 9 Global Market Size From Smartphones, By Geography, 2013-2020, ($Billion)
Table 10 Global Market Size From Smartphones, By Geography, 2013-2020 (Million Units)
Table 11 Global Market Overview From Tablets, 2013-2020
Table 12 Global Market Size From Tablets, By Geography, 2013-2020 ($Billion)
Table 13 Global Market Size From Tablets, By Geography, 2013-2020 (Million Units)
Table 14 Global Market Overview From Laptops, 2013-2020
Table 15 Global Market Size From Laptops, By Geography, 2013-2020 ($Billion)
Table 16 Global Market Size From Laptops, By Geography, 2013-2020 (Million Units)
Table 17 Global Market Overview From TV Systems, 2013�2020
Table 18 Global Market Size From TV Systems, By Type, 2013�2020 ($Billion)
Table 19 Global Market Size From TV Systems, By Type, 2013�2020 (Million Units)
Table 20 Connected Living Room Market Size From LED TV Systems, By Geography, 2013�2020 ($Billion)
Table 21 Market Size From LED TV Systems, By Geography, 2013�2020 (Million Units)
Table 22 Market Size From Lcd TV Systems, By Geography, 2013�2020 ($Million)
Table 23 Market Size From Lcd TV Systems, By Geography, 2013�2020 (Million Units)
Table 24 Market Size From Plasma TV Systems, By Geography, 2013�2020 ($Billion)
Table 25 Market Size From Plasma TV Systems, By Geography, 2013�2020 (Million Units)
Table 26 Market Size From Oled TV Systems, By Geography, 2013�2020 ($Billion)
Table 27 Market Size From Oled TV Systems, By Geography, 2013�2020 (Million Units)
Table 28 Global Connected Living Room Market Size From TV Systems, By Geography, 2013�2020 ($Billion)
Table 29 Global Connected Living Room Market Size From TV Systems, By Geography, 2013�2020 (Million Units)
Table 30 Global Connected Living Room Market Overview From Smart TV, 2013�2020
Table 31 Market Size From Smart TV, By Geography, 2013�2020 (Million Units)
Table 32 Global Connected Living Room Market Overview From 3d TV, 2013�2020
Table 33 Market Size From 3d TV, By Geography, 2013�2020 (Million Units)
Table 34 Global Connected Living Room Market Overivew From Set-Top Box, 2013�2020
Table 35 Market Size From Set-Top Box, By Types, 2013�2020 (Million Units)
Table 36 Connected Living Room Market Size From Set-Top Box, By Resolution, 2013�2020 (Million Units)
Table 37 Market Size From Set-Top Box, By Geography, 2013�2020 (Million Units)
Table 38 Global Connected Living Room Market Overview From Media Streaming Players, 2013-2020
Table 39 Global Market Overview From DVD Player, 2013�2020
Table 40 Market Size From DVD Player, By Geography, 2013�2020 (Million Units)
Table 41 Global Connected Living Room Market Overview From Blu-Ray Player, 2013�2020
Table 42 Connected Living Room Market Size From Blu-Ray Player, By Geography, 2013�2020 (Million Units)
Table 43 Global Connected Living Room Market Overview From Home Theater Systems, 2013�2020
Table 44 Global Connected Living Room Market Overview From HT Projectors, 2013�2020
Table 45 HT Projector Resolution, Technical Information
Table 46 Connected Living Room Market Size From HT Projector, By Resolution, 2013�2020 ($Billion)
Table 47 Market Size From HT Projector, By Resolution, 2013�2020 (1,000 Units)
Table 48 Market Size From HT Projector, By Geography, 2013�2020 ($Billion)
Table 49 Market Size From HT Projector, By Geography, 2013�2020 (1,000 Units)
Table 50 Global Connected Living Room Market Overview From Audio Systems, 2013�2020
Table 51 Connected Living Room Market Size From Audio System, By Output Channels, 2013�2020 ($Billion)
Table 52 Connected Living Room Market Size From Audio Systems, By Output Channels, 2013�2020 (Million Units)
Table 53 Connected Living Room Market Size From Audio Systems, By Geography, 2013�2020 ($Billion)
Table 54 Connected Living Room Market Size From Audio Systems, By Geography, 2013�2020 (Million Units)
Table 55 Global Connected Living Room Market Overview From Gaming Consoles, 2013�2020
Table 56 Connected Living Room Market Size From Gaming Consoles, By Geography, 2013�2020 ($Billion)
Table 57 Connected Living Room Market Size From Gaming Consoles, By Generation, 2013�2020 ($Billion)
Table 58 Connected Living Room Market Size From Gaming Consoles, By Generation, 2013�2020 (Million Units)
Table 59 Connected Living Room Market Size From 7th Generation Gaming Consoles, By Devices, 2013�2020 ($Million)
Table 60 Market Size From 7th Generation Gaming Consoles, By Device, 2013�2020 (Million Units)
Table 61 Market Size From 7th Generation Gaming Consoles, By Geography, 2013�2020 ($Million)
Table 62 Market Size From 8th Generation Gaming Consoles, By Devices, 2013�2020 ($Billion)
Table 63 Market Size From 8th Generation Gaming Consoles, By Device, 2013�2020 (Million Units)
Table 64 Market Size From 8th Generation Gaming Consoles, By Geography, 2013�2020 ($Billion)
Table 65 Market Size From 8th Generation Gaming Consoles, By Geography, 2013-2020 (Million Units)
Table 66 Semiconductor Component Market Size From CLR Devices, 2013�2020 ($Billion)
Table 67 Semiconductor Component Market Size For CLR Devices, 2013�2020 (Billion Units)
Table 68 Wireless Chipsets Market Overview For CLR Devices, 2013�2020
Table 69 Wireless Chipsets For CLR Devices Market Size, By Type, 2013-2020 ($Billion)
Table 70 Wireless Chipsets For CLR Devices Market Size, By Type, 2013-2020 (Billion Units)
Table 71 CLR Processors Market Size, By Type, 2013-2020 ($Billion)
Table 72 CLR Processors Market Size, By Types, 2013-2020 (Billion Units)
Table 73 DSP Market Size From CLR Devices, 2013�2020
Table 74 MCU Market Size For CLR Devices, 2013�2020
Table 75 Memory Ic Market Size From CLR Devices, 2013�2020 ($Billion)
Table 76 Memory Ic Market Size From CLR Devices, 2013�2020 (Billion Units)
Table 77 Dram Market For CLR Devices, 2013�2020
Table 78 Flash Nand Market For CLR Devices, 2013�2020
Table 79 Sensors Market Size For CLR Devices, 2013�2020 ($Billion)
Table 80 Sensors Market Size For CLR Devices, 2013�2020 (Billion Units)
Table 81 Image Sensor Market For CLR Devices, 2013�2020
Table 82 Accelerometer Market For CLR Devices, 2013�2020
Table 83 Magnetic Sensor Market For CLR Devices, 2013�2020
Table 84 LED Driver Ic Market For CLR Devices, 2013�2020
Table 85 Global CLR Market Size, By Geography, 2013-2020 (Billion Units)
Table 86 North America: CLR Device Market Size, 2013�2020 ($Billion)
Table 87 North America: Smartphone Market Size, 2013-2020
Table 88 North America: Tablet Market Overview, 2013-2020
Table 89 North America: Laptop Market Overview, 2013-2020
Table 90 North America: Television Systems Market Size, By Type, 2013�2020 ($Billion)
Table 91 North America: Television Systems Market Size, By Type, 2013�2020 (Million Units)
Table 92 North America: Television Systems Market Size, By Feature, 2013�2020 (Million Units)
Table 93 North America: Set-Top Box Market Overview, 2013�2020
Table 94 North America: DVD Player Market Overview, 2013�2020
Table 95 North America: Blu-Ray Player Market Overview, 2013�2020
Table 96 North America: HT Projector Market Overview, 2013�2020
Table 97 North America: Audio Systems Market Overview, 2013�2020
Table 98 North America: Gaming Consoles� Market Overview, 2013�2020
Table 99 North America: 7th Generation Gaming Consoles� Market Overview, 2013�2020
Table 100 North America: 8th Generation Gaming Consoles� Market Overview, 2013�2020
Table 101 Europe: CLR Device Market Size, 2013-2020 ($Billion)
Table 102 Europe: CLR Device Market Size, 2013�2020 (Million Units)
Table 103 Europe: Smartphone Market Overview, 2013-2020
Table 104 Europe: Tablets Market Overview, 2013-2020
Table 105 Europe: Laptops Market Overview, 2013-2020
Table 106 Europe: Television Systems Market Size, By Type, 2013�2020 ($Billion)
Table 107 Europe: Television Systems Market Size, By Type, 2013�2020 (Million Units)
Table 108 Europe: Television Systems Market Size, By Features, 2013�2020 (Million Units)
Table 109 Europe: Set-Top Box Market Overview, 2013�2020
Table 110 Europe: DVD Player Market Overview, 2013�2020
Table 111 Europe: Blu-Ray Player Market Overview, 2013�2020
Table 112 Europe: HT Projector Market Overview, 2013�2020
Table 113 Europe: Audio Systems� Market Overview, 2013�2020
Table 114 Europe: Gaming Consoles� Market Overview, 2013�2020
Table 115 Europe: 7th Generation Gaming Consoles� Market Overview, 2013�2020
Table 116 Europe: 8th Generation Gaming Consoles� Market Overview, 2013�2020
Table 117 APAC: CLR Device Market Size, 2013�2020 ($Billion)
Table 118 APAC: Smartphones Market Overview, 2013-2020
Table 119 APAC: Tablets Market Overview, 2013-2020
Table 120 APAC: Laptops Market Overview, 2013-2020
Table 121 APAC: Television Systems Market Size, By Type, 2013-2020 ($Billion)
Table 122 APAC: Television Systems Market Size, By Type, 2013�2020 (Million Units)
Table 123 APAC: Television Systems Market Size, By Feature, 2013�2020 (Million Units)
Table 124 APAC: Set-Top Box Market Overview, 2013�2020
Table 125 APAC: DVD Player Market Overview, 2013�2020
Table 126 APAC: Blu-Ray Player Market Overview, 2013�2020
Table 127 APAC: HT Projector Market Overview, 2013�2020
Table 128 APAC: Audio Systems Market Overview, 2013�2020
Table 129 APAC: Gaming Consoles Market Overview, 2013�2020
Table 130 APAC: 7th Generation Gaming Consoles Market Overview, 2013�2020
Table 131 APAC: 8th Generation Gaming Consoles Market Overview, 2013�2020
Table 132 ROW: CLR Device Market Size, 2013�2020 ($Billion)
Table 133 ROW: Smartphone Market Overview, 2013-2020
Table 134 ROW: Tablets Market Overview, 2013-2020
Table 135 ROW: Laptops Market Overview, 2013-2020
Table 136 ROW: Television Systems Market Size, By Type, 2013�2020 ($Billion)
Table 137 ROW: Television Systems Market Size, By Types, 2013�2020 (Million Units)
Table 138 ROW: Television Systems Market Size, By Features, 2013�2020 (Million Units)
Table 139 ROW: Set-Top Box Market Overview, 2013�2020
Table 140 ROW: DVD Player Market Overview, 2013�2020
Table 141 ROW: Blu-Ray Player Market Overview, 2013�2020
Table 142 ROW: HT Projector Market Overview, 2013�2020
Table 143 ROW: Audio Systems Market Overview, 2013�2020
Table 144 ROW: Gaming Consoles Market Overview, 2013�2020
Table 145 ROW: 7th Generation Gaming Consoles Market Overview, 2013�2020
Table 146 ROW: 8th Generation Gaming Consoles Market Overview, 2013�2020
Table 147 CLR Market: New Product Developments & Product Launches, 2011 � 2014
Table 148 Agreements, Partnerships, Investments, Joint Ventures, & Collaborations, 2011 � 2014
Table 149 CLR Market: Mergers & Acquisitions, 2011
Table 150 CLR Market: Awards & Recognitions, 2013-2014
Table 151 Benq Corporation: Company Snapshot
Table 152 Motorola Mobility: Company Snapshot
List of Figures (78 Figures)
Figure 1 Connected Living Room Market Scope
Figure 2 Market Analysis, Classification and Landscape
Figure 3 Market Research Methodology
Figure 4 Market Size Estimation
Figure 5 Market Crackdown & Data Triangulation
Figure 6 Market Forecasting Model
Figure 7 Television Systems Technology Roadmap
Figure 8 Blu-Ray Players Technology Roadmap
Figure 9 Gaming Consoles Timeline
Figure 10 Home Theater Systems Technology Roadmap
Figure 11 Complete Value Chain For Television Systems
Figure 12 Complete Value Chain For Set-Top Boxes
Figure 13 Connected Living Room Devices Market Size, By Geography, 2013�2020 ($Billion)
Figure 14 Impact Analysis of Drivers
Figure 15 Impact Analysis of Restraints
Figure 16 Comparison: Life-Cycle of Stand Alone Dvr and Integrated Dvr
Figure 17 Impact Analysis of Opportunities
Figure 18 CLR Market: Porter�s Five Forces Analysis
Figure 19 CLR Market: Threat of New Entrants
Figure 20 CLR Market: Threat of Competitors
Figure 21 CLR Market: Bargaining Power of Suppliers
Figure 22 CLR Market: Bargaining Power of Buyers
Figure 23 CLR Market: Degree of Competition
Figure 24 CLR Market Segmentation By Product
Figure 25 Global Connected Living Room Market Size Percentage Share From TV Systems, By Type, (2013�2020)
Figure 26 Connected Living Room Market Size Trend From LED TV System, By Geography, 2013�2020
Figure 27 Connected Living Room Market Size Trend From Lcd TV System, By Geography, 2013�2020
Figure 28 Connected Living Room Market Size Trend From Plasma TV System, By Geography, 2013�2020
Figure 29 Connected Living Room Market Size Trend From Oled TV System, By Geography, 2013-2020
Figure 30 Global Connected Living Room Market Size Trend From TV, By Geography, 2013�2020
Figure 31 Penetration of Smart TVs in the Total TV System Market, 2013�2020
Figure 32 Penetration of 3d TVs in the Total Market, 2013�2020
Figure 33 Percent Market Share of Blu-Ray Players, By Geography, 2013�2020
Figure 34 Connected Living Room Market Share From Home Theatre System, By Geography, 2013�2020
Figure 35 Percent Split of HT Projector Market, By Resolution, 2013�2020
Figure 36 Penetration of HT Projectors in Home Theatre System Market, 2013�2020
Figure 37 Percent Split of Audio Systems Market, By Output Channels, 2013�2020
Figure 38 Gaming Consoles Percent Share, By Geography, 2013�2020
Figure 39 Segmentation of CLR Market, By Semiconductor Components
Figure 40 Global CLR Market Size, By Geography, 2013-2020 ($Billion)
Figure 41 Global CLR Market Shipment and Asp By Geography, 2013-2020
Figure 42 Share of CLR Devices in North America, 2013�2020 (%)
Figure 43 North America: Penetration of Smart TV and 3d TV, 2013�2020
Figure 44 Europe: Penetration Rate of Smart TV and 3d TV Systems, 2013�2020 (%)
Figure 45 Share of CLR Devices in APAC, 2013 & 2020 (%)
Figure 46 APAC: Penetration Rate of Smart TV and 3d TV Systems, 2013�2020
Figure 47 Percent Share of CLR Devices in ROW, 2013�2020
Figure 48 ROW: Penetration Rate of Smart TV and 3d TV Systems, 2013�2020
Figure 49 Smartphones: Market Share of Top Players, 2013 (%)
Figure 50 Television Systems: Market Share of Top Players, 2013 (%)
Figure 51 Set-Top Box: Market Share of Top Players, 2013 (%)
Figure 52 Gaming Consoles: Market Share of Top Players, 2013 (%)
Figure 53 Benq Corporation: Products & Services
Figure 54 Echostar Corporation: Company Snapshot
Figure 55 Echostar Corporation: Products & Services
Figure 56 Echostar Corporation: SWOT Analysis
Figure 57 Koninklijke Philips N.V.: Company Snapshot
Figure 58 Koninklijke Philips N.V.: Products & Services
Figure 59 Koninklijke Philips N.V.: SWOT Analysis
Figure 60 LG Electronics: Company Snapshot
Figure 61 LG Electronics: Products & Services
Figure 62 LG Electronics: SWOT Analysis
Figure 63 Nintendo Co., Ltd.: Company Snapshot
Figure 64 Nintendo Co., Ltd.: SWOT Analysis
Figure 65 Pace PLC: Company Snapshot
Figure 66 Pace PLC: Products & Services
Figure 67 Panasonic Corporation: Company Snapshot
Figure 68 Panasonic Corporation: Products & Services
Figure 69 Panasonic Corporation: SWOT Analysis
Figure 70 Samsung Electronics: Company Snapshot
Figure 71 Samsung Electronics: Products & Services
Figure 72 Samsung Electronics: SWOT Analysis
Figure 73 Sony Corporation: Company Snapshot
Figure 74 Sony Corporation: Products & Services
Figure 75 Sony Corporation: SWOT Analysis
Figure 76 Techicolor SA: Company Snapshot
Figure 77 Technocolor SA: Product & Services
Figure 78 TIVO, inc.: Company Snapshot


Growth opportunities and latent adjacency in Connected Living Room Market
Hello, I am a student and I am really interest about your research. Would be possible to get a sample of your report? Hoping to have a positive answer from you.