MV Protection Relay Market by Type (Electromechanical & Static Relay, Digital & Numerical Relay), Connected Load (Feeder Lines, Transformers, and Motors), End-User (Utilities, Industrial, and Commercial & Institutional) & Region - Global Forecast to 2023


[132 Pages Report] The study involved 4 major activities in estimating the current size for the MV protection relay market. Exhaustive secondary research was done to collect information on the peer and parent markets. The next step was to validate these findings, assumptions, and sizing with industry experts across the value chain through primary research. Both top-down and bottom-up approaches were employed to estimate the complete market size. Thereafter, market breakdown and data triangulation were used to estimate the market size of the segments and subsegments.
Secondary Research
In the secondary research process, various secondary sources such as Hoovers, Bloomberg BusinessWeek, and Dun & Bradstreet have been referred to identify and collect information for this study. These secondary sources included annual reports, press releases & investor presentations of companies, white papers, certified publications, articles by recognized authors, gold standard & silver standard websites, regulatory bodies, trade directories, and databases
Primary Research
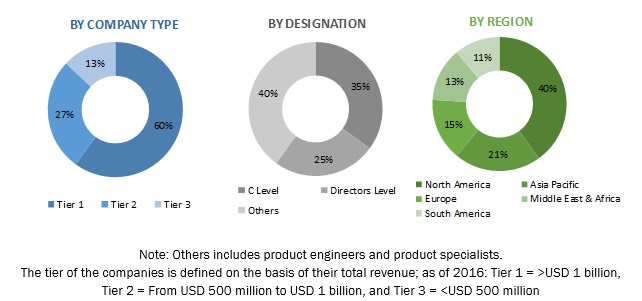
The MV protection relay market comprises several stakeholders such as energy utilities, government and industry associations, institutional investors, power and energy associations, and transmission & distribution (T&D) utilities in the supply chain. The demand side of this market is characterized by the development of the T&D networks, increasing renewable industry, and growth in power demand. The supply side is characterized by new product launches and diverse application industries. Various primary sources from both, the supply and demand sides of the market were interviewed to obtain qualitative and quantitative information. Following is the breakdown of primary respondents:
To know about the assumptions considered for the study, download the pdf brochure
Market Size Estimation
Both top-down and bottom-up approaches were used to estimate and validate the total size of the MV protection relay market. These methods were also used extensively to estimate the size of various subsegments in the market. The research methodology used to estimate the market size includes the following:
- The key players in the industry and markets have been identified through extensive secondary research.
- The industry�s supply chain and market size, in terms of value, have been determined through primary and secondary research processes.
- All percentage shares, splits, and breakdowns have been determined using secondary sources and verified through primary sources
Data Triangulation
After arriving at the overall market size from estimation process explained above, the total market has been split into several segments and subsegments. To complete the overall market engineering process and arrive at the exact statistics for all the segments and subsegments, the data triangulation and market breakdown processes have been employed, wherever applicable. The data has been triangulated by studying the various factors and trends from both the demand and supply sides. Along with this, the market has been validated using both the top-down and bottom-up approaches.
Objectives of the Study
- To define and segment the MV protection relay market with respect to type, connected load, end-user, and region
- To provide detailed information about the major factors influencing the growth of the market (drivers, restraints, opportunities, and industry-specific challenges)
- To strategically analyze the market with respect to individual growth trends, future expansions, and contributions to the market
- To analyze market opportunities for stakeholders and details of the competitive landscape for market leaders
- To forecast the growth of the market with respect to major regions (Asia Pacific, Europe, North America, Middle East & Africa, and South America)
- To strategically profile key players and comprehensively analyze their market rankings and core competencies
- To analyze competitive developments such as new product developments, mergers & acquisitions, expansions & investments, partnership & collaboration, and contracts & agreements, in the MV protection relay market
Scope of the report
| Report Metric |
Details |
|
Market size available for years |
2016�2023 |
|
Base year considered |
2017 |
|
Forecast period |
2018�2023 |
|
Forecast units |
Value (USD) |
|
Segments covered |
Type, Connected Load, End-User, and Region |
|
Geographies covered |
North America, Asia Pacific, South America, Europe, and Middle East & Africa |
|
Companies covered |
ABB (Switzerland), GE (US), Schneider Electric (France), Siemens (Germany), and SEL (US) among others |
This research report categorizes the MV protection relay market based on type, connected load, end-user, and region
On the basis of type, the MV protection relay market has been segmented as follows:
- Electromechanical & Static Relay
- Digital & Numerical Relay
On the basis of connected load, the MV protection relay market has been segmented as follows:
- Feeder Line
- Transformer
- Motor
- Others
On the basis of by end-user, the MV protection relay market has been segmented as follows:
- Utilities
- Industrial
- Commercial & Institutional
On the basis of by region, the MV protection relay market has been segmented as follows:
- Asia Pacific
- Europe
- North America
- Middle East & Africa
- South America
Available Customizations:
With the given market data, MarketsandMarkets offers customizations as per the client�s specific needs. The following customization options are available for this report:
Company Information
- Detailed analyses and profiling of additional market players (up to 5)
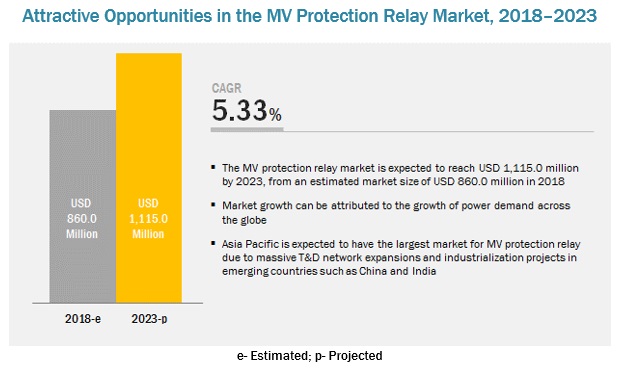
The global MV protection relay market is projected to reach a size of USD 1,115 million by 2023, at a CAGR of 5.33%, from an estimated USD 860 million in 2018. This growth can be attributed to the upgrading of existing substation and feeder line protection, expansion of transmission & distribution (T&D) networks, and growth of the renewable sector.
By type, the digital & numerical relay segment is expected to be the largest contributor in the MV protection relay market during the forecast period
The report segments the MV protection relay market, by type, into digital & numerical relay and electromechanical & static relay. The digital & numerical relay segment is expected to hold the largest market share by 2023.Digital & numerical relay is a microprocessor-based protective relay. Hence, it provides various benefits such as speed, accuracy, self-checking and self-adaptability, and the ability to communicate with other digital equipment (peer to peer), which would help in smart grid projects. Increasing modernization of substations in the developed nations to ensure uninterrupted power supply with minimum losses would drive the digital & numerical relay segment during the forecast period.
Feeder Lines accounts the largest market share during the forecast period
The MV protection relay market, by connected load, is segmented into feeder line, transformer, motor, and others. The feeder line segment is expected to dominate the market by 2023. Increasing T&D networks across the world would result in a consistent increase in the number of substations. Moreover, the government of Saudi Arabia also plans to launch a series of projects to overhaul the outdated segments of the power grid and modernize the transmission and distribution network system. The country plans to spend nearly USD 14.7 billion for the transmission of electricity and 13.7 billion for the distribution lines over the next 10 years. These factors are expected to drive the market
By end-user, the industrial segment is expected to grow at the fastest rate during the forecast period
The industrial segment is expected to grow at the fastest rate during the forecast period. Industrial segment includes oil & gas, chemical & pharmaceutical, metals & mining, and others. Uninterrupted delivery of power to machines is essential for all industries. Therefore, MV protection relays are used in industries to prevent damages to expensive instruments caused by overload, over temperature, overcurrent, jams and undercurrent, high resistance winding faults, current and voltage unbalance, phase loss, and phase reverse. Moreover, Asia Pacific hold the largest market share for oil & gas industry due to rise in urbanization, industrialization, and population growth. According to the BP Energy Outlook 2035: January 2017, the region is expected to account for almost 43% of the global liquid (oil, gas-to-liquids, biofuels, and coal-to-liquids) consumption by 2035. Thus, create a demand for market in the region. Additionally, factors such as the discovery of new reserves in the Great Australian Bight, the Gulf of Thailand, Turkmenistan, and the South China Sea, and the need for EOR (enhanced oil recovery) techniques in countries such as Thailand, Indonesia, India, Australia, and Malaysia. Thus, the exploration & production activities would increase. Therefore, the demand for electrical infrastructure will increase. Thus, create a demand for MV protection relay market in the region.
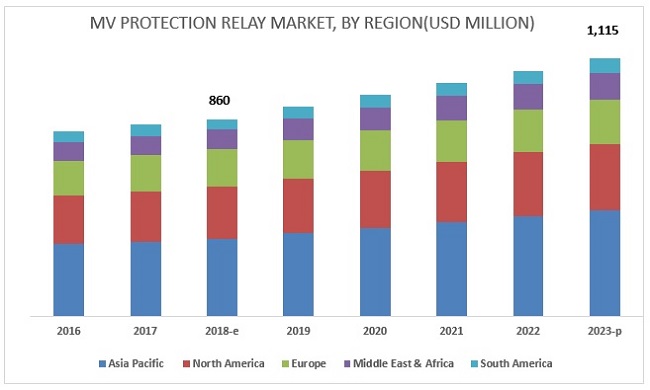
Asia Pacific is expected to account for the largest market size during the forecast period
In this report, the MV protection relay market has been analyzed with respect to 5 regions, namely, North America, Europe, South America, Asia Pacific, Africa, and the Middle East. The market in Asia Pacific is estimated to be the largest market from 2018 to 2023. Increasing T&D network expansions and industrialization projects are some of the key factors responsible for the growth of the market. Moreover, as per International Energy Agency (IEA), Asia Pacific is likely to add 2,911 GW of power capacity from 2014 to 2035 with 14,400 thousand km of new distribution line and 1,704 thousand km of the new transmission line from 2014 to 2035. Thus, it would boost the growth of market. Additionally, according to the Asian Development Bank, Indonesia aims to achieve 90% electrification rate by 2025, with countries such as the Philippines and Malaysia have similar plans. Such factors would boost the MV protection relay market in the region during the forecast period.
The major players in the global MV protection relay market, are ABB (Switzerland), Siemens (Germany), Schneider Electric (France), Rockwell (US), Eaton (Ireland), Mitsubishi Electric (Japan), SEL (US), Larsen & Toubro Limited (India), Toshiba Corporation (Japan), Terasaki (Japan), Powell Industries (US), Woodward (US), Solcon (Israel), and General Electric (US).
Recent Developments
- In September 2017, ABB acquired GE Industrial Solutions to strengthen its position in the electrification segment globally and expand its presence in the North American market
- In October 2017, Schneider acquired ASCO Power Technologies to enhance its EcoStruxure Power Platform in key markets and segments
- In November 2015, GE acquired Alstom�s power and grid businesses. This would expand the company�s reach in 20 countries, including the US, China, India, Japan, Brazil, and European countries.
Key Questions addressed by the report
- The report identifies and addresses key markets for MV protection relay, which would help manufacturers review the growth in demand.
- The report helps system providers understand the pulse of the market and provides insights into drivers, restraints, opportunities, and challenges.
- The report will help key players understand the strategies of their competitors better and make better strategic decisions.
To speak to our analyst for a discussion on the above findings, click Speak to Analyst
 Exclusive indicates content/data unique to MarketsandMarkets and not available with any competitors.
Table of Contents
1 Introduction (Page No. - 16)
1.1 Objectives of the Study
1.2 Definition
1.3 Market Scope
1.3.1 Market Segmentation
1.3.2 Regional Scope
1.4 Years Considered for the Study
1.5 Currency
1.6 Limitations
1.7 Stakeholders
2 Research Methodology (Page No. - 19)
2.1 Research Data
2.1.1 Secondary Data
2.1.1.1 Secondary Sources
2.1.2 Primary Data
2.1.2.1 Key Data From Primary Sources
2.1.2.2 Key Data From Primary Sources
2.1.2.3 Breakdown of Primaries
2.2 Market Size Estimation
2.2.1 Bottom-Up Approach
2.2.2 Top-Down Approach
2.3 Market Breakdown & Data Triangulation
2.4 Research Assumptions
3 Executive Summary (Page No. - 27)
4 Premium Insights (Page No. - 31)
4.1 Attractive Opportunities in the MV Protection Relay Market, 2018�2023
4.2 Market, By Type
4.3 Market, By Connected Load
4.4 Market, By End-User
4.5 Asia Pacific MV Protection Relay Market
5 Market Overview (Page No. - 34)
5.1 Introduction
5.2 Market Dynamics
5.3 Drivers
5.3.1 Growth of the Renewable Industry
5.3.2 Expansion of Transmission & Distribution Networks
5.3.3 Upgrade of Existing Substations and Feeder Line Protection
5.4 Restraints
5.4.1 Increasing Competition From the Unorganized Sector
5.4.2 Lack of Investments From Governments in Grid Stability
5.5 Opportunities
5.5.1 Growing Power Demand
5.5.2 Growing Demand for Electronic Devices
5.5.3 Changing Face of the Middle Eastern Manufacturing Industry
5.6 Challenges
5.6.1 Delays in Grid Expansion Projects
5.6.2 Cybersecurity Issues for Protection Relays
6 MV Protection Relay Market, By Type (Page No. - 40)
6.1 Introduction
6.2 Electromechanical & Static Relay
6.2.1 Asia Pacific is Projected to Be the Largest Market for Electromechanical & Static Relays
6.3 Digital & Numerical Relay
6.3.1 Asia Pacific is Projected to Be the Fastest and the Largest Market for Digital & Numerical Relay
7 MV Protection Relay Market, By Connected Load (Page No. - 44)
7.1 Introduction
7.2 Feeder Line
7.2.1 Rising Investment in Distribution Network is Expected to Drive the Demand for MV Protection Relay in Feeder Line
7.3 Transformers
7.3.1 North America Projected to Be Second Largest Market for MV Protection Relays in Transformers
7.4 Motors
7.4.1 Increasing Industrialization is the Major Driver for the Growth of MV Protection Relay in Motor
7.5 Others
8 MV Protection Relay Market, By End-User (Page No. - 50)
8.1 Introduction
8.2 Utilities
8.2.1 Power Generation
8.2.1.1 Asia Pacific is Expected to Hold the Largest Market Share
8.2.2 Power Distribution
8.2.2.1 Increasing Demand for Power Globally is Driving the MV Protection Relay Market
8.3 Industrial
8.3.1 Oil & Gas
8.3.1.1 Oil & Gas is Expected to Be the Largest Market in Industrial Segment of MV Protection Relay Market
8.3.2 Metal & Mining
8.3.2.1 North America is Projected to Be the Second Largest Market of Metal & Mining Segment
8.3.3 Chemical & Pharmaceutical
8.3.3.1 Middle East & Africa is Projected to Be the Second Fastest Growing Market
8.3.4 Others
8.4 Commercial & Institutional
8.4.1 North America is the Second Largest Market for Commercial & Institutional Segment
9 MV Protection Relay Market, By Region (Page No. - 59)
9.1 Introduction
9.2 North America
9.2.1 By Type
9.2.2 By Connected Load
9.2.3 By End-User
9.2.4 By Country
9.2.4.1 US
9.2.4.1.1 Increasing Modernization of Electric Infrastructure is Expected to Propel the Growth of MV Protection Relay Market in the Country
9.2.4.2 Canada
9.2.4.2.1 Increasing Focus on Infrastructure Development is One of the Factor for the Growth of Market
9.2.4.3 Mexico
9.2.4.3.1 Utilities is Estimated to Contribute the Largest Market Share of Mexican Market
9.3 Asia Pacific
9.3.1 By Type
9.3.2 By Connected Load
9.3.3 By End-User
9.3.4 By Country
9.3.4.1 China
9.3.4.1.1 Industrial Segment is Expected to Be Fastest Growing Market of MV Protection Relay
9.3.4.2 India
9.3.4.2.1 Expansion of T&D Network is Expected to Drive the MV Protection Relay Market in the Country
9.3.4.3 Japan
9.3.4.3.1 Growth of Renewable Industry in the Country is Expected to Drive the Market
9.3.4.4 Australia
9.3.4.4.1 Industrial Segment is Projected to Be the Fastest Growing Market in Australia
9.3.4.5 South Korea
9.3.4.5.1 Utilities is Estimated to Be the Largest MV Protection Relay Market in South Korea
9.3.4.6 Rest of Asia Pacific
9.4 Europe
9.4.1 By Type
9.4.2 By Connected Load
9.4.3 By End-User
9.4.4 By Country
9.4.4.1 Germany
9.4.4.1.1 Increasing Investment in Renewables is Expected to Fuel the Growth of Market
9.4.4.2 France
9.4.4.2.1 Industrial Segment is Estimated to Be the Second Largest Market in France
9.4.4.3 UK
9.4.4.3.1 Increasing Initiatives for the Addition of Renewables Across the Country is Expected to Drive the MV Protection Relay Market.
9.4.4.4 Russia
9.4.4.4.1 Industrial Segment is Projected to Have Fastest Growth Rate
9.4.4.5 Italy
9.4.4.5.1 Oil & Gas is Largest Industrial End-User of MV Protection Relay
9.4.4.6 Rest of Europe
9.5 South America
9.5.1 By Type
9.5.2 By Connected Load
9.5.3 By End-User
9.5.4 By Country
9.5.4.1 Brazil
9.5.4.1.1 Utilities is Projected to Be the Largest Market in Brazil
9.5.4.2 Argentina
9.5.4.2.1 Industrial is Expected to Grow at A Fastest Rate During the Forecast Period
9.5.4.3 Rest of South America
9.6 Middle East & Africa
9.6.1 By Type
9.6.2 By Connected Load
9.6.3 By End-User
9.6.4 By Country
9.6.4.1 Saudi Arabia
9.6.4.1.1 Growing Construction Activities in the Saudi Arabia Contribute to the Growth of Market
9.6.4.2 UAE
9.6.4.2.1 Increasing Industrialization Across the Country is Expected to Boost the Market
9.6.4.3 Qatar
9.6.4.3.1 Commercial & Institutional Segment is Projected to Be the Second Fastest Growing Market in Qatar
9.6.4.4 Kuwait
9.6.4.4.1 Investment in Utilities Segment is Expected to Propel the Growth of Market
9.6.4.5 Nigeria
9.6.4.5.1 Utilities Segment is Holds the Largest Market Share of Nigerian Market
9.6.4.6 Egypt
9.6.4.6.1 Industrial Segment is Projected to Grow at Fastest Rate
9.6.4.7 South Africa
9.6.4.7.1 South African Market is Dominated By Utilities Segment
9.6.4.8 Rest of Middle East & Africa
10 Competitive Landscape (Page No. - 93)
10.1 Overview
10.2 Ranking of Players and Industry Concentration, 2017
10.3 Competitive Scenario
10.3.1 New Product Launches
10.3.2 Investments & Expansions
10.3.3 Contracts & Agreements
10.3.4 Mergers & Acquisitions
10.3.5 Others
11 Company Benchmarking (Page No. - 97)
(Business Overview, Products Offered, Recent Developments, MnM View)*
11.1 ABB
11.2 Siemens
11.3 Schneider Electric
11.4 Rockwell
11.5 Eaton
11.6 Mitsubishi Electric
11.7 Schweitzer
11.8 Larsen & Toubro
11.9 Toshiba Corporation
11.10 Terasaki
11.11 Powell Industries
11.12 Woodward
11.13 Solcon
11.14 General Electric
*Details on Business Overview, Products Offered, Recent Developments, MnM View Might Not Be Captured in Case of Unlisted Companies.
12 Appendix (Page No. - 128)
12.1 Insights of Industry Experts
12.2 Discussion Guide
12.3 Knowledge Store: Marketsandmarkets� Subscription Portal
12.4 Available Customizations
12.5 Related Reports
12.6 Author Details
List of Tables (70 Tables)
Table 1 MV Protection Relay Market Snapshot
Table 2 Transmission & Distribution Infrastructure Expansion Plans
Table 3 Market Size, By Type, 2016�2023 (USD Million)
Table 4 Electromechanical & Static Relay: Market Size, By Region, 2016�2023 (USD Million)
Table 5 Digital & Numerical Relay: Market Size, By Region, 2016�2023 (USD Million)
Table 6 Market Size, By Connected Load, 2016�2023 (USD Million)
Table 7 Feeder Line: Market Size, By Region, 2016�2023 (USD Million)
Table 8 Transformer: Market Size, By Region, 2016�2023 (USD Million)
Table 9 Motors: Market Size, By Region, 2016�2023 (USD Million)
Table 10 Others: Market Size, By Region, 2016�2023 (USD Million)
Table 11 Market Size, By End-User, 2016�2023 (USD Million)
Table 12 Utilities: Market Size, By End-User, 2016�2023 (USD Million)
Table 13 Utilities: Market Size, By Region, 2016�2023 (USD Million)
Table 14 Power Generation: Market Size, By Region, 2016�2023 (USD Million)
Table 15 Power Distribution: Market Size, By Region, 2016�2023 (USD Million)
Table 16 Industrial: Market Size, By End-User, 2016�2023 (USD Million)
Table 17 Industrial: Market Size, By Region, 2016�2023 (USD Million)
Table 18 Oil & Gas: Market Size, By Region, 2016�2023 (USD Million)
Table 19 Metal & Mining: Market Size, By Region, 2016�2023 (USD Million)
Table 20 Chemical & Pharmaceutical: Market Size, By Region, 2016�2023 (USD Million)
Table 21 Others: Market Size, By Region, 2016�2023 (USD Million)
Table 22 Commercial & Institutional: Market Size, By Region, 2016�2023 (USD Million)
Table 23 Market Size, By Region, 2016�2023 (USD Million)
Table 24 North America: MV Protection Relay Market Size, By Type, 2016�2023 (USD Million)
Table 25 North America: Market Size, By Connected Load, 2016�2023 (USD Million)
Table 26 North America: Market Size, By End-User, 2016�2023 (USD Million)
Table 27 North America: Market Size, By Country, 2016�2023 (USD Million)
Table 28 US: Market Size, By End-User, 2016�2023 (USD Million)
Table 29 Canada: Market Size, By End-User, 2016�2023 (USD Million)
Table 30 Mexico: Market Size, By End-User, 2016�2023 (USD Million)
Table 31 Asia Pacific: MV Protection Relay Market Size, By Type, 2016�2023 (USD Million)
Table 32 Asia Pacific: Market Size, By Connected Load, 2016�2023 (USD Million)
Table 33 Asia Pacific: Market Size, By End-User, 2016�2023 (USD Million)
Table 34 Asia Pacific: Market Size, By Country, 2016�2023 (USD Million)
Table 35 China: Market Size, By End-User, 2016�2023 (USD Million)
Table 36 India: Market Size, By End-User, 2016�2023 (USD Million)
Table 37 Japan: Market Size, By End-User, 2016�2023 (USD Million)
Table 38 Australia: Market Size, By End-User, 2016�2023 (USD Million)
Table 39 South Korea: Market Size, By End-User, 2016�2023 (USD Million)
Table 40 Rest of Asia Pacific: Market Size, By End-User, 2016�2023 (USD Million)
Table 41 Europe: MV Protection Relay Market Size, By Type, 2016�2023 (USD Million)
Table 42 Europe: Market Size, By Connected Load, 2016�2023 (USD Million)
Table 43 Europe: Market Size, By End-User, 2016�2023 (USD Million)
Table 44 Europe: Market Size, By Country, 2016�2023 (USD Million)
Table 45 Germany: Market Size, By End-User, 2016�2023 (USD Million)
Table 46 France: Market Size, By End-User, 2016�2023 (USD Million)
Table 47 UK: Market Size, By End-User, 2016�2023 (USD Million)
Table 48 Russia: Market Size, By End-User, 2016�2023 (USD Million)
Table 49 Italy: Market Size, By End-User, 2016�2023 (USD Million)
Table 50 Rest of Europe: Market Size, By End-User, 2016�2023 (USD Million)
Table 51 South America: MV Protection Relay Market Size, By Type, 2016�2023 (USD Million)
Table 52 South America: Market Size, By Connected Load, 2016�2023 (USD Million)
Table 53 South America: Market Size, By End-User, 2016�2023 (USD Million)
Table 54 South America: Market Size, By Country, 2016�2023 (USD Million)
Table 55 Brazil: Market Size, By End-User, 2016�2023 (USD Million)
Table 56 Argentina: Market Size, By End-User, 2016�2023 (USD Million)
Table 57 Rest of South America: Market Size, By End-User, 2016�2023 (USD Million)
Table 58 Middle East & Africa: MV Protection Relay Market Size, By Type, 2016�2023 (USD Million)
Table 59 Middle East & Africa: Market Size, By Connected Load, 2016�2023 (USD Million)
Table 60 Middle East & Africa: Market Size, By End-User, 2016�2023 (USD Million)
Table 61 Middle East & Africa: Market Size, By Country, 2016-2023 (USD Million)
Table 62 Saudi Arabia: Market Size, By End-User, 2016�2023 (USD Million)
Table 63 UAE: Market Size, By End-User, 2016�2023 (USD Million)
Table 64 Qatar: Market Size, By End-User, 2016�2023 (USD Million)
Table 65 Kuwait: Market Size, By End-User, 2016�2023 (USD Million)
Table 66 Nigeria: Market Size, By End-User, 2016�2023 (USD Million)
Table 67 Egypt: Market Size, By End-User, 2016�2023 (USD Million)
Table 68 South Africa: Market Size, By End-User, 2016�2023 (USD Million)
Table 69 Rest of Middle East & Africa: Market Size, By End-User, 2016�2023 (USD Million)
Table 70 Siemens Was the Most Active Player in the Market Between 2015 and 2018
List of Figures (42 Figures)
Figure 1 Research Design
Figure 2 Breakdown of Primaries: By Company Type, Designation, & Region
Figure 3 Bottom-Up Approach
Figure 4 Top-Down Approach
Figure 5 Data Triangulation Methodology
Figure 6 Assumptions of the Research Study
Figure 7 Digital & Numerical Relay Segment to Register the Highest CAGR During the Forecast Period
Figure 8 Feeder Line Segment to Lead the MV Protection Relay Market From 2018 to 2023
Figure 9 Utilities Segment to Be the Leading End-User of the Market, 2018�2023
Figure 10 Asia Pacific to Lead the Market During the Forecast Period
Figure 11 Growing Transmission & Distribution Network Across the World is Expected to Drive the Market
Figure 12 Digital & Numerical Relay Segment to Register the Highest CAGR From 2018 to 2023
Figure 13 Feeder Line Segment Accounted for the Largest Market Share in 2017
Figure 14 Utilities Segment Held the Largest Market Share in 2017
Figure 15 China Was the Largest Market in Asia Pacific in 2017
Figure 16 MV Protection Relay Market: Drivers, Restraints, Opportunities, & Challenges
Figure 17 Investments in Renewable Energy Sources, 2004�2016 (USD Billion)
Figure 18 The Fastest Growing Power Generation Countries in Asia Pacific, Middle East, and Africa
Figure 19 Digital & Numerical Relay Segment Led the MV Protection Relay Market, By Type, in 2017
Figure 20 Feeder Line Segment Led the Market, By Connected Load, in 2017
Figure 21 Utilities Segment Led the Market, By End-User, 2017
Figure 22 India is Expected to Grow at the Highest CAGR During the Forecast Period
Figure 23 Asia Pacific Led the Market in 2017
Figure 24 North America: Market Snapshot
Figure 25 Asia Pacific: Market Snapshot
Figure 26 Europe: Market Snapshot in 2017
Figure 27 South America: Market Snapshot, 2017
Figure 28 Middle East & Africa: Market Snapshot, 2017
Figure 29 Key Developments in the Market, 2015�2018
Figure 30 ABB Led the Market in 2017
Figure 31 ABB: Company Snapshot
Figure 32 Siemens: Company Snapshot
Figure 33 Schneider Electric: Company Snapshot
Figure 34 Rockwell: Company Snapshot
Figure 35 Eaton: Company Snapshot
Figure 36 Mitsubishi Electric: Company Snapshot
Figure 37 Larsen & Toubro: Company Snapshot
Figure 38 Toshiba Corporation: Company Snapshot
Figure 39 Terasaki: Company Snapshot
Figure 40 Powell Industries: Company Snapshot
Figure 41 Woodward: Company Snapshot
Figure 42 General Electric: Company Snapshot


Growth opportunities and latent adjacency in MV Protection Relay Market