Non-Protein Nitrogen Market by Type (Urea, Ammonia, and Others), Form (Dry, Liquid, and Pellets), Livestock (Beef Cattle, Dairy Cattle, Sheep & Goat, and Others), and by Region - Global Forecasts to 2020


[171 Pages Report] The overall feed non-protein nitrogen market is expected to grow from USD 1.32 billion in 2015 to USD 1.65 billion by 2020, at a CAGR of 4.5% from 2015 to 2020. Non-protein nitrogen (NPN) is a component used as an alternative for proteins. The types of non-protein nitrogen used as feed are urea (coated urea, other urea), ammonia, and others (monoammonium phosphate, diammonium phosphate, and biuret). The animal system requires protein in order to acquire nitrogen and non-protein nitrogen supplies for their overall well-being.
Feed costs are higher when associated with the production of milk and meat. Therefore, the use of non-protein nitrogen helps ruminant growers as it is inexpensive, compared to natural sources of proteins.
The base year considered for the study is 2014, and the forecast has been provided for the period between 2015 and 2020.
Market Dynamics
Drivers
- Increasing demand for animal products
- Easy availability
- Cost-effectiveness
- R&D activities in the feed industry
Restraints
- Regulatory structures
- Toxicity of urea in ruminants
Opportunities
- Emerging markets: New growth frontier
- Technological advancement
Challenges
- Not recommended by nutritionist
High preference of protein as compared to other sources of feed drives the global feed non-protein nitrogen market
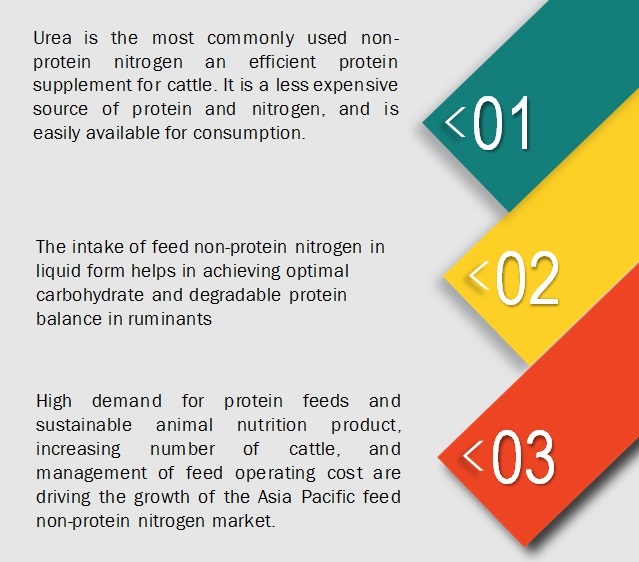
Livestock producers are aware of the fact that urea is the most common source of non-protein nitrogen in feed; it contains 46.7% nitrogen compared to 16% for most protein. Feed that contains urea has several positive impacts as compared to natural sources even in adverse conditions. It has several benefits related to body weight, growth rate, and also results in higher milk yields of livestock. Urea is found to be a source of readily available carbohydrates, helps in easy solubility of proteins, and provides an adequate supply of minerals. These are factors that accelerate urea utilization in ruminants. According to the Colorado State University, 281% of protein can be obtained from 13.5 pounds of urea, whereas 86.5 pounds of corn or similar grains are required to obtain the same amount of protein in the ruminant. Due to this advantage, livestock producers are showing a gradual shift from natural protein sources to non-protein nitrogen.
The following are the major objectives of the study.
- To define, segment, and project the feed non-protein nitrogen market with respect to the type, form, livestock, and key regional markets
- To provide detailed information about the crucial factors influencing the growth of the market (drivers, restraints, opportunities, and industry-specific challenges)
- To strategically analyze the feed non-protein nitrogen market with respect to individual growth trends, future prospects, and contribution to the total market
- To analyze opportunities in the market for stakeholders and details of the competitive landscape for market leaders
- To project the size of the market, in terms of value, in the key regions [North America, Europe, Asia Pacific, Latin America, and Rest of the World (RoW)]
- To strategically profile the key players and comprehensively analyze their market share
- To analyze competitive developments such as new product launches, acquisitions, investments, expansions, partnerships, agreements, joint ventures, and collaborations in the feed non-protein nitrogen market
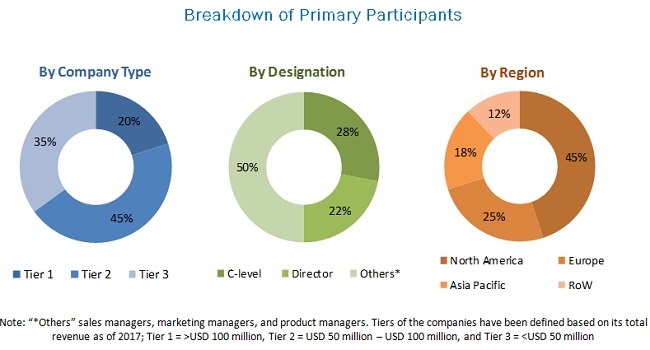
During this research study, major players operating in the feed non-protein nitrogen market in various regions have been identified, and their offerings, regional presence, and distribution channels have been analyzed through in-depth discussions. Top-down and bottom-up approaches have been used to determine the overall market size. Sizes of the other individual markets have been estimated using the percentage splits obtained through secondary sources such as Hoovers, Bloomberg BusinessWeek, and Factiva, along with primary respondents. The entire procedure includes the study of the annual and financial reports of the top market players and extensive interviews with industry experts such as CEOs, VPs, directors, and marketing executives for key insights (both qualitative and quantitative) pertaining to the market. The figure below shows the breakdown of the primaries on the basis of the company type, designation, and region considered during the research study.
To know about the assumptions considered for the study, download the pdf brochure
The feed non-protein nitrogen market comprises a network of players involved in the research and product development; raw material supply; component manufacturing; distribution and sale; and post-sales services. Key players considered in the analysis of the feed non-protein nitrogen market are Archer Daniels Midland Company (US), Yara International ASA (Norway), Borealis AG (Austria), Incitec Pivot Ltd.(Australia), The Potash Corporation of Saskatchewan Inc. (Canada), and Petr�leo Brasileiro S.A. (Brazil).
Major Market Developments
- In December 2015, Alltech Inc. (Kentucky, US) opened its production facility for optigen II, a non-protein nitrogen source in Australia. This helped the company grow geographically.
- In November 2015, Archer Daniels Midland Company (US) opened a new animal nutrition plant in China in order to grow its feed business.
- In July 2015, Archer Daniels Midland Company (US) entered into a joint venture with Quality Liquid Feeds, Inc. (UK) in order to manufacture and sell liquid feed supplements. The joint venture helped ADM to strengthen its animal feed business.
- August 2014, Yara International ASA (Norway) acquired Galvani, a privately-held fertilizer company headquartered in Brazil. Galvani is engaged in phosphate mining, Single Super Phosphate (SSP) production, and distribution of fertilizers in the central and northeast of Brazil.
Target Audience
- Non-protein nitrogen manufacturers
- Non-protein nitrogen importers and exporters
- Non-protein nitrogen traders, distributors, and suppliers
- Government and research organizations
- Associations and industry bodies such as Food and Agriculture Organization (FAO), Association of American Feed Control Officials (AAFCO) of the US, and the European Food Safety Authority (ESFA) in Europe regulate the usage of non-protein nitrogen for ruminants.
Report Scope
By Type
- Urea
- Ammonia
- Others (monoammonium phosphate, diammonium phosphate, and biuret)
By Form:
- Dry (prills and granules)
- Liquid
- Pellets
By Livestock:
- Dairy cattle
- Beef cattle
- Sheep and goat
- Others (non-ruminants)
By Geography
- North America
- Europe
- Asia Pacific
- Latin America
- Rest of the World (RoW)
Critical questions which the report answers
- What are types in which the non-protein nitrogen manufacturers are exploring?
- Which are the key players in the market and how intense is the competition?
Available Customizations
Based on the given market data, MarketsandMarkets offers customizations in the reports as per the client�s specific requirements. The available customization options are as follows:
Product Analysis
- Product matrix which gives a detailed comparison of product portfolio of each company
Geographic Analysis
- Further breakdown of the Rest of Asia Pacific feed non-protein nitrogen market into South Korea, Australia, and New Zealand
- Further breakdown of a region with respect to a particular country
Company Information
- Detailed analysis and profiling of additional market players (Up to five)
The overall feed non-protein nitrogen market is expected to grow from USD 1.32 billion in 2015 to USD 1.65 billion by 2020, at a CAGR of 4.5% from 2015 to 2020. The growth of the feed non-protein nitrogen market is primarily triggered by the more than equivalent protein value derived from the non-protein nitrogen compounds in comparison to plant and animal sources. Moreover, the increasing awareness with regard to regulations among the livestock producers is the key driver of this market.
The feed non-protein nitrogen market has been segmented, on the basis of type, into urea, ammonia, and others (monoammonium phosphate, diammonium phosphate, and biuret). Among all feed non-protein nitrogen, urea is preferred by feed producers due to its low cost. According to International Raw Material 2000, the production of urea in China tripled from 1989 to 1999. Since then, there has been an increase of almost 25% in the global production of urea in several Latin American countries. Further expansion in the production of urea is expected in several Middle Eastern countries such as Kuwait, Qatar, Egypt, Oman, and Iran. Furthermore, the cost of natural protein such as those found in soybean and corn is high, which has prompted cattle growers to choose an alternative that is cost-effective and provides the same results, leading to increased usage of urea in cattle rations.
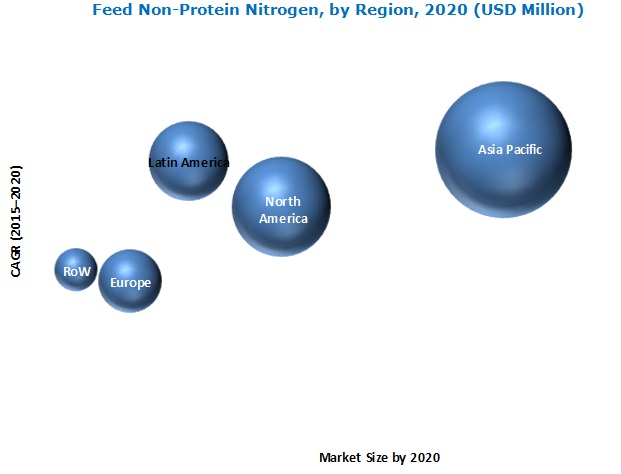
The Asia Pacific region accounted for the largest share in the feed non-protein nitrogen market, followed by North America and Latin America. Adoption of urea as feed for ruminants is increasing in emerging countries such as Brazil, China, India, and Japan, which is supported by the high presence of protein and nitrogen. The Asia Pacific region is projected to be the fastest-growing market owing to investments from several multinational manufacturers and growing awareness regarding uses of non-protein nitrogen as feed, especially in countries such as the China, India, and Brazil.
Increase in livestock population, especially beef cattle and dairy cattle, have accelerated the market demand for non-protein nitrogen across the globe.
Beef cattle
The rising demand for processed beef has created a significant need for high-quality beef cattle. Protein is a vital component, as it is a source of nutrition for beef cattle and commonly used as crude protein. Urea and other sources of non-protein nitrogen are inexpensive sources of high protein feed for beef cattle. Beef producers commonly use urea due to its lesser cost and wider availability, which drives the growth of the overall feed non-protein nitrogen market.
Dairy cattle
Dairy farmers have started utilizing improved high-protein sources to provide balanced nutrition to their dairy cattle and enhance their milk production. Genetically improved varieties of cattle require a higher amount of nutrition in order to offer a higher yield of milk. Increasing feed costs have pushed dairy farmers to use economic sources of nutrition, such as non-protein nitrogen.
Sheep & goat
Sheep and goat are ruminants that utilize insignificant amounts of non-protein nitrogen in the feed. Typically, the use of feed non-protein nitrogen is greater in sheep as compared to goats. According to Alemu Yami, Animal feeds and Livestock expert at FAO, Ethiopia, the amount of urea or other non-protein nitrogen sources should not exceed 10% of total amount of feed and proves adequate when included in concentrate mixtures for sheep feed.
Critical questions the report answers:
- Where will all these developments take the industry in the mid to long term?
- What are the upcoming types for feed non-protein nitrogen?
To speak to our analyst for a discussion on the above findings, click Speak to Analyst
The different regulatory structures and interventions in different countries around the globe, related to the usage of feed non-protein nitrogen and toxicity of non-protein nitrogen in ruminants, may hinder the growth of the feed non-protein nitrogen market.
Key players in the market include Archer Daniels Midland Company (US) and Yara International ASA (Norway), Borealis AG (Austria), Incitec Pivot Limited (Australia), and The Potash Corporation of Saskatchewan Inc. (Canada), Petr�leo Brasileiro S.A. (Brazil), among others. These players are increasingly undertaking new product launches, expansions, acquisitions, investments & joint ventures.
 Exclusive indicates content/data unique to MarketsandMarkets and not available with any competitors.
Table of Contents
1 Introduction (Page No. - 16)
1.1 Objectives of the Study
1.2 Market Definition
1.2.1 Markets Covered
1.2.2 Years Considered for the Study
1.3 Currency
1.4 Stakeholders
1.5 Limitations
2 Research Methodology (Page No. - 19)
2.1 Research Data
2.1.1 Secondary Data
2.1.1.1 Key Data From Secondary Sources
2.1.2 Primary Data
2.1.2.1 Key Data From Primary Sources
2.1.2.2 Key Industry Insights
2.1.2.2.1 Breakdown of Primaries, By Region, Designation & Company
2.2 Factor Analysis
2.2.1 Introduction
2.2.2 Demand-Side Analysis
2.2.2.1 Significant Growth in the Feed Additives Industry
2.2.2.2 Increasing Demand for Urea
2.2.2.3 Higher Cost of Alternatives
2.2.3 Supply-Side Analysis
2.2.3.1 Fluctuation in Raw-Material Prices
2.3 Market Size Estimation
2.4 Market Breakdown & Data Triangulation
2.5 Market Share Estimation
2.6 Research Assumptions & Limitations
2.6.1 Assumptions
2.6.2 Limitations of the Research Study
3 Executive Summary (Page No. - 32)
4 Premium Insights (Page No. - 38)
4.1 Attractive Opportunities in Feed Non-Protein Nitrogen Market
4.2 Feed Non-Protein Nitrogen Markt, By Type
4.3 Feed Non-Protein Nitrogen Market, By Form
4.4 Feed Non-Protein Nitrogen Market, By Livestock
4.5 Asia-Pacific Feed Non-Protein Nitrogen Market
4.6 Feed Non-Protein Nitrogen: Market Shares of Top Countries, 2014
4.7 Feed Non-Protein Nitrogen Market Life Cycle Analysis, By Region
5 Market Overview (Page No. - 44)
5.1 Introduction
5.2 Evolution
5.3 Market Segmentation
5.3.1 Feed Non-Protein Nitrogen Market, By Type
5.3.2 Feed Non-Protein Nitrogen Market, By Form
5.3.3 Feed Non-Protein Nitrogen Market, By Livestock
5.4 Market Dynamics
5.4.1 Drivers
5.4.1.1 Increasing Demand for Animal Products
5.4.1.2 Growing Dairy Industry
5.4.1.3 Increasing Meat Consumption
5.4.1.4 Increasing Cattle Population
5.4.1.5 High Presence of Protein as Compared to Other Sources of Feed
5.4.1.6 Easy Availability
5.4.1.7 Cost Effectiveness
5.4.1.8 Research & Development Activities in Animal Feed Industry
5.4.2 Restraints
5.4.2.1 Stringent Regulatory Structure
5.4.2.2 Toxicity of Non-Protein Nitrogen in Ruminants
5.4.2.3 Causes of Non-Protein Nitrogen Toxicity
5.4.3 Opportunities
5.4.3.1 Emerging Markets: New Growth Frontier
5.4.3.2 Technological Advancements
5.4.4 Challenges
5.4.4.1 Not Recommended By Nutritionists
6 Industry Trends (Page No. - 56)
6.1 Introduction
6.2 Value Chain Analysis
6.3 Supply Chain Analysis
6.4 Porter�s Five Forces Analysis
6.4.1 Intensity of Competitive Rivalry
6.4.2 Bargaining Power of Suppliers
6.4.3 Bargaining Power of Buyers
6.4.4 Threat of New Entrants
6.4.5 Threat of Substitutes
6.5 Regulatory System for Feed Non-Protein Nitrogen Safety
6.5.1 Stringent Regulations Laid By the U.S. Authorities
6.5.2 Regulations Laid By the European Commission
7 Feed Non-Protein Nitrogen Market, By Type (Page No. - 65)
7.1 Introduction
7.2 Urea
7.2.1 Recommendations for Urea Feeding
7.3 Ammonia
7.4 Others
8 Feed Non-Protein Nitrogen Market, By Form (Page No. - 74)
8.1 Introduction
8.2 Dry
8.3 Liquid
8.4 Pellet
9 Feed Non-Protein Nitrogen Market, By Livestock (Page No. - 80)
9.1 Introduction
9.2 Beef Cattle
9.3 Dairy Cattle
9.4 Sheep & Goat
9.5 Other Livestock Types
10 Feed Non-Protein Nitrogen Market, By Region (Page No. - 88)
10.1 Introduction
10.2 North America
10.2.1 U.S.
10.2.2 Canada
10.2.3 Mexico
10.3 Europe
10.3.1 Germany
10.3.2 U.K.
10.3.3 Spain
10.3.4 France
10.3.5 Poland
10.3.6 Rest of Europe
10.4 Asia-Pacific
10.4.1 China
10.4.2 India
10.4.3 Japan
10.4.4 Australia
10.4.5 Rest of Asia-Pacific
10.5 Latin America
10.5.1 Brazil
10.5.2 Argentina
10.5.3 Rest of Latin America
10.6 Rest of the World (RoW)
10.6.1 Africa
10.6.2 the Middle East
11 Competitive Landscape (Page No. - 133)
11.1 Overview
11.2 Feed Non-Protein Nitrogen Market: Market Share Analysis
11.3 Yara International ASA: the Top-Most Player
11.4 Competitive Situation and Trends
11.4.1 New Product Launch/Development
11.4.2 Expansions
11.4.3 Acquisitions
11.4.4 Investments & Joint Ventures
12 Company Profiles (Page No. - 139)
(Company at A Glance, Business Overview, Products Offered, Key Strategy, Recent Developments, SWOT Analysis & Mnm View)*
12.1 Introduction
12.2 Archer Daniels Midland Company
12.3 Yara International ASA
12.4 Borealis AG
12.5 Incitec Pivot Limited
12.6 The Potash Corporation of Saskatchewan Inc.
12.7 Petr�leo Brasileiro S.A.
12.8 Skw Stickstoffwerke Piesteritz GmbH
12.9 Fertiberia SA
12.10 Alltech Inc.
12.11 Antonio Tarazona SL
*Details on Company at A Glance, Recent Financials, Products Offered, Strategies & Insights, & Recent Developments Might Not Be Captured in Case of Unlisted Companies.
13 Appendix (Page No. - 165)
13.1 Discussion Guide
13.2 Company Developments
13.2.1 Expansions
13.2.2 Acquisitions
13.3 Introducing RT: Real Time Market Intelligence
13.4 Available Customizations
13.5 Related Reports
List of Tables (122 Tables)
Table 1 Non-Protein Nitrogen Sources for Ruminant Feed
Table 2 Commercial Feed Containing Any Added Non-Protein Nitrogen Shall Be Labeled as Follows:
Table 3 European Communities (Protein Feeding Stuffs) (Amendment) Regulations, 1996
Table 4 Feed Non-Protein Nitrogen Market Size, By Type, 2013-2020 (USD Million)
Table 5 Feed Non-Protein Nitrogen Market Size, By Type, 2013-2020 (KT)
Table 6 Recommendations By Stanton and Whittier for Feeding Urea
Table 7 Urea Feed Non-Protein Nitrogen Market Size, By Region, 2013-2020 (USD Million)
Table 8 Urea Feed Non-Protein Nitrogen Market Size, By Region, 2013-2020 (KT)
Table 9 Urea Feed Non-Protein Nitrogen Market Size, By Type, 2013-2020 (USD Million)
Table 10 Urea Feed Non-Protein Nitrogen Market Size, By Type, 2013-2020 (KT)
Table 11 Conversion Rate of Nitrogen Or Protein to Ammonia-N in the Rumen
Table 12 Ammonia Feed Non-Protein Nitrogen Market Size, By Region, 2013-2020 (USD Million)
Table 13 Ammonia Feed Non-Protein Nitrogen Market Size, By Region, 2013-2020 (KT)
Table 14 Suggested Guidelines for the Use of Biuret in Forms of Manufactured Ruminant Feeds
Table 15 Other Feed Non-Protein Nitrogen Market Size, By Region, 2013-2020 (USD Million)
Table 16 Other Feed Non-Protein Nitrogen Market Size, By Region, 2013-2020 (KT)
Table 17 Feed Non-Protein Nitrogen Market Size, By Form, 2013�2020 (USD Million)
Table 18 Feed Non-Protein Nitrogen Market Size, By Form, 2013�2020 (KT)
Table 19 Dry Feed Non-Protein Nitrogen Market Size, By Region, 2013�2020, (USD Million)
Table 20 Dry Feed Non-Protein Nitrogen Market Size, By Region, 2013�2020 (KT)
Table 21 Benefits of Using Liquid Forms of Feed Non-Protein Nitrogen Compounds
Table 22 Liquid Feed Non-Protein Nitrogen Market Size, By Region, 2013�2020 (USD Million)
Table 23 Liquid Feed Non-Protein Nitrogen Market Size, By Region, 2013�2020 (KT)
Table 24 Pellet Feed Non-Protein Nitrogen Market Size, By Region, 2013�2020 (USD Million)
Table 25 Pellet Feed Non-Protein Nitrogen Market Size, By Region, 2013�2020,(KT)
Table 26 Feed Non-Protein Nitrogen Market Size, By Livestock, 2013�2020 (USD Million)
Table 27 Feed Non-Protein Nitrogen Market Size, By Livestock, 2013�2020 (KT)
Table 28 Non-Protein Nitrogen in Beef Cattle Feed Market Size, By Region, 2013�2020 (USD Million)
Table 29 Non-Protein Nitrogen in Beef Cattle Feed Market Size, By Region, 2013�2020 (KT)
Table 30 Non-Protein Nitrogen in Dairy Cattle Feed Market Size, By Region, 2013�2020 (USD Million)
Table 31 Non-Protein Nitrogen in Dairy Cattle Feed Market Size, By Region, 2013�2020 (KT)
Table 32 Non-Protein Nitrogen in Sheep & Goat Feed Market Size, By Region, 2013�2020 (USD Million)
Table 33 Non-Protein Nitrogen in Sheep & Goat Feed Market Size, By Region, 2013�2020 (KT)
Table 34 Non-Protein Nitrogen in Other Livestock Feed Market Size, By Region, 2013�2020 (USD Million)
Table 35 Non-Protein Nitrogen in Other Livestock Feed Market Size, By Region, 2013�2020 (KT)
Table 36 Feed Non-Protein Nitrogen Market Size, By Region, 2013-2020 (USD Million)
Table 37 Feed Non-Protein Nitrogen Market Size, By Region, 2013-2020 (KT)
Table 38 North America: Feed Non-Protein Nitrogen Market Size, By Country, 2013-2020 (USD Million)
Table 39 North America: Feed Non-Protein Nitrogen Market Size, By Country, 2013-2020 (KT)
Table 40 North America: Feed Non-Protein Nitrogen Market Size, By Type, 2013-2020 (USD Million)
Table 41 North America: Feed Non-Protein Nitrogen Market Size, By Type, 2013-2020 (KT)
Table 42 North America: Feed Non-Protein Nitrogen Market Size, By Form, 2013-2020 (USD Million)
Table 43 North America: Feed Non-Protein Nitrogen Market Size, By Form, 2013-2020 (KT)
Table 44 North America: Feed Non-Protein Nitrogen Market Size, By Livestock, 2013-2020 (USD Million)
Table 45 North America: Feed Non-Protein Nitrogen Market Size, By Livestock, 2013-2020 (KT)
Table 46 U.S.: Feed Non-Protein Nitrogen Market Size, By Type, 2013�2020 (USD Million)
Table 47 U.S.: Feed Non-Protein Nitrogen Market Size, By Type, 2013�2020 (KT)
Table 48 Canada: Feed Non-Protein Nitrogen Market Size, By Type, 2013�2020 (USD Million)
Table 49 Canada: Feed Non-Protein Nitrogen Market Size, By Type, 2013�2020 (KT)
Table 50 Mexico: Feed Non-Protein Nitrogen Market Size, By Type, 2013�2020 (USD Million)
Table 51 Mexico: Feed Non-Protein Nitrogen Market Size, By Type, 2013�2020 (KT)
Table 52 Europe: Feed Non-Protein Nitrogen Market Size, By Country, 2013-2020 (USD Million)
Table 53 Europe: Feed Non-Protein Nitrogen Market Size, By Country, 2013-2020 (KT)
Table 54 Europe: Feed Non-Protein Nitrogen Market Size, By Type, 2013-2020 (USD Million)
Table 55 Europe: Feed Non-Protein Nitrogen Market Size, By Type, 2013-2020 (KT)
Table 56 Europe: Feed Non-Protein Nitrogen Market Size, By Form, 2013-2020 (USD Million)
Table 57 Europe: Feed Non-Protein Nitrogen Market Size, By Form, 2013-2020 (KT)
Table 58 Europe: Feed Non-Protein Nitrogen Market Size, By Livestock, 2013-2020 (USD Million)
Table 59 Europe: Feed Non-Protein Nitrogen Market Size, By Livestock, 2013-2020 (KT)
Table 60 Germany: Feed Non-Protein Nitrogen Market Size, By Type, 2013�2020 (USD Million)
Table 61 Germany: Feed Non-Protein Nitrogen Market Size, By Type, 2013�2020 (KT)
Table 62 U.K.: Feed Non-Protein Nitrogen Market Size, By Type, 2013�2020 (USD Million)
Table 63 U.K.: Feed Non-Protein Nitrogen Market Size, By Type, 2013�2020 (KT)
Table 64 Spain: Feed Non-Protein Nitrogen Market Size, By Type, 2013�2020 (USD Million)
Table 65 Spain: Feed Non-Protein Nitrogen Market Size, By Type, 2013�2020 (KT)
Table 66 France: Feed Non-Protein Nitrogen Market Size, By Type, 2013�2020 (USD Million)
Table 67 France: Feed Non-Protein Nitrogen Market Size, By Type, 2013�2020 (KT)
Table 68 Poland: Feed Non-Protein Nitrogen Market Size, By Type, 2013�2020 (USD Million)
Table 69 Poland: Feed Non-Protein Nitrogen Market Size, By Type, 2013�2020 (KT)
Table 70 Rest of Europe: Feed Non-Protein Nitrogen Market Size, By Type, 2013�2020 (USD Million)
Table 71 Rest of Europe: Feed Non-Protein Nitrogen Market Size, By Type, 2013�2020 (KT)
Table 72 Asia-Pacific: Feed Non-Protein Nitrogen Market Size, By Country, 2013�2020 (USD Million)
Table 73 Asia-Pacific: Feed Non-Protein Nitrogen Market Size, By Country, 2013�2020 (KT)
Table 74 Asia-Pacific: Feed Non-Protein Nitrogen Market Size, By Type, 2013�2020 (USD Million)
Table 75 Asia-Pacific: Feed Non-Protein Nitrogen Market Size, By Type, 2013�2020 (KT)
Table 76 Asia-Pacific: Feed Non-Protein Nitrogen Market Size, By Form, 2013-2020 (USD Million)
Table 77 Asia-Pacific: Feed Non-Protein Nitrogen Market Size, By Form, 2013-2020 (KT)
Table 78 Asia-Pacific: Feed Non-Protein Nitrogen Market Size, By Livestock, 2013-2020 (USD Million)
Table 79 Asia-Pacific: Feed Non-Protein Nitrogen Market Size, By Livestock, 2013-2020 (KT)
Table 80 China: Feed Non-Protein Nitrogen Market Size, By Type, 2013�2020 (USD Million)
Table 81 China: Feed Non-Protein Nitrogen Market Size, By Type, 2013�2020 (KT)
Table 82 India: Feed Non-Protein Nitrogen Market Size, By Type, 2013�2020 (USD Million)
Table 83 India: Feed Non-Protein Nitrogen Market Size, By Type, 2013�2020 (KT)
Table 84 Japan: Feed Non-Protein Nitrogen Market Size, By Type, 2013�2020 (USD Million)
Table 85 Japan: Feed Non-Protein Nitrogen Market Size, By Type, 2013�2020 (KT)
Table 86 Australia: Feed Non-Protein Nitrogen Market Size, By Type, 2013�2020 (USD Million)
Table 87 Australia: Feed Non-Protein Nitrogen Market Size, By Type, 2013�2020 (KT)
Table 88 Rest of Asia-Pacific: Feed Non-Protein Nitrogen Market Size, By Type, 2013�2020 (USD Million)
Table 89 Rest of Asia-Pacific: Feed Non-Protein Nitrogen Market Size, By Type, 2013�2020 (KT)
Table 90 Latin America: Feed Non-Protein Nitrogen Market Size, By Country, 2013-2020 (USD Million)
Table 91 Latin America: Feed Non-Protein Nitrogen Market Size, By Country, 2013-2020 (KT)
Table 92 Latin America: Feed Non-Protein Nitrogen Market Size, By Type, 2013-2020 (USD Million)
Table 93 Latin America: Feed Non-Protein Nitrogen Market Size, By Type, 2013-2020 (KT)
Table 94 Latin America: Feed Non-Protein Nitrogen Market Size, By Form, 2013-2020 (USD Million)
Table 95 Latin America: Feed Non-Protein Nitrogen Market Size, By Form, 2013-2020 (KT)
Table 96 Latin America: Feed Non-Protein Nitrogen Market Size, By Livestock, 2013-2020 (USD Million)
Table 97 Latin America: Feed Non-Protein Nitrogen Market Size, By Livestock, 2013-2020 (KT)
Table 98 Brazil: Feed Non-Protein Nitrogen Market Size, By Type, 2013�2020(USD Million)
Table 99 Brazil: Feed Non-Protein Nitrogen Market Size, By Type, 2013�2020 (KT)
Table 100 Argentina: Feed Non-Protein Nitrogen Market Size, By Type, 2013�2020 (USD Million)
Table 101 Argentina: Feed Non-Protein Nitrogen Market Size, By Type, 2013�2020 (KT)
Table 102 Rest of Latin America: Feed Non-Protein Nitrogen Market Size, By Type, 2013�2020 (USD Million)
Table 103 Rest of Latin America: Feed Non-Protein Nitrogen Market Size, By Type, 2012�2019 (KT)
Table 104 RoW: Feed Non-Protein Nitrogen Market Size, By Region, 2013�2020 (USD Million)
Table 105 RoW: Feed Non-Protein Nitrogen Market Size, By Country, 2013�2020 (KT)
Table 106 RoW: Feed Non-Protein Nitrogen Market Size, By Type, 2013�2020 (USD Million)
Table 107 RoW: Feed Non-Protein Nitrogen Market Size, By Type, 2013�2020 (KT)
Table 108 RoW: Feed Non-Protein Nitrogen Market Size, By Form, 2013-2020 (USD Million)
Table 109 RoW: Feed Non-Protein Nitrogen Market Size, By Form, 2013-2020 (KT)
Table 110 RoW: Feed Non-Protein Nitrogen Market Size, By Livestock, 2013-2020 (USD Million)
Table 111 RoW: Feed Non-Protein Nitrogen Market Size, By Livestock, 2013-2020 (KT)
Table 112 Africa: Feed Non-Protein Nitrogen Market Size, By Type, 2013�2020(USD Million)
Table 113 Africa: Feed Non-Protein Nitrogen Market Size, By Type, 2012�2019 (KT)
Table 114 Middle East: Feed Non-Protein Nitrogen Market Size, By Type, 2013�2020 (USD Million)
Table 115 Middle East: Feed Non-Protein Nitrogen Market Size, By Type, 2013�2020 (KT)
Table 116 New Product Launches, 2011�2015
Table 117 Expansions, 2011�2015
Table 118 Acquisitions, 2010�2015
Table 119 Dyno Nobel: Products & Their Description
Table 120 Incitec Pivot Fertilizers: Product & Its Description
Table 121 Expansions, 2010�2015
Table 122 Acquisitions, 2010�2015
List of Figures (62 Figures)
Figure 1 Feed Non-Protein Nitrogen Market Segmentation
Figure 2 Feed Non-Protein Nitrogen Market: Research Design
Figure 3 Global Feed Additive Market: Projected to Reach ~21.8 Billion By 2020
Figure 4 Increasing Urea Demand, 2013�2020 (USD Million)
Figure 5 Price for Cottonseed Meal, 2008�2014 (USD Per Ton)
Figure 6 Global Urea Price, 2000�2014 (USD/MT)
Figure 7 Average Ammonia Price in the U.S., 2008�2014 (USD/Ton)
Figure 8 Market Size Estimation Methodology: Bottom-Up Approach
Figure 9 Market Size Estimation Methodology: Top-Down Approach
Figure 10 Data Triangulation Methodology
Figure 11 Limitations of the Research Study
Figure 12 Feed Non-Protein Nitrogen Market, By Type, 2015 vs 2020 (USD Million)
Figure 13 Feed Non-Protein Nitrogen Market, By Form, 2015 vs 2020 (USD Million)
Figure 14 Feed Non-Protein Nitrogen Market, By Livestock, 2015 vs 2020 (USD Million)
Figure 15 Feed Non-Protein Nitrogen Market Trend, By Region, 2013-2019
Figure 16 Top Five Markets, By Country, 2015 vs 2020 (USD Million)
Figure 17 Asia-Pacific Projected to Be the Fastest-Growing Market From 2015 to 2020
Figure 18 Urea Segment Projected to Be the Largest Segment in 2020
Figure 19 Dry Segment Projected to Be the Largest Market By 2020
Figure 20 Essential Beef Segment Would Be the Largest Market During the Forecast Period
Figure 21 Beef Cattle Segment Accounted for Largest Share in the Asia-Pacific Feed Non-Protein Nitrogen Market in 2014
Figure 22 China Dominated the Global Feed Non-Protein Nitrogen Market
Figure 23 Feed Non-Protein Nitrogen Market in Asia-Pacific is Experiencing High Growth
Figure 24 Evolution of Feed Non-Protein Nitrogen
Figure 25 Feed Non-Protein Nitrogen Market Segmentation
Figure 26 Feed Non-Protein Nitrogen Market, By Type
Figure 27 Feed Non-Protein Nitrogen Market, By Form
Figure 28 Feed Non-Protein Nitrogen Market, By Livestock
Figure 29 Feed Non-Protein Nitrogen Market Dynamics
Figure 30 Annual Per Capita Milk Consumption, 2001-2007 (Kg)
Figure 31 Global Annual Per Capita Consumption of Milk & Dairy Products and Meat, 1964-2030
Figure 32 Global Increase in Cattle Population (Million)
Figure 33 Urea Prices vs Prices of Other Protein-Sources for Feed, 2000�2014 (USD/Metric Ton)
Figure 34 Feed Non-Protein Nitrogen: Value Chain
Figure 35 Feed Non-Protein Nitrogen: Supply Chain
Figure 36 Porter�s Five Forces Analysis: Feed Non-Protein Nitrogen Market
Figure 37 Feed Non-Protein Nitrogen Market Size, By Type, 2014: A Snapshot
Figure 38 Urea Feed Non-Protein Nitrogen to Be the Largest By 2020
Figure 39 Feed Non-Protein Nitrogen Market Size, By Livestock, 2015 vs 2020: A Snapshot
Figure 40 Geographic Snapshot (2015-2020): India, Australia, and Brazil Emerging as New Hot Spots
Figure 41 North American Feed Non-Protein Nitrogen Market: A Snapshot
Figure 42 European Feed Non-Protein Nitrogen Market: A Snapshot
Figure 43 Asia-Pacific Feed Non-Protein Nitrogen Market: A Snapshot
Figure 44 Companies Adopted Acquisitions as Their Key Growth Strategies From 2010 to 2015
Figure 45 Feed Non-Protein Nitrogen Market Share, By Key Player, January 2010 to December 2015
Figure 46 Key Growth Strategies in the Global Feed Non-Protein Nitrogen Market, 2010�2015
Figure 47 Most Active Developments Between 2010 and 2015
Figure 48 Expansions & Acquisitions Fueled the Growth of the Feed Non-Protein Nitrogen Market Between 2011 and 2015
Figure 49 Geographic Revenue Mix of Top Five Market Players
Figure 50 Archer Daniels Midland Company: Company Snapshot
Figure 51 Archer Daniels Midland Company: SWOT Analysis
Figure 52 Yara International ASA: Company Snapshot
Figure 53 Yara International ASA : SWOT Analysis
Figure 54 Borealis AG: Company Snapshot
Figure 55 Borealis AG: SWOT Analysis
Figure 56 Incitec Pivot Limited: Company Snapshot
Figure 57 Incitec Pivot Limited: SWOT Analysis
Figure 58 Potashcorp: Company Snapshot
Figure 59 Potashcorp: SWOT Analysis
Figure 60 Petroleo Brasileiro S.A.: Company Snapshot
Figure 61 Petroleo Brasileiro S.A.: SWOT Analysis
Figure 62 Fertiberia SA: Company Snapshot


Growth opportunities and latent adjacency in Non-Protein Nitrogen Market