Non-thermal Pasteurization Market

Non-thermal Pasteurization Market Size, Share, Industry Growth Analysis, Trends Report by Technique (HPP, PEF, MVH, Ultrasonic, Irradiation, and Other Techniques), Form (Solid, Liquid), Application (Food, Beverage, and Pharmaceutical & Cosmetics) & Region - Global Forecast to 2028

Report Code: FB 6858 Apr, 2023, by marketsandmarkets.com

Non-Thermal Pasteurization Market Size, Share Report, 2028

The global non-thermal pasteurization market size was estimated at USD 2.3 billion in 2023 and is projected to grow at a CAGR of 20.0% from 2023-2028, to reach USD 5.7 billion by 2028. The growing consumption of protein-based food products, frozen meat, and fruits & vegetables, and the growing preference for healthy food products in developed countries drive the demand for higher food production. The growth in demand for various food products will, in turn, drive the demand for non-thermal pasteurization food processing equipment.

Non-thermal pasteurization Market

To know about the assumptions considered for the study, Request for Free Sample Report

Non-Thermal Pasteurization Market Dynamics

Driver: Rise in the demands for Meat, Poultry and dairy food

Meat, poultry, and dairy products are some of the major applications of food & beverage processing equipment. The growing consumption of protein-based food products, frozen meat, and fruits & vegetables, and the growing preference for healthy food products in developed countries drive the demand for higher food production. The growth in demand for various food products will, in turn, drive the demand for non-thermal pasteurization food processing equipment. The demand for non-thermal pasteurization methods has been on the rise due to the increasing demand for meat, poultry, and dairy products. According to the United States Department of Agriculture (USDA), the production of red meat and poultry in the United States has steadily increased over the past decade. Additionally, in the dairy industry, the demand for various equipment for a range of applications drives the non thermal pasteurization market growth.

Restraint : Requirement of high capital investments

High capital investment is one of the major restraints for the non-thermal pasteurization market. Non-thermal pasteurization technologies, such as high-pressure processing (HPP), pulsed electric field (PEF), and ultraviolet (UV) radiation, require significant investments in equipment and infrastructure, which can be a barrier for small and medium-sized food and beverage manufacturers. For example, HPP equipment typically involves high-pressure vessels, pumps, and control systems, which can cost millions of dollars. Similarly, PEF systems require specialized electrical equipment and generators, which can also be expensive. In addition to the initial capital investment, ongoing maintenance and operational costs for these technologies can also be significant. The high capital costs associated with non-thermal pasteurization technologies can be a particular challenge for smaller food and beverage companies that may not have the financial resources to invest in this type of equipment

Opportunity: Increase in the government support in food processing machinery and equipments.

Non-thermal pasteurization Market Opportunities

To know about the assumptions considered for the study, download the pdf brochure

The food processing machinery & equipment market is growing rapidly worldwide due to the rise in demand for food & beverage products among the consumers. The governments of the US, the UK, Japan, China, and other countries are increasingly investing in developing the existing food processing technology. As non-thermal pasteurization technology helps to reduce microorganisms and extend shelf life in food & beverage products, government investment in enhancing technology enables manufacturers to provide better quality products. The center will be based in the Northwest of England and will provide access to cutting-edge equipment and expertise for food and drink companies across the UK. The goal of the investment is to help the UK food and drink industry become more sustainable and globally competitive by adopting innovative technologies, such as non-thermal pasteurization, to improve food safety and quality.

Challenge: Limited technical experts

One of the main challenges for the non-thermal pasteurization market is the requirement for technical expertise to design and implement these processes. Unlike thermal pasteurization, which has been used for many years and is well-established in the food industry, non-thermal pasteurization methods are still relatively new and require specialized knowledge to optimize the process parameters for each product. the regulatory landscape for non-thermal pasteurization is still evolving, and there may be additional technical requirements for obtaining regulatory approval for these methods. For example, the U.S. Food and Drug Administration (FDA) has established guidelines for the use of HPP and PEF, but additional testing and validation may be required for new products or applications.

Key Trends in the Global Non-Thermal Pasteurization Market

  • Rising Demand for Food Safety: With increasing concerns about foodborne illnesses and contamination, there is a growing demand for non-thermal pasteurization methods that can effectively eliminate pathogens while preserving the sensory and nutritional qualities of food products.
  • Preference for Minimal Processing: Consumers are increasingly seeking minimally processed foods that retain their natural flavors, textures, and nutritional value. Non-thermal pasteurization methods such as high-pressure processing (HPP), pulsed electric field (PEF), and ultraviolet (UV) irradiation are gaining popularity as they allow for gentle treatment of foods without the use of heat.
  • Expansion of Clean Label and Natural Foods: As consumers become more health-conscious and concerned about the ingredients in their food products, there is a growing demand for clean label and natural foods. Non-thermal pasteurization methods align with this trend by offering a chemical-free approach to food preservation.
  • Technological Advancements: Continuous technological advancements are driving innovation in non-thermal pasteurization techniques, leading to improvements in efficiency, scalability, and cost-effectiveness. These advancements are expanding the application of non-thermal pasteurization methods to a wider range of food products.
  • Regulatory Support and Standards: Regulatory bodies around the world are increasingly recognizing non-thermal pasteurization methods as effective means of ensuring food safety. This has led to the development of regulations and standards that support the adoption of these technologies by food manufacturers.
  • Focus on Sustainability: Non-thermal pasteurization methods typically have lower energy requirements compared to traditional thermal pasteurization techniques, making them more environmentally sustainable. As sustainability becomes a key consideration for consumers and businesses alike, non-thermal pasteurization methods are gaining traction in the food industry.
  • Application in Emerging Markets: Non-thermal pasteurization methods are finding applications in emerging markets where there is a growing demand for safe and convenient food products. These methods offer opportunities for food manufacturers to meet the needs of consumers in these regions while also complying with local regulations.
  • Partnerships and Collaborations: Collaboration between technology providers, food manufacturers, research institutions, and regulatory bodies is driving innovation and adoption of non-thermal pasteurization methods. Partnerships help to accelerate the development and commercialization of new technologies while also ensuring compliance with regulatory requirements.

Non-Thermal Pasteurization Market Ecosystem

Prominent companies in this market include well-established, financially stable manufacturers of non-thermal pasteurization. These companies have been operating in the market for several years and possess a diversified product portfolio, state-of-the-art technologies, and strong global sales and marketing networks. Prominent companies in this market include JBT Corporation (US), Hiperbaric (Spain), Thyssenkrupp AG (Germany), Kobelco Construction Machinery Ltd. (Japan), Lyras (Denmark), Syntegon (Germany), Multivac (Germany), Stansted Fluid Power Ltd. (UK), Pulsemaster (Netherlands), Elea (Germany), Symbios Technologies (US), Clextral (France), Dukane (US), FresherTech (China) and Nordion (Canada).

Non-thermal pasteurization Market Ecosystem

Non-Thermal Pasteurization Market Segment Insights:

Adoption of ready to eat food is projected to drive the demand for non-thermal pasteurization market

The busy lifestyle of modern consumers and the growing geriatric population are driving the demand for ready meals, which are convenient, easy-to-prepare, and require minimal cooking time. This has led to a rise in demand for non-thermal pasteurization methods that can produce safer ready meals with longer shelf life, while also retaining the nutritional value and quality of the product.

The rise in demand for ready meals is driven by changing lifestyles and consumer preferences for convenient and easy-to-prepare food options. To meet this demand, many companies in the food industry are investing in non-thermal pasteurization methods.

Use High pressure processing techniques in the beverage industry expected to boost the market growth

High-pressure processing (HPP) is also known as high hydrostatic pressure (HHP) or ultra-high pressure (UHP). It is a non-thermal food processing technology applied when the food is subjected to high hydrostatic pressure, normally at or above 100 MPa. HPP has been established to inactivate microorganisms and denature several enzymes without the degradation of flavor and nutritional profile. Horizontal HPP machines have a conveyor belt that moves the product through the pressure chamber horizontally. This type of machine is suitable for processing products with a low viscosity, such as juices and sauces, as they can easily flow through the machine. Horizontal HPP machines are also ideal for processing large volumes of product at a time. Vertical HPP machines have a pressure vessel that moves the product through the chamber vertically. This type of machine is suitable for processing products with a higher viscosity, such as meat and dairy products.

Non-Thermal Pasteurization Market Regional Insights:

North America is expected to drive the market during the forecast period due increase in the demand for healthier food

The non-thermal pasteurization market in Mexico has been growing in recent years, driven by increased consumer demand for fresh and minimally processed food products, as well as by regulatory changes aimed at promoting food safety. the Mexican government has implemented regulations to ensure the safety of non-thermal pasteurization techniques. In 2020, the National Service of Agri-Food Health, Safety, and Quality (SENASICA) updated the regulations on food additives and processing aids, which included provisions for the use of non-thermal pasteurization techniques.

The non thermal pasteurization market in Mexico is growing, driven by consumer demand for healthier and safer food options, as well as government initiatives to promote the use of non-thermal techniques in the food industry. The use of HPP, PEF, UV radiation, and other non-thermal methods is becoming more widespread in Mexico, as evidenced by recent partnerships and regulatory updates.

Non-thermal pasteurization Market by Region

Non-Thermal Pasteurization Market Key Players

The key players in this market include JBT Corporation (US), Hiperbaric (Spain), Thyssenkrupp AG (Germany), Kobelco Construction Machinery Ltd. (Japan), Lyras (Denmark), Syntegon (Germany), Multivac (Germany), Stansted Fluid Power Ltd. (UK), Pulsemaster (Netherlands), Elea (Germany), Symbios Technologies (US), Clextral (France), Dukane (US), FresherTech (China) and Nordion (Canada).

Non Thermal Pasteurization Market Report Scope

Report Metric

Details

Market size valuation in 2023

USD 2.3 billion

Market size forecast in 2028

USD 5.7 billion

Growth rate

CAGR of 20.0%

Units considered

Value (USD), Volume (KT)

Segments covered

Application, Form, Technique, Region

Regions covered

North America, Europe, Asia Pacific, and RoW

Companies studied

  • JBT Corporation (US),
  • Hiperbaric (Spain),
  • Thyssenkrupp AG (Germany),
  • Kobelco Construction Machinery Ltd. (Japan),
  • Lyras (Denmark), Syntegon (Germany),
  • Multivac (Germany),
  • Stansted Fluid Power Ltd. (UK),
  • Pulsemaster (Netherlands),
  • Elea (Germany),
  • Symbios Technologies (US),
  • Clextral (France),
  • Dukane (US),
  • FresherTech (China)
  • Nordion (Canada).

Non-Thermal Pasteurization Market Report Segmentation:

Aspect

Details

By Application

  • Food
  • Beverages

By Form

  • Solid
  • Liquid

By Technique

  • High Pressure processing
  • By orientation type
  • By vessel volume
  • Pulse electric field
  • Microwave volumetric heating
  • Ultrasonic
  • Irradiation
  • Other techniques

By Region

  • North America
  • Europe
  • Asia Pacific
  • South America
  • RoW

Frequently Asked Questions (FAQ):

To speak to our analyst for a discussion on the above findings, click Speak to Analyst

TABLE OF CONTENTS
 
1 INTRODUCTION (Page No. - 37)
    1.1 STUDY OBJECTIVES 
    1.2 NON-THERMAL PASTEURIZATION MARKET DEFINITION 
    1.3 STUDY SCOPE 
           FIGURE 1 NON THERMAL PASTEURIZATION MARKET SEGMENTATION
    1.4 REGIONS COVERED 
    1.5 YEARS CONSIDERED 
    1.6 CURRENCY CONSIDERED 
           TABLE 1 USD EXCHANGE RATES CONSIDERED, 2017–2022
    1.7 STAKEHOLDERS 
    1.8 SUMMARY OF CHANGES 
    1.9 RECESSION IMPACT ANALYSIS 
 
2 RESEARCH METHODOLOGY (Page No. - 42)
    2.1 RESEARCH DATA 
           FIGURE 2 MARKET: RESEARCH DESIGN
           2.1.1 SECONDARY DATA
                    2.1.1.1 Key data from secondary sources
           2.1.2 PRIMARY DATA
                    2.1.2.1 Breakdown of primaries
    2.2 MARKET SIZE ESTIMATION 
           2.2.1 MARKET SIZE ESTIMATION: METHOD 1 (SUPPLY SIDE)
           2.2.2 MARKET SIZE ESTIMATION: METHOD 2 (DEMAND SIDE)
           2.2.3 NON-THERMAL PASTEURIZATION MARKET SIZE ESTIMATION NOTES
    2.3 DATA TRIANGULATION 
           FIGURE 3 DATA TRIANGULATION METHODOLOGY
    2.4 RECESSION IMPACT ANALYSIS 
    2.5 ASSUMPTIONS 
    2.6 RESEARCH LIMITATIONS AND ASSOCIATED RISKS 
 
3 EXECUTIVE SUMMARY (Page No. - 50)
    TABLE 2 MARKET SHARE SNAPSHOT, 2023 VS. 2028 (USD MILLION) 
    FIGURE 4 MARKET, BY TECHNIQUE, 2023 VS. 2028 (USD MILLION) 
    FIGURE 5 MARKET, BY FORM, 2023 VS. 2028 (USD MILLION) 
    FIGURE 6 MARKET, BY APPLICATION, 2023 VS. 2028 (USD MILLION) 
    FIGURE 7 MARKET SHARE AND GROWTH RATE (VALUE), BY REGION, 2023 
 
4 PREMIUM INSIGHTS (Page No. - 54)
    4.1 OPPORTUNITIES IN NON THERMAL PASTEURIZATION MARKET 
           FIGURE 8 RISING TREND OF READY-TO-EAT FOOD TO DRIVE GROWTH OF THE  MARKET
    4.2 MARKET, BY FOOD SUB-APPLICATION 
           FIGURE 9 FRUITS & VEGETABLES ESTIMATED TO DOMINATE MARKET DURING  FORECAST PERIOD
    4.3 MARKET, BY BEVERAGE SUB-APPLICATION 
           FIGURE 10 NON-ALCOHOLIC BEVERAGES ESTIMATED TO DOMINATE MARKET DURING FORECAST PERIOD
    4.4 NORTH AMERICA: MARKET, BY KEY COUNTRY AND FORM 
           FIGURE 11 SOLID SEGMENT TO BE KEY FORM OF NON-THERMAL PASTEURIZATION IN NORTH AMERICA IN 2023
    4.5 MARKET, BY TECHNIQUE 
           FIGURE 12 HIGH-PRESSURE PASTEURIZATION TO ACCOUNT FOR LARGEST SHARE, 2023 VS. 2028 (VALUE)
    4.6 NON-THERMAL PASTEURIZATION MARKET: MAJOR REGIONAL SUBMARKETS 
           FIGURE 13 US ACCOUNTED FOR LARGEST MARKET SHARE IN 2022
 
5 MARKET OVERVIEW (Page No. - 57)
    5.1 INTRODUCTION 
    5.2 MARKET DYNAMICS 
           FIGURE 14 NON THERMAL PASTEURIZATION MARKET DYNAMICS
           5.2.1 DRIVERS
                    5.2.1.1 Increase in consumption of convenience foods
                    5.2.1.2 Increase in demand for meat, poultry, and dairy products
                    5.2.1.3 Process optimization by non-thermal technologies resulting in greater efficiency during pasteurization
                    5.2.1.4 Rising demand for innovative food & beverage products due to changing consumer trends
           5.2.2 RESTRAINTS
                    5.2.2.1 High capital investment
                    5.2.2.2 Growing demand for organic and fresh food products
                    5.2.2.3 Implementation of extra regulatory measures for labeling irradiated food
           5.2.3 OPPORTUNITIES
                    5.2.3.1 Government investment in food processing machinery & equipment
                    5.2.3.2 Growing usage of High-pressure Processing (HPP) toll processors
           5.2.4 CHALLENGES
                    5.2.4.1 Lack of consumer awareness
                    5.2.4.2 Need for technical expertise
 
6 INDUSTRY TRENDS (Page No. - 64)
    6.1 INTRODUCTION 
    6.2 VALUE CHAIN ANALYSIS 
           FIGURE 15 VALUE CHAIN OF NON-THERMAL PASTEURIZATION MARKET
    6.3 TRENDS/DISRUPTIONS IMPACTING CUSTOMERS’ BUSINESSES 
           6.3.1 REVENUE SHIFT AND NEW REVENUE POCKETS IN THE MARKET
                    FIGURE 16 REVENUE SHIFT IMPACTING TRENDS/DISRUPTIONS IN MARKET
    6.4 TECHNOLOGICAL ANALYSIS 
           6.4.1 RADIO FREQUENCY (RF) HEATING
           6.4.2 COLD PLASMA TREATMENT
           6.4.3 OZONE TREATMENT
    6.5 PATENT ANALYSIS 
           FIGURE 17 NUMBER OF PATENTS GRANTED FOR NON-THERMAL PASTEURIZATION, 2012–2022
           FIGURE 18 REGIONAL ANALYSIS OF PATENTS GRANTED FOR NON-THERMAL PASTEURIZATION, 2012-2022
           TABLE 3 LIST OF IMPORTANT PATENTS FOR NON-THERMAL PASTEURIZATION, 2022
    6.6 MARKET MAP AND ECOSYSTEM OF NON-THERMAL PASTEURIZATION 
           6.6.1 DEMAND SIDE
           6.6.2 SUPPLY SIDE
                    FIGURE 19 NON THERMAL PASTEURIZATION MARKET: ECOSYSTEM MAP
    6.7 KEY CONFERENCES AND EVENTS 
           TABLE 4 KEY CONFERENCES AND EVENTS IN NON-THERMAL PASTEURIZATION, 2023
    6.8 TARIFF AND REGULATORY LANDSCAPE 
           6.8.1 REGULATORY BODIES, GOVERNMENT AGENCIES, AND OTHER ORGANIZATIONS
                    TABLE 5 NORTH AMERICA: LIST OF REGULATORY BODIES, GOVERNMENT AGENCIES, AND OTHER ORGANIZATIONS
                    TABLE 6 EUROPE: LIST OF REGULATORY BODIES, GOVERNMENT AGENCIES, AND OTHER ORGANIZATIONS
                    TABLE 7 ASIA PACIFIC: LIST OF REGULATORY BODIES, GOVERNMENT AGENCIES, AND OTHER ORGANIZATIONS
                    TABLE 8 SOUTH AMERICA: LIST OF REGULATORY BODIES, GOVERNMENT AGENCIES, AND OTHER ORGANIZATIONS
                    TABLE 9 REST OF THE WORLD: LIST OF REGULATORY BODIES, GOVERNMENT AGENCIES, AND OTHER ORGANIZATIONS
    6.9 REGULATORY FRAMEWORK 
           6.9.1 INTRODUCTION
           6.9.2 EUROPEAN UNION
           6.9.3 NORTH AMERICA (US AND CANADA)
                    6.9.3.1 USFDA - US food and drug administration inspection guide
                    6.9.3.2 Canada
           6.9.4 ASIA PACIFIC (JAPAN AND CHINA)
    6.10 PORTER’S FIVE FORCES ANALYSIS 
           TABLE 10 NON-THERMAL PASTEURIZATION MARKET: PORTER’S FIVE FORCES ANALYSIS
           6.10.1 INTENSITY OF COMPETITIVE RIVALRY
           6.10.2 THREAT OF NEW ENTRANTS
           6.10.3 THREAT OF SUBSTITUTES
           6.10.4 BARGAINING POWER OF SUPPLIERS
           6.10.5 BARGAINING POWER OF BUYERS
    6.11 SUPPLY CHAIN ANALYSIS 
                    FIGURE 20 MARKET: SUPPLY CHAIN ANALYSIS
    6.12 KEY STAKEHOLDERS AND BUYING CRITERIA 
           6.12.1 KEY STAKEHOLDERS IN BUYING PROCESS
                    FIGURE 21 INFLUENCE OF STAKEHOLDERS ON BUYING PROCESS FOR TOP END USERS
                    TABLE 11 INFLUENCE OF STAKEHOLDERS ON BUYING PROCESS FOR TOP END USERS
           6.12.2 BUYING CRITERIA
                    FIGURE 22 KEY CRITERIA FOR SELECTING SUPPLIERS/VENDORS
                    TABLE 12 KEY CRITERIA FOR SELECTING SUPPLIERS/VENDORS
    6.13 TRADE ANALYSIS 
           6.13.1 EXPORT SCENARIO
                    FIGURE 23 BEVERAGE EXPORTS, BY KEY COUNTRY, 2017–2021 (USD THOUSAND)
           6.13.2 IMPORT SCENARIO
                    FIGURE 24 BEVERAGE IMPORTS, BY KEY COUNTRY, 2017–2021 (USD THOUSAND)
    6.14 CASE STUDIES 
           6.14.1 NUTRIFRESH SERVICES EXPANDED PRODUCT OFFERINGS AND ACHIEVED SUSTAINABILITY GOALS
                    TABLE 13 HIPERBARIC HELPED NUTRIFRESH SERVICES MEET GROWING DEMAND FOR ECO-FRIENDLY FOOD PRODUCTS WITH HPP TECHNOLOGY
           6.14.2 JUICEBOT INCREASED PRODUCTION AND EXPANDED PRODUCT OFFERINGS
                    TABLE 14 JBT CORPORATION HELPED JUICEBOT MEET DEMAND FOR HEALTHY BEVERAGES
    6.15 PRICING ANALYSIS 
           6.15.1 SELLING PRICE CHARGED BY COMPANIES IN TERMS OF TECHNIQUE
                    FIGURE 25 SELLING PRICE FOR NON-THERMAL PASTEURIZATION TYPES
                    TABLE 15 AVERAGE SELLING PRICE FOR TYPES, 2022 (USD/UNIT)
 
7 NON-THERMAL PASTEURIZATION MARKET, BY TECHNIQUE (Page No. - 85)
    7.1 INTRODUCTION 
           FIGURE 26 MARKET, BY TECHNIQUE, 2023 VS. 2028 (USD MILLION)
           TABLE 16 MARKET, BY TECHNIQUE, 2018–2022 (USD MILLION)
           TABLE 17 NON THERMAL PASTEURIZATION MARKET, BY TECHNIQUE, 2023–2028 (USD MILLION)
    7.2 HIGH-PRESSURE PROCESSING (HPP) 
           TABLE 18 HIGH-PRESSURE PROCESSING: MARKET, BY REGION, 2018–2022 (USD MILLION)
           TABLE 19 HIGH-PRESSURE PROCESSING: MARKET, BY REGION, 2023–2028 (USD MILLION)
           7.2.1 HIGH-PRESSURE PROCESSING MARKET, BY ORIENTATION TYPE
                    7.2.1.1 Beverage sector to drive demand for horizontal orientation type
           TABLE 20 HIGH-PRESSURE PROCESSING MARKET, BY ORIENTATION TYPE, 2018–2022 (USD MILLION)
           TABLE 21 HIGH-PRESSURE PROCESSING MARKET, BY ORIENTATION TYPE, 2023–2028 (USD MILLION)
           7.2.2 HIGH-PRESSURE PROCESSING MARKET, BY VESSEL VOLUME
                    7.2.2.1 Greater vessel volume to drive demand for high-pressure processing
                               TABLE 22 HIGH-PRESSURE PROCESSING MARKET, BY VESSEL VOLUME, 2018–2022 (USD MILLION)
                               TABLE 23 HIGH-PRESSURE PROCESSING MARKET, BY VESSEL VOLUME, 2023–2028 (USD MILLION)
    7.3 PULSE ELECTRIC FIELD (PEF) 
           7.3.1 RISING DEMAND FOR PROCESSED FOOD & BEVERAGES TO DRIVE GROWTH
                    TABLE 24 PULSE ELECTRIC FIELD: MARKET, BY REGION, 2018–2022 (USD MILLION)
                    TABLE 25 PULSE ELECTRIC FIELD: MARKET, BY REGION, 2023–2028 (USD MILLION)
    7.4 MICROWAVE VOLUMETRIC HEATING (MVH) 
           7.4.1 NEED FOR ENERGY-EFFICIENT AND SUSTAINABLE FOOD PROCESSING TECHNOLOGIES TO DRIVE MARKET
                    TABLE 26 MICROWAVE VOLUMETRIC HEATING (MVH): NON-THERMAL PASTEURIZATION MARKET, BY REGION, 2018–2022 (USD MILLION)
                    TABLE 27 MICROWAVE VOLUMETRIC HEATING (MVH): MARKET, BY REGION, 2023–2028 (USD MILLION)
    7.5 ULTRASONIC 
           7.5.1 SUPPORT OF GOVERNMENTS AND INVESTMENTS BY LEADING COMPANIES TO DRIVE GROWTH
                    TABLE 28 ULTRASONIC: MARKET, BY REGION, 2018–2022 (USD MILLION)
                    TABLE 29 ULTRASONIC: MARKET, BY REGION, 2023–2028 (USD MILLION)
    7.6 IRRADIATION 
           7.6.1 GOVERNMENT APPROVALS AND INITIATIVES EXPECTED TO CONTRIBUTE TO GROWTH
                    TABLE 30 IRRADIATION: MARKET, BY REGION, 2018–2022 (USD MILLION)
                    TABLE 31 IRRADIATION: MARKET, BY REGION, 2023–2028 (USD MILLION)
    7.7 OTHER TECHNIQUES 
           TABLE 32 OTHER TECHNIQUES: MARKET, BY REGION, 2018–2022 (USD MILLION)
           TABLE 33 OTHER TECHNIQUES: MARKET, BY REGION, 2023–2028 (USD MILLION)
 
8 NON THERMAL PASTEURIZATION MARKET, BY FORM (Page No. - 98)
    8.1 INTRODUCTION 
           FIGURE 27 MARKET, BY FORM, 2023 VS. 2028
           TABLE 34 NON THERMAL PASTEURIZATION MARKET, BY FORM, 2018–2022 (USD MILLION)
           TABLE 35 MARKET, BY FORM, 2023–2028 (USD MILLION)
    8.2 SOLID 
           8.2.1 PEF CONSIDERED UNSUITABLE FOR SOLID ITEMS
                    TABLE 36 SOLID: NON-THERMAL PASTEURIZATION: MARKET, BY REGION, 2018–2022 (USD MILLION)
                    TABLE 37 SOLID: MARKET, BY REGION, 2023–2028 (USD MILLION)
    8.3 LIQUID 
           8.3.1 HPP TO BE PRIMARILY USED FOR PROCESSING OF LIQUIDS
                    TABLE 38 LIQUID: NON-THERMAL PASTEURIZATION: MARKET, BY REGION, 2018–2022 (USD MILLION)
                    TABLE 39 LIQUID: MARKET, BY REGION, 2023–2028 (USD MILLION)
 
9 NON-THERMAL PASTEURIZATION MARKET, BY APPLICATION (Page No. - 103)
    9.1 INTRODUCTION 
           FIGURE 28 MARKET, BY APPLICATION, 2023 VS. 2028 (USD MILLION)
           TABLE 40 MARKET, BY APPLICATION, 2018–2022 (USD MILLION)
           TABLE 41 MARKET, BY APPLICATION, 2023–2028 (USD MILLION)
    9.2 FOOD 
           TABLE 42 MARKET, BY FOOD SUB-APPLICATION, 2018–2022 (USD MILLION)
           TABLE 43 MARKET, BY FOOD SUB-APPLICATION, 2023–2028 (USD MILLION)
           TABLE 44 FOOD: NON-THERMAL PASTEURIZATION: MARKET, BY REGION, 2018–2022 (USD MILLION)
           TABLE 45 FOOD: MARKET, BY REGION, 2023–2028 (USD MILLION)
           9.2.1 MEAT PRODUCTS
                    9.2.1.1 Growing demand for minimum processing of meat products to fuel growth
                               TABLE 46 MEAT PRODUCTS: NON THERMAL PASTEURIZATION MARKET, BY REGION, 2018–2022 (USD MILLION)
                               TABLE 47 MEAT PRODUCTS: MARKET, BY REGION, 2023–2028 (USD MILLION)
           9.2.2 FRUITS & VEGETABLES
                    9.2.2.1 Rising demand for high-quality, safe, and minimally processed food to drive market
                               TABLE 48 FRUITS & VEGETABLES: NON-THERMAL PASTEURIZATION: MARKET, BY REGION, 2018–2022 (USD MILLION)
                               TABLE 49 FRUITS & VEGETABLES: MARKET, BY REGION, 2023–2028 (USD MILLION)
           9.2.3 DAIRY PRODUCTS
                    9.2.3.1 Rising demand for nutritional dairy products to encourage producing safer foods at low expenses
                               TABLE 50 DAIRY PRODUCTS: NON-THERMAL PASTEURIZATION: MARKET, BY REGION, 2018–2022 (USD MILLION)
                               TABLE 51 DAIRY PRODUCTS: MARKET, BY REGION, 2023–2028 (USD MILLION)
           9.2.4 READY MEALS
                    9.2.4.1 Demand for ready meals to be driven by busy lifestyles and growing geriatric population
                               TABLE 52 READY MEALS: NON THERMAL PASTEURIZATION MARKET, BY REGION, 2018–2022 (USD MILLION)
                               TABLE 53 READY MEALS: MARKET, BY REGION, 2023–2028 (USD MILLION)
    9.3 BEVERAGES 
           TABLE 54 NON-THERMAL PASTEURIZATION MARKET, BY BEVERAGE SUB-APPLICATION, 2018–2022 (USD MILLION)
           TABLE 55 MARKET, BY BEVERAGE SUB-APPLICATION, 2023–2028 (USD MILLION)
           9.3.1 ALCOHOLIC BEVERAGES
                    TABLE 56 ALCOHOLIC BEVERAGES: NON THERMAL PASTEURIZATION MARKET, BY SUB-APPLICATION, 2018–2022 (USD MILLION)
                    TABLE 57 ALCOHOLIC BEVERAGES: MARKET, BY SUB-APPLICATION, 2023–2028 (USD MILLION)
                    9.3.1.1 Beer
                               9.3.1.1.1 Rising demand for high-quality and safe beer with extended shelf life to augment market growth
                               TABLE 58 BEER: NON-THERMAL PASTEURIZATION: MARKET, BY REGION, 2018–2022 (USD MILLION)
                               TABLE 59 BEER: MARKET, BY REGION, 2023–2028 (USD MILLION)
                    9.3.1.2 Wine
                               9.3.1.2.1 Growing demand for premium and artisanal wines to drive market growth
                               TABLE 60 WINE: NON-THERMAL PASTEURIZATION: MARKET, BY REGION, 2018–2022 (USD MILLION)
                               TABLE 61 WINE: MARKET, BY REGION, 2023–2028 (USD MILLION)
                    9.3.1.3 Other alcoholic beverages
                               TABLE 62 OTHER ALCOHOLIC BEVERAGES: NON THERMAL PASTEURIZATION MARKET, BY REGION, 2018–2022 (USD MILLION)
                               TABLE 63 OTHER ALCOHOLIC BEVERAGES: MARKET, BY REGION, 2023–2028 (USD MILLION)
           9.3.2 NON-ALCOHOLIC BEVERAGES
                    TABLE 64 NON-ALCOHOLIC BEVERAGES: NON-THERMAL PASTEURIZATION: MARKET, BY SUB-APPLICATION, 2018–2022 (USD MILLION)
                    TABLE 65 NON-ALCOHOLIC BEVERAGES: MARKET, BY SUB-APPLICATION, 2023–2028 (USD MILLION)
                    9.3.2.1 Juices
                               9.3.2.1.1 Rising demand for cold-pressed juices to create opportunities
                               TABLE 66 JUICES: NON-THERMAL PASTEURIZATION: MARKET, BY REGION, 2018–2022 (USD MILLION)
                               TABLE 67 JUICES: MARKET, BY REGION, 2023–2028 (USD MILLION)
                    9.3.2.2 Carbonated drinks
                               9.3.2.2.1 Non-thermal pasteurization to increase shelf life of carbonated beverages
                               TABLE 68 CARBONATED DRINKS: NON-THERMAL PASTEURIZATION MARKET, BY REGION, 2018–2022 (USD MILLION)
                               TABLE 69 CARBONATED DRINKS: MARKET, BY REGION, 2023–2028 (USD MILLION)
                    9.3.2.3 Other non-alcoholic beverage applications
                               TABLE 70 OTHER NON-ALCOHOLIC BEVERAGES: NON THERMAL PASTEURIZATION MARKET, BY REGION, 2018–2022 (USD MILLION)
                               TABLE 71 OTHER NON-ALCOHOLIC BEVERAGES: MARKET, BY REGION, 2023–2028 (USD MILLION)
    9.4 PHARMACEUTICALS & COSMETICS 
           9.4.1 GRADUAL GROWTH IN NOVEL TECHNOLOGIES TO DRIVE MARKET
                    TABLE 72 PHARMACEUTICALS AND COSMETICS: NON-THERMAL PASTEURIZATION: MARKET, BY REGION, 2018–2022 (USD MILLION)
                    TABLE 73 PHARMACEUTICALS AND COSMETICS: MARKET, BY REGION, 2023–2028 (USD MILLION)
 
10 NON THERMAL PASTEURIZATION MARKET, BY REGION (Page No. - 122)
     10.1 INTRODUCTION 
               FIGURE 29 MARKET, BY REGION, 2023 VS. 2028  (USD MILLION)
               FIGURE 30 CHINA TO BE FASTEST-GROWING COUNTRY-LEVEL MARKET FROM  2023 TO 2028
               TABLE 74 MARKET, BY REGION, 2018–2022 (USD MILLION)
               TABLE 75 MARKET, BY REGION, 2023–2028 (USD MILLION)
     10.2 RECESSION IMPACT ANALYSIS 
     10.3 RECESSION IMPACT ON THE MARKET 
             10.3.1 MACRO INDICATORS OF RECESSION
                       FIGURE 31 INDICATORS OF RECESSION
                       FIGURE 32 WORLD INFLATION RATE, 2011–2021
                       FIGURE 33 GLOBAL GDP, 2011–2021 (USD TRILLION)
                       FIGURE 34 RECESSION INDICATORS AND THEIR IMPACT ON NON-THERMAL PASTEURIZATION MARKET
                       FIGURE 35 MARKET: EARLIER FORECAST VS.  RECESSION FORECAST
     10.4 NORTH AMERICA 
               FIGURE 36 NORTH AMERICA: MARKET SNAPSHOT
               TABLE 76 NORTH AMERICA: MARKET, BY COUNTRY, 2018–2022 (USD MILLION)
               TABLE 77 NORTH AMERICA: MARKET, BY COUNTRY, 2023–2028 (USD MILLION)
               TABLE 78 NORTH AMERICA: MARKET, BY TECHNIQUE, 2018–2022 (USD MILLION)
               TABLE 79 NORTH AMERICA: MARKET, BY TECHNIQUE, 2023–2028 (USD MILLION)
               TABLE 80 NORTH AMERICA: MARKET, BY APPLICATION, 2018–2022 (USD MILLION)
               TABLE 81 NORTH AMERICA: MARKET, BY APPLICATION, 2023–2028 (USD MILLION)
               TABLE 82 NON THERMAL PASTEURIZATION MARKET, BY FOOD SUB-APPLICATION, 2018–2022 (USD MILLION)
               TABLE 83 NORTH AMERICA: MARKET, BY FOOD SUB-APPLICATION, 2023–2028 (USD MILLION)
               TABLE 84 NORTH AMERICA: MARKET, BY BEVERAGE  SUB-APPLICATION, 2018–2022 (USD MILLION)
               TABLE 85 NORTH AMERICA: MARKET, BY BEVERAGE  SUB-APPLICATION, 2023–2028 (USD MILLION)
               TABLE 86 NORTH AMERICA: MARKET, BY NON-ALCOHOLIC BEVERAGE, 2018–2022 (USD MILLION)
               TABLE 87 NORTH AMERICA: MARKET, BY NON-ALCOHOLIC BEVERAGE, 2023–2028 (USD MILLION)
               TABLE 88 NORTH AMERICA: MARKET, BY ALCOHOLIC BEVERAGE, 2018–2022 (USD MILLION)
               TABLE 89 NORTH AMERICA: MARKET, BY ALCOHOLIC BEVERAGE, 2023–2028 (USD MILLION)
               TABLE 90 NORTH AMERICA: MARKET, BY FORM, 2018–2022 (USD MILLION)
               TABLE 91 NORTH AMERICA: MARKET, BY FORM, 2023–2028 (USD MILLION)
             10.4.1 NORTH AMERICA: RECESSION IMPACT
                       FIGURE 37 NORTH AMERICA: INFLATION RATES, BY KEY COUNTRY, 2017–2021
                       FIGURE 38 NORTH AMERICA: RECESSION IMPACT ANALYSIS, 2023
             10.4.2 US
                       10.4.2.1 Demand for processed meat, fruits, and vegetables to drive market
                                   TABLE 92 US: NON-THERMAL PASTEURIZATION MARKET, BY TECHNIQUE, 2018–2022 (USD MILLION)
                                   TABLE 93 US: MARKET, BY TECHNIQUE, 2023–2028 (USD MILLION)
             10.4.3 CANADA
                       10.4.3.1 Highly competitive food manufacturers to employ non-thermal pasteurization technologies
                                   TABLE 94 CANADA: MARKET, BY TECHNIQUE, 2018–2022 (USD MILLION)
                                   TABLE 95 CANADA: MARKET, BY TECHNIQUE, 2023–2028 (USD MILLION)
             10.4.4 MEXICO
                       10.4.4.1 Increasing consumer demand for healthier and safer food options to drive growth
                                   TABLE 96 MEXICO: MARKET, BY TECHNIQUE, 2018–2022 (USD MILLION)
                                   TABLE 97 MEXICO: MARKET, BY TECHNIQUE, 2023–2028 (USD MILLION)
     10.5 EUROPE 
               TABLE 98 EUROPE: MARKET, BY COUNTRY, 2018–2022 (USD MILLION)
               TABLE 99 EUROPE: MARKET, BY COUNTRY, 2023–2028 (USD MILLION)
               TABLE 100 EUROPE: MARKET, BY TECHNIQUE, 2018–2022 (USD MILLION)
               TABLE 101 EUROPE: NON THERMAL PASTEURIZATION MARKET, BY TECHNIQUE, 2023–2028 (USD MILLION)
               TABLE 102 EUROPE: MARKET, BY APPLICATION, 2018–2022 (USD MILLION)
               TABLE 103 EUROPE: MARKET, BY APPLICATION, 2023–2028 (USD MILLION)
               TABLE 104 EUROPE: MARKET, BY FOOD SUB-APPLICATION, 2018–2022 (USD MILLION)
               TABLE 105 EUROPE: MARKET, BY FOOD SUB-APPLICATION, 2023–2028 (USD MILLION)
               TABLE 106 EUROPE: MARKET, BY BEVERAGE SUB-APPLICATION, 2018–2022 (USD MILLION)
               TABLE 107 EUROPE: MARKET, BY BEVERAGE SUB-APPLICATION, 2023–2028 (USD MILLION)
               TABLE 108 EUROPE: MARKET, BY NON-ALCOHOLIC BEVERAGE, 2018–2022 (USD MILLION)
               TABLE 109 EUROPE: MARKET, BY NON-ALCOHOLIC BEVERAGE, 2023–2028 (USD MILLION)
               TABLE 110 EUROPE: MARKET, BY ALCOHOLIC BEVERAGE, 2018–2022 (USD MILLION)
               TABLE 111 EUROPE: MARKET, BY ALCOHOLIC BEVERAGE, 2023–2028 (USD MILLION)
               TABLE 112 EUROPE: MARKET, BY FORM, 2018–2022 (USD MILLION)
               TABLE 113 EUROPE: NON-THERMAL PASTEURIZATION MARKET, BY FORM, 2023–2028 (USD MILLION)
             10.5.1 EUROPE: RECESSION IMPACT
                       FIGURE 39 EUROPE: INFLATION RATES, BY KEY COUNTRY, 2017–2021
                       FIGURE 40 EUROPE: RECESSION IMPACT ANALYSIS, 2023
             10.5.2 GERMANY
                       10.5.2.1 German meat industry to be leading user of HPP technology
                                   TABLE 114 GERMANY: MARKET, BY TECHNIQUE, 2018–2022 (USD MILLION)
                                   TABLE 115 GERMANY: MARKET, BY TECHNIQUE, 2023–2028 (USD MILLION)
             10.5.3 FRANCE
                       10.5.3.1 France to be crucial market for food packaging technology & equipment in Europe
                                   TABLE 116 FRANCE: MARKET, BY TECHNIQUE, 2018–2022 (USD MILLION)
                                   TABLE 117 FRANCE: MARKET, BY TECHNIQUE, 2023–2028 (USD MILLION)
             10.5.4 SPAIN
                       10.5.4.1 Packaged food market growth to accelerate food & beverage non-thermal pasteurization sector
                                   TABLE 118 SPAIN: MARKET, BY TECHNIQUE, 2018–2022 (USD MILLION)
                                   TABLE 119 SPAIN: MARKET, BY TECHNIQUE, 2023–2028 (USD MILLION)
             10.5.5 UK
                       10.5.5.1 Demand for non-thermally processed fruit juices without preservatives to drive market
                                   TABLE 120 UK: NON THERMAL PASTEURIZATION MARKET, BY TECHNIQUE, 2018–2022 (USD MILLION)
                                   TABLE 121 UK: MARKET, BY TECHNIQUE, 2023–2028 (USD MILLION)
             10.5.6 ITALY
                       10.5.6.1 Strong culture of artisanal and premium food & beverage production to drive demand
                                   TABLE 122 ITALY: MARKET, BY TECHNIQUE, 2018–2022 (USD MILLION)
                                   TABLE 123 ITALY: MARKET, BY TECHNIQUE, 2023–2028 (USD MILLION)
             10.5.7 REST OF EUROPE
                       TABLE 124 REST OF EUROPE: MARKET, BY TECHNIQUE, 2018–2022 (USD MILLION)
                       TABLE 125 REST OF EUROPE: MARKET, BY TECHNIQUE, 2023–2028 (USD MILLION)
     10.6 ASIA PACIFIC 
               TABLE 126 ASIA PACIFIC: NON-THERMAL PASTEURIZATION MARKET, BY COUNTRY, 2018–2022 (USD MILLION)
               TABLE 127 ASIA PACIFIC: MARKET, BY COUNTRY, 2023–2028 (USD MILLION)
               TABLE 128 ASIA PACIFIC: MARKET, BY TECHNIQUE, 2018–2022 (USD MILLION)
               TABLE 129 ASIA PACIFIC: MARKET, BY TECHNIQUE, 2023–2028 (USD MILLION)
               TABLE 130 ASIA PACIFIC: MARKET, BY APPLICATION, 2018–2022 (USD MILLION)
               TABLE 131 ASIA PACIFIC: MARKET, BY APPLICATION, 2023–2028 (USD MILLION)
               TABLE 132 ASIA PACIFIC: MARKET, BY FOOD SUB-APPLICATION, 2018–2022 (USD MILLION)
               TABLE 133 ASIA PACIFIC: MARKET, BY FOOD SUB-APPLICATION, 2023–2028 (USD MILLION)
               TABLE 134 ASIA PACIFIC: MARKET, BY BEVERAGE  SUB-APPLICATION, 2018–2022 (USD MILLION)
               TABLE 135 ASIA PACIFIC: MARKET, BY BEVERAGE  SUB-APPLICATION, 2023–2028 (USD MILLION)
               TABLE 136 ASIA PACIFIC: MARKET, BY NON-ALCOHOLIC BEVERAGE, 2018–2022 (USD MILLION)
               TABLE 137 ASIA PACIFIC: MARKET, BY NON-ALCOHOLIC BEVERAGE, 2023–2028 (USD MILLION)
               TABLE 138 ASIA PACIFIC: MARKET, BY ALCOHOLIC BEVERAGE, 2018–2022 (USD MILLION)
               TABLE 139 ASIA PACIFIC: MARKET, BY ALCOHOLIC BEVERAGE, 2023–2028 (USD MILLION)
               TABLE 140 ASIA PACIFIC: MARKET, BY FORM, 2018–2022 (USD MILLION)
               TABLE 141 ASIA PACIFIC: MARKET, BY FORM, 2023–2028 (USD MILLION)
             10.6.1 ASIA PACIFIC: RECESSION IMPACT
                       FIGURE 41 ASIA PACIFIC: INFLATION RATES, BY KEY COUNTRY, 2017–2021
                       FIGURE 42 ASIA PACIFIC: RECESSION IMPACT ANALYSIS, 2023
             10.6.2 CHINA
                       10.6.2.1 HPP-treated meat & seafood to witness increased demand due to advantages over thermal processing
                                   TABLE 142 CHINA: MARKET, BY TECHNIQUE, 2018–2022 (USD MILLION)
                                   TABLE 143 CHINA: MARKET, BY TECHNIQUE, 2023–2028 (USD MILLION)
             10.6.3 INDIA
                       10.6.3.1 India’s expansion of packaged and processed food exports to drive market growth
                                   TABLE 144 INDIA: MARKET, BY TECHNIQUE, 2018–2022 (USD MILLION)
                                   TABLE 145 INDIA: MARKET, BY TECHNIQUE, 2023–2028 (USD MILLION)
             10.6.4 JAPAN
                       10.6.4.1 Commercial availability of non-thermally treated food products to augment growth
                                   TABLE 146 JAPAN: NON-THERMAL PASTEURIZATION MARKET, BY TECHNIQUE, 2018–2022 (USD MILLION)
                                   TABLE 147 JAPAN: MARKET, BY TECHNIQUE, 2023–2028 (USD MILLION)
             10.6.5 AUSTRALIA
                       10.6.5.1 Export of fish, meat, and bakery items to contribute to market growth
                                   TABLE 148 AUSTRALIA: MARKET, BY TECHNIQUE, 2018–2022 (USD MILLION)
                                   TABLE 149 AUSTRALIA: MARKET, BY TECHNIQUE, 2023–2028 (USD MILLION)
             10.6.6 NEW ZEALAND
                       10.6.6.1 Rising demand for processed food and dairy products to fuel market growth
                                   TABLE 150 NEW ZEALAND: MARKET, BY TECHNIQUE, 2018–2022 (USD MILLION)
                                   TABLE 151 NEW ZEALAND: MARKET, BY TECHNIQUE, 2023–2028 (USD MILLION)
             10.6.7 REST OF ASIA PACIFIC
                       TABLE 152 REST OF ASIA PACIFIC: MARKET, BY TECHNIQUE, 2018–2022 (USD MILLION)
                       TABLE 153 REST OF ASIA PACIFIC: MARKET, BY TECHNIQUE, 2023–2028 (USD MILLION)
     10.7 SOUTH AMERICA 
               TABLE 154 SOUTH AMERICA: NON THERMAL PASTEURIZATION MARKET, BY COUNTRY, 2018–2022 (USD MILLION)
               TABLE 155 SOUTH AMERICA: MARKET, BY COUNTRY, 2023–2028 (USD MILLION)
               TABLE 156 SOUTH AMERICA: MARKET, BY TECHNIQUE, 2018–2022 (USD MILLION)
               TABLE 157 SOUTH AMERICA: NON THERMAL PASTEURIZATION MARKET, BY TECHNIQUE, 2023–2028 (USD MILLION)
               TABLE 158 SOUTH AMERICA: MARKET, BY APPLICATION, 2018–2022 (USD MILLION)
               TABLE 159 SOUTH AMERICA: MARKET, BY APPLICATION, 2023–2028 (USD MILLION)
               TABLE 160 SOUTH AMERICA: MARKET, BY FOOD SUB-APPLICATION, 2018–2022 (USD MILLION)
               TABLE 161 SOUTH AMERICA: MARKET, BY FOOD SUB-APPLICATION, 2023–2028 (USD MILLION)
               TABLE 162 SOUTH AMERICA: MARKET, BY BEVERAGE  SUB-APPLICATION, 2018–2022 (USD MILLION)
               TABLE 163 SOUTH AMERICA: MARKET, BY BEVERAGE  SUB-APPLICATION, 2023–2028 (USD MILLION)
               TABLE 164 SOUTH AMERICA: MARKET, BY NON-ALCOHOLIC BEVERAGE, 2018–2022 (USD MILLION)
               TABLE 165 SOUTH AMERICA: MARKET, BY NON-ALCOHOLIC BEVERAGE, 2023–2028 (USD MILLION)
               TABLE 166 SOUTH AMERICA: MARKET, BY ALCOHOLIC BEVERAGE, 2018–2022 (USD MILLION)
               TABLE 167 SOUTH AMERICA: NON-THERMAL PASTEURIZATION MARKET, BY ALCOHOLIC BEVERAGE, 2023–2028 (USD MILLION)
               TABLE 168 SOUTH AMERICA: MARKET, BY FORM, 2018–2022 (USD MILLION)
               TABLE 169 SOUTH AMERICA: MARKET, BY FORM, 2023–2028 (USD MILLION)
             10.7.1 SOUTH AMERICA: RECESSION IMPACT ANALYSIS
                       FIGURE 43 SOUTH AMERICA: INFLATION RATES, BY KEY COUNTRY, 2017–2021
                       FIGURE 44 SOUTH AMERICA: RECESSION IMPACT ANALYSIS, 2023
             10.7.2 BRAZIL
                       10.7.2.1 Fast growth in food and agricultural sectors to promote use of non-thermal processing technologies
                                   TABLE 170 BRAZIL: MARKET, BY TECHNIQUE, 2018–2022 (USD MILLION)
                                   TABLE 171 BRAZIL: MARKET, BY TECHNIQUE, 2023–2028 (USD MILLION)
             10.7.3 ARGENTINA
                       10.7.3.1 Expansion of well-established retail chains to widen application of non-thermal processing in convenience food
                                   TABLE 172 ARGENTINA: MARKET, BY TECHNIQUE, 2018–2022 (USD MILLION)
                                   TABLE 173 ARGENTINA: MARKET, BY TECHNIQUE, 2023–2028 (USD MILLION)
             10.7.4 REST OF SOUTH AMERICA
                       TABLE 174 REST OF SOUTH AMERICA: MARKET, BY TECHNIQUE, 2018–2022 (USD MILLION)
                       TABLE 175 REST OF SOUTH AMERICA: MARKET, BY TECHNIQUE, 2023–2028 (USD MILLION)
     10.8 REST OF THE WORLD (ROW) 
               TABLE 176 ROW: MARKET, BY REGION, 2018–2022 (USD MILLION)
               TABLE 177 ROW: MARKET, BY REGION, 2023–2028 (USD MILLION)
               TABLE 178 ROW: MARKET, BY TECHNIQUE, 2018–2022 (USD MILLION)
               TABLE 179 ROW: MARKET, BY TECHNIQUE, 2023–2028 (USD MILLION)
               TABLE 180 ROW: MARKET, BY APPLICATION, 2018–2022 (USD MILLION)
               TABLE 181 ROW: MARKET, BY APPLICATION, 2023–2028 (USD MILLION)
               TABLE 182 ROW: MARKET, BY FOOD SUB-APPLICATION, 2018–2022 (USD MILLION)
               TABLE 183 ROW: MARKET, BY FOOD SUB-APPLICATION, 2023–2028 (USD MILLION)
               TABLE 184 ROW: MARKET, BY BEVERAGE SUB-APPLICATION, 2018–2022 (USD MILLION)
               TABLE 185 ROW: NON-THERMAL PASTEURIZATION MARKET, BY BEVERAGE SUB-APPLICATION, 2023–2028 (USD MILLION)
               TABLE 186 ROW: MARKET, BY NON-ALCOHOLIC BEVERAGE, 2018–2022 (USD MILLION)
               TABLE 187 ROW: MARKET, BY NON-ALCOHOLIC BEVERAGE, 2023–2028 (USD MILLION)
               TABLE 188 ROW: MARKET, BY ALCOHOLIC BEVERAGE, 2018–2022 (USD MILLION)
               TABLE 189 ROW: MARKET, BY ALCOHOLIC BEVERAGE, 2023–2028 (USD MILLION)
               TABLE 190 ROW: MARKET, BY FORM, 2018–2022 (USD MILLION)
               TABLE 191 ROW: MARKET, BY FORM, 2023–2028 (USD MILLION)
             10.8.1 REST OF THE WORLD: RECESSION IMPACT
                       FIGURE 45 ROW: INFLATION RATES, BY KEY REGION, 2017-2021
                       FIGURE 46 ROW: RECESSION IMPACT ANALYSIS, 2023
             10.8.2 MIDDLE EAST
                       10.8.2.1 Middle East to present opportunities for domestic as well as international non-thermal pasteurization technique providers
                                   TABLE 192 MIDDLE EAST: NON THERMAL PASTEURIZATION MARKET, BY TECHNIQUE, 2018–2022 (USD MILLION)
                                   TABLE 193 MIDDLE EAST: MARKET, BY TECHNIQUE, 2023–2028 (USD MILLION)
             10.8.3 AFRICA
                       10.8.3.1 Expansion of retail chains to increase application of non-thermal processing in convenience food
                                   TABLE 194 AFRICA: MARKET, BY TECHNIQUE, 2018–2022 (USD MILLION)
                                   TABLE 195 AFRICA: MARKET, BY TECHNIQUE, 2023–2028 (USD MILLION)
 
11 COMPETITIVE LANDSCAPE (Page No. - 191)
     11.1 OVERVIEW 
     11.2 MARKET SHARE ANALYSIS, 2021 
               TABLE 196 NON-THERMAL PASTEURIZATION MARKET: DEGREE OF COMPETITION (CONSOLIDATED)
     11.3 SEGMENTAL REVENUE ANALYSIS OF KEY PLAYERS 
               FIGURE 47 SEGMENTAL REVENUE ANALYSIS OF KEY PLAYERS, 2018–2021 (USD BILLION)
     11.4 STRATEGIES ADOPTED BY KEY PLAYERS 
               TABLE 197 STRATEGIES ADOPTED BY KEY NON-THERMAL PASTEURIZATION MANUFACTURERS
     11.5 COMPANY EVALUATION QUADRANT (KEY PLAYERS) 
             11.5.1 STARS
             11.5.2 EMERGING LEADERS
             11.5.3 PERVASIVE PLAYERS
             11.5.4 PARTICIPANTS
                       FIGURE 48 MARKET: COMPANY EVALUATION QUADRANT, 2022 (KEY PLAYERS)
             11.5.5 FOOTPRINT, BY TECHNIQUE
                       TABLE 198 COMPANY FOOTPRINT, BY TECHNIQUE
                       TABLE 199 COMPANY FOOTPRINT, BY APPLICATION
                       TABLE 200 COMPANY FOOTPRINT, BY REGION
                       TABLE 201 OVERALL COMPANY FOOTPRINT
     11.6 MARKET: EVALUATION QUADRANT FOR OTHER PLAYERS, 2022 
             11.6.1 PROGRESSIVE COMPANIES
             11.6.2 STARTING BLOCKS
             11.6.3 RESPONSIVE COMPANIES
             11.6.4 DYNAMIC COMPANIES
                       FIGURE 49 MARKET: COMPANY EVALUATION  QUADRANT, 2022 (OTHER PLAYERS)
             11.6.5 COMPETITIVE BENCHMARKING OF OTHER PLAYERS
                       TABLE 202 MARKET: DETAILED LIST OF OTHER PLAYERS
                       TABLE 203 MARKET: COMPETITIVE BENCHMARKING  OF OTHER PLAYERS
     11.7 COMPETITIVE SCENARIO 
             11.7.1 PRODUCT LAUNCHES
                       TABLE 204 NON-THERMAL PASTEURIZATION MARKET: PRODUCT LAUNCHES, 2021–2022
             11.7.2 DEALS
                       TABLE 205 MARKET: DEALS, 2018–2022
             11.7.3 OTHERS
                       TABLE 206 MARKET: OTHERS, 2018–2022
 
12 COMPANY PROFILES (Page No. - 207)
     12.1 INTRODUCTION 
(Business overview, Products offered, Recent Developments, MNM view)*
     12.2 KEY PLAYERS 
             12.2.1 JBT CORPORATION
                       TABLE 207 JBT CORPORATION: BUSINESS OVERVIEW
                       FIGURE 50 JBT CORPORATION: COMPANY SNAPSHOT
                       TABLE 208 JBT CORPORATION: PRODUCTS OFFERED
                       TABLE 209 JBT CORPORATION: PRODUCT LAUNCHES
                       TABLE 210 JBT CORPORATION: OTHER DEVELOPMENTS
             12.2.2 HIPERBARIC
                       TABLE 211 HIPERBARIC: BUSINESS OVERVIEW
                       TABLE 212 HIPERBARIC: PRODUCTS OFFERED
                       TABLE 213 HIPERBARIC: PRODUCT LAUNCHES
                       TABLE 214 HIPERBARIC: DEALS
             12.2.3 THYSSENKRUPP AG
                       TABLE 215 THYSSENKRUPP AG: BUSINESS OVERVIEW
                       FIGURE 51 THYSSENKRUPP AG: COMPANY SNAPSHOT
                       TABLE 216 THYSSENKRUPP AG: PRODUCTS OFFERED
             12.2.4 KOBELCO CONSTRUCTION MACHINERY LTD.
                       TABLE 217 KOBELCO CONSTRUCTION MACHINERY LTD.: BUSINESS OVERVIEW
                       FIGURE 52 KOBELCO CONSTRUCTION MACHINERY LTD.: COMPANY SNAPSHOT
                       TABLE 218 KOBELCO CONSTRUCTION MACHINERY LTD.: PRODUCTS OFFERED
                       TABLE 219 KOBELCO CONSTRUCTION MACHINERY LTD: DEALS
                       TABLE 220 KOBELCO CONSTRUCTION MACHINERY LTD.: OTHER DEVELOPMENTS
             12.2.5 SYNTEGON
                       TABLE 221 SYNTEGON: NON-THERMAL PASTEURIZATION MARKET BUSINESS OVERVIEW
                       TABLE 222 SYNTEGON: PRODUCTS OFFERED
             12.2.6 LYRAS
                       TABLE 223 LYRAS: BUSINESS OVERVIEW
                       TABLE 224 LYRAS: PRODUCTS OFFERED
                       TABLE 225 LYRAS: OTHER DEVELOPMENTS
             12.2.7 MULTIVAC
                       TABLE 226 MULTIVAC: BUSINESS OVERVIEW
                       TABLE 227 MULTIVAC: PRODUCTS OFFERED
             12.2.8 STANSTED FLUID POWER LTD.
                       TABLE 228 STANSTED FLUID POWER LTD.: BUSINESS OVERVIEW
                       TABLE 229 STANSTED FLUID POWER LTD.: PRODUCTS OFFERED
             12.2.9 PULSEMASTER
                       TABLE 230 PULSEMASTER: BUSINESS OVERVIEW
                       TABLE 231 PULSEMASTER: PRODUCTS OFFERED
             12.2.10 ELEA
                       TABLE 232 ELEA: BUSINESS OVERVIEW
                       TABLE 233 ELEA: PRODUCTS OFFERED
             12.2.11 SYMBIOS TECHNOLOGIES
                       TABLE 234 SYMBIOS TECHNOLOGIES: BUSINESS OVERVIEW
                       TABLE 235 SYMBIOS TECHNOLOGIES: PRODUCTS OFFERED
             12.2.12 QUINTUS TECHNOLOGIES AB
                       TABLE 236 QUINTUS TECHNOLOGIES AB: BUSINESS OVERVIEW
                       TABLE 237 QUINTUS TECHNOLOGIES AB: PRODUCTS OFFERED
             12.2.13 DUKANE
                       TABLE 238 DUKANE: BUSINESS OVERVIEW
                       TABLE 239 DUKANE: PRODUCTS OFFERED
                       TABLE 240 DUKANE: DEALS
             12.2.14 FRESHERTECH
                       TABLE 241 FRESHERTECH: BUSINESS OVERVIEW
                       TABLE 242 FRESHERTECH: PRODUCTS OFFERED
             12.2.15 NORDION
                       TABLE 243 NORDION: NON-THERMAL PASTEURIZATION MARKET BUSINESS OVERVIEW
                       TABLE 244 NORDION: PRODUCTS OFFERED
                       TABLE 245 NORDION: DEALS
     12.3 START-UPS/SMES 
             12.3.1 STERIGENICS U.S., LLC
                       TABLE 246 STERIGENICS U.S., LLC: BUSINESS OVERVIEW
                       TABLE 247 STERIGENICS U.S., LLC: PRODUCTS OFFERED
                       TABLE 248 STERIGENICS U.S., LLC: DEALS
                       TABLE 249 STERIGENICS U.S., LLC: OTHER DEVELOPMENTS
             12.3.2 COOLWAVE PROCESSING B.V.
                       TABLE 250 COOLWAVE PROCESSING B.V.: BUSINESS OVERVIEW
                       TABLE 251 COOLWAVE PROCESSING B.V.: PRODUCTS OFFERED
             12.3.3 STERIBAR HPP
                       TABLE 252 STERIBAR HPP: BUSINESS OVERVIEW
                       TABLE 253 STERIBAR HPP: PRODUCTS OFFERED
             12.3.4 YPSICON ADVANCED TECHNOLOGIES SL
                       TABLE 254 YPSICON ADVANCED TECHNOLOGIES SL: BUSINESS OVERVIEW
                       TABLE 255 YPSICON ADVANCED TECHNOLOGIES SL: PRODUCTS OFFERED
             12.3.5 BAO TOU KEFA HIGH PRESSURE TECHNOLOGY CO., LTD
                       TABLE 256 BAO TOU KEFA HIGH PRESSURE TECHNOLOGY CO., LTD: BUSINESS OVERVIEW
                       TABLE 257 BAO TOU KEFA HIGH PRESSURE TECHNOLOGY CO., LTD: PRODUCTS OFFERED
     12.4 OTHER KEY PLAYERS 
             12.4.1 ADVANCED MICROWAVE TECHNOLOGIES
             12.4.2 EXDIN SOLUTIONS
             12.4.3 HARWOOD ENGINEERING COMPANY, INC.
             12.4.4 UNIVERSAL PURE
             12.4.5 AMERICAN PASTEURIZATION COMPANY
*Details on Business overview, Products offered, Recent Developments, MNM view might not be captured in case of unlisted companies.
 
13 ADJACENT & RELATED MARKETS (Page No. - 249)
     13.1 INTRODUCTION 
               TABLE 258 ADJACENT MARKETS TO NON-THERMAL PASTEURIZATION MARKET
     13.2 LIMITATIONS 
     13.3 DAIRY PROCESSING EQUIPMENT MARKET 
             13.3.1 MARKET DEFINITION
             13.3.2 MARKET OVERVIEW
                       TABLE 259 DAIRY PROCESSING EQUIPMENT MARKET, BY TYPE, 2016–2020 (USD MILLION)
                       TABLE 260 DAIRY PROCESSING EQUIPMENT MARKET, BY TYPE, 2021–2026 (USD MILLION)
     13.4 FRUIT & VEGETABLE PROCESSING MARKET 
             13.4.1 MARKET DEFINITION
             13.4.2 MARKET OVERVIEW
                       TABLE 261 FRUIT & VEGETABLE PROCESSING EQUIPMENT MARKET, BY TYPE, 2017–2021 (USD MILLION)
                       TABLE 262 FRUIT & VEGETABLE PROCESSING EQUIPMENT MARKET, BY TYPE, 2022–2027 (USD MILLION)
 
14 APPENDIX (Page No. - 253)
     14.1 KNOWLEDGESTORE: MARKETSANDMARKETS’  SUBSCRIPTION PORTAL 
     14.2 CUSTOMIZATION OPTIONS 
     14.3 RELATED REPORTS 
     14.4 AUTHOR DETAILS 

This research involves the extensive use of secondary sources; directories; and databases (Bloomberg and Factiva) to identify and collect information useful for a technical, market-oriented, and commercial study of the non-thermal pasteurization market. In-depth interviews were conducted with various primary respondents, such as key industry participants, Subject Matter Experts (SMEs), C-level executives of key market players, and industry consultants, to obtain and verify critical qualitative and quantitative information and to assess prospects.

Secondary Research

In the secondary research process, various secondary sources were referred to, in order to identify and collect information for this study. The secondary sources included annual reports, press releases, and investor presentations of companies, white papers, certified publications, articles from recognized authors, gold & silver standard websites, regulatory bodies, trade directories, and databases.

Secondary research was mainly used to obtain key information about the industry’s supply chain, the market’s monetary chain, the total pool of key players, market classification, and segmentation according to industry trends to the bottom-most level and geographical markets. It was also used to obtain information on the key developments from a market-oriented perspective.

Primary Research

The non-thermal pasteurization market comprises several stakeholders, including equipment manufacturers and suppliers, food & beverages manufacturers, and regulatory organizations in the supply chain. Various primary sources from both the supply and demand sides of the market were interviewed to obtain qualitative and quantitative information. Primary sources from the demand-side include key opinion leaders, executives, vice presidents, and CEOs of sports and golf landscape developing companies through questionnaires, emails, and telephonic interviews.
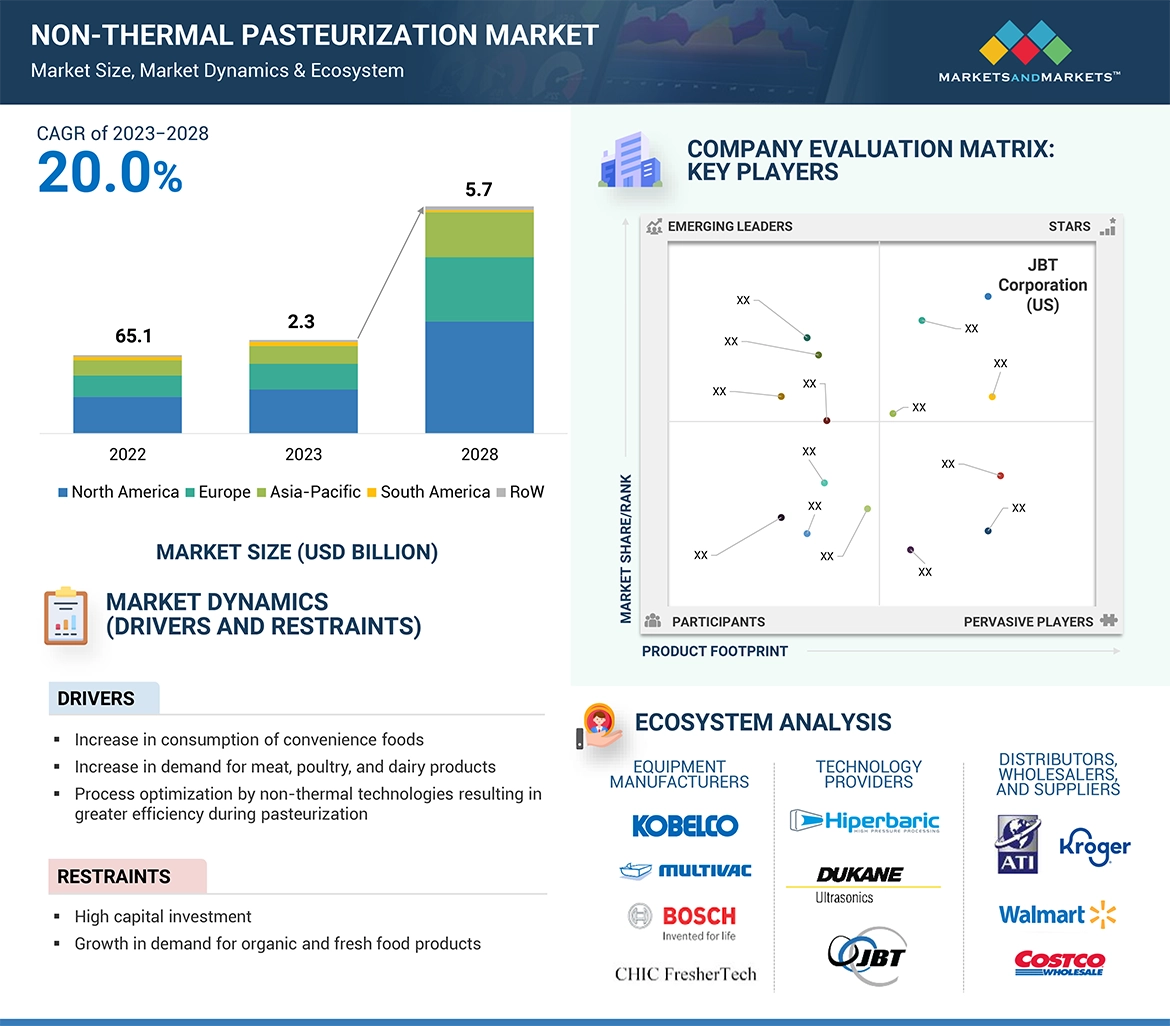
Breakdown of Primary participants

Non-thermal pasteurization Market Size, and Share

To know about the assumptions considered for the study, download the pdf brochure

Non-Thermal Pasteurization Market Size Estimation

Both the top-down and bottom-up approaches have been used to estimate and validate the total size of the non thermal pasteurization market. These approaches were extensively used to determine the size of the subsegments in the market. The research methodology used to estimate the market size includes the following details:

Top-down approach:

  • The key industry and market players were identified through extensive secondary research.
  • The industry's supply chain and market size were determined through primary and secondary research.
  • All percentage share splits and breakdowns were determined using secondary sources and verified through primary sources.

Bottom-up approach:

  • The market size was analyzed based on the share of each type of non-thermal pasteurization and its penetration within the application and form at regional and country levels. Thus, the global market was estimated with a bottom-up approach of the type at the country level.
  • Other factors include demand within the supply chain including food & beverage industry; and function trends; pricing trends; the adoption rate and price factors; patents registered; and organic and inorganic growth attempts.
  • All possible parameters that affect the market covered in this research study were accounted for, viewed in extensive detail, verified through primary research, and analyzed to obtain final quantitative and qualitative data.

Data Triangulation

After arriving at the overall market size from the estimation process explained above, the total market was split into several segments and subsegments. To estimate the overall non thermal pasteurization market and arrive at the exact statistics for all segments and subsegments, the data triangulation and market breakdown procedures were employed, wherever applicable. The data was triangulated by studying various factors and trends from the demand and supply sides. Along with this, the market size was validated using both the top-down and bottom-up approaches.

Non-Thermal Pasteurization Market Definition

Non-thermal pasteurization is an alternative food processing technology that involves the sterilization of food & beverages and other applications without using heat. Also known as cold pasteurization, this process helps retain the essential nutrients, taste, appearance, and other organoleptic features, leading to the increased shelf life of food in a cost-effective manner. Non-thermal pasteurization technologies used for food processing include high-pressure processing (HPP), ultraviolet and pulsed light, microwave volumetric heating (MVH), pulsed electric field (PEF), ultrasonic, irradiation, and others.

Non-thermal pasteurization technologies are widely used for food safety and food preservation through various processes such as sterilization and decontamination by acting on the cells of microorganisms. They are also widely used in the pharmaceutical sector for disaggregation and controlled re-naturalization of proteins of therapeutic interest and inactivation of pathogens (such as bacteria and viruses) in vaccines while retaining their antigen response.

Key Stakeholders

  • Manufacturers, importers & exporters, traders, distributors, and suppliers of non-thermal pasteurizing equipment
    • Food & beverage processing equipment importers and exporters
    • Food product manufacturers, processors, distributors, and traders
    • Beverage product manufacturers, processors, distributors, and traders
    • Food & beverage ingredient manufacturers, processors, distributors, and traders
    • Raw material suppliers
  • Regulatory bodies, which include the following:
    • Food and Agriculture Organization (FAO)
    • Environmental Protection Agency (EPA)
    • Food Safety Council (FSC)
    • European Federation of National Associations of Measurement, and Testing and Analytical Laboratories (EUROLAB)
  • Government and research organizations
  • Trade associations and industry bodies

Non-Thermal Pasteurization Market Report Objectives

Market Intelligence

  • Determining and projecting the size of the non thermal pasteurization market based on technique, form, application, and region over a five-year period ranging from 2023 to 2028.
  • Identifying the attractive opportunities in the market by determining the largest and fastest-growing segments across the key regions
  • Analyzing the demand-side factors based on the following:
    • Impact of macro- and micro-economic factors on the market
    • Shifts in demand patterns across different subsegments and regions.
  • Providing detailed information about the key factors influencing the growth of the market (drivers, restraints, opportunities, and industry-specific challenges)
  • To analyze the opportunities in the market for stakeholders and provide a competitive landscape for market leaders.
  • To strategically profile the key players and comprehensively analyze their core competencies.
  • To analyze competitive developments such as joint ventures, mergers & acquisitions, new product developments, and research & development (R&D) in the market

Competitive Intelligence

  • Identifying and profiling the key market players in the non-thermal pasteurization market
  • Providing a comparative analysis of the market leaders based on the following:
    • Product offerings
    • Business strategies
    • Strengths and weaknesses
    • Key financials
  • Understanding the competitive landscape and identifying the major growth strategies adopted by players across the key region.
  • Analyzing the value chain and regulatory frameworks across regions and their impact on prominent market players
  • Providing insights into the key investments and product innovations and technology in the non thermal pasteurization market

Available Customizations:

With the given market data, MarketsandMarkets offers customizations according to company-specific scientific needs.

The following customization options are available for the report:

Product Analysis

  • Product Matrix, which gives a detailed comparison of the product portfolio of each company

Geographic Analysis

With the given market data, MarketsandMarkets offers customizations according to the company-specific scientific needs.

  • Further breakdown of the Rest of European Non-thermal pasteurization market, by key country
  • Further breakdown of the Rest of South America market, by key country

Company Information

  • Detailed analyses and profiling of additional market players
Custom Market Research Services

We will customize the research for you, in case the report listed above does not meet with your exact requirements. Our custom research will comprehensively cover the business information you require to help you arrive at strategic and profitable business decisions.

Request Customization

Instant Answers with GPT - Ask Now!

Ask real questions. Get complete answers !
Report Code
FB 6858
Published ON
Apr, 2023
Choose License Type
BUY NOW
  • SHARE
X
Request Customization
Speak to Analyst
Speak to Analyst
OR FACE-TO-FACE MEETING
PERSONALIZE THIS RESEARCH
  • Triangulate with your Own Data
  • Get Data as per your Format and Definition
  • Gain a Deeper Dive on a Specific Application, Geography, Customer or Competitor
  • Any level of Personalization
REQUEST A FREE CUSTOMIZATION
LET US HELP YOU!
  • What are the Known and Unknown Adjacencies Impacting the Non-thermal Pasteurization Market
  • What will your New Revenue Sources be?
  • Who will be your Top Customer; what will make them switch?
  • Defend your Market Share or Win Competitors
  • Get a Scorecard for Target Partners
CUSTOMIZED WORKSHOP REQUEST
+1-888-600-6441
  • Call Us
  • +1-888-600-6441 (Corporate office hours)
  • +1-888-600-6441 (US/Can toll free)
  • +44-800-368-9399 (UK office hours)
CONNECT WITH US
ABOUT TRUST ONLINE
©2024 MarketsandMarkets Research Private Ltd. All rights reserved
DMCA.com Protection Status Website Feedback