North American Drug Delivery Technologies Market by Route of Administration (Oral (Solid), Pulmonary (Nebulizer), Injectable (Device), Ocular (Device), Nasal (Drop), Topical (Solid), Implantable (Active)), End User (Hospital, Home Care) - Global Forecast to 2021


The North American drug delivery technologies market is projected to reach USD 758.7 Billion by 2021 from USD 520.0 Billion in 2016, at a CAGR of 6.5% during the forecast period. Growth in this market is primarily driven by the rising prevalence of chronic diseases, growth in the biologics market, funding initiatives for drug delivery research, and technological advancements. However, risk of needlestick injuries and side effects related to drugs are expected to restrain the growth of this market in the coming years.
The North American drug delivery technologies market is segmented on the basis of route of administration, end user, and country. The U.S. market is expected to dominate the North American drug delivery technologies market in 2016 and is projected to grow at the highest CAGR during the forecast period. The large share of the U.S. in the North American market can primarily be attributed to factors such as the rising prevalence of chronic diseases, rapidly growing geriatric population, growth in the biologics market, and growing regulatory approvals and new product launches.
Prominent players in this market include Johnson & Johnson, Inc. (U.S.), Merck & Co. Inc. (U.S.), Novartis AG (Switzerland), Bayer AG (Germany), 3M Company (U.S.), F. Hoffmann-La Roche (Switzerland), Becton, Dickinson and Company (U.S.), GlaxoSmithKline (U.K.), Pfizer, Inc. (U.S.), Antares Pharma (U.S.), and Sanofi (France).
Target Audience:
- Drug delivery manufacturing companies
- Pharmaceutical and medical device manufacturing companies
- Healthcare institutions (hospitals and outpatient clinics)
- Drug delivery distributors and suppliers
- Research institutes
- Health insurance payers
- Market research and consulting firms
To know about the assumptions considered for the study, download the pdf brochure
Scope of the Report
This report covers the North American drug delivery technologies market by route of administration, end user, and country.
North American Drug Delivery Technologies Market, by Route of Administration
-
Oral Drug Delivery
-
Solid
- Tablets
- Capsules
- Powders
- Pills
-
Liquid
- Solutions
- Syrups
-
Semi-solid
- Gels
- Emulsions
- Elixirs
-
Solid
-
Pulmonary Drug Delivery
- Metered Dose Inhalers
- Dry Powder Inhalers
-
Nebulizers
- Jet Nebulizers
- Ultrasonic Nebulizers
- Soft Mist Nebulizers
-
Injectable Drug Delivery
-
Devices
-
Conventional Injectables
-
By Material
- Glass Syringes
- Plastic Syringes
-
By Product
- Fillable Syringes
- Prefilled Syringes
-
By Usability
- Reusable Syringes
- Disposable Syringes
-
By Material
-
Self-injectors
- Needle-free Devices
- Pen Injectors
- Autoinjectors
- Wearable Injectors
- Other Devices
-
Conventional Injectables
-
Formulations
- Conventional Drug Delivery
- Novel Drug Delivery
- Long-acting Drug Delivery
-
Devices
-
Ocular Drug Delivery
-
Formulations
-
Liquid
- Eye Drops
- Liquid Sprays
-
Semi-solid
- Gels
- Ointments
-
Liquid
-
Devices
- Contact Lenses Coated with Drugs
- Ocular Inserts
-
Formulations
-
Nasal Drug Delivery
- Nasal Drops
- Nasal Sprays
- Nasal Powders
- Nasal Gels
-
Topical Drug Delivery
-
Liquid
- Solutions
- Suspensions
-
Semi-solid
- Creams
- Gels
- Ointments
- Lotions
-
Solid
- Suppositories
- Powders
-
Transdermal Drug Delivery
- Transdermal Patches
- Transdermal Gels
-
Liquid
-
Implantable Drug Delivery
- Active
- Passive
-
Transmucosal Drug Delivery
-
Oral
- Buccal
- Sublingual
-
Other
- Rectal
- Vaginal
-
Oral
North American Drug Delivery Technologies Market, by End User
- Hospitals
- Home Care Settings
- Ambulatory Surgical Centers/Clinics
- Other End Users
North American Drug Delivery Technologies Market, by Country
- U.S.
- Canada
Available Customizations
With the given market data, MarketsandMarkets offers customizations as per the company‘s specific needs.
The following customization options are available for the report:
Company Information
Detailed analysis and profiling of additional market players (up to 5)
The North American drug delivery technologies market is projected to reach USD 758.7 Billion by 2021 from USD 520.0 Billion in 2016, at a CAGR of 6.5% during the forecast period. Factors such as rising prevalence of chronic diseases, growth in the biologics market, funding initiatives for drug delivery research, and technological advancements are driving the growth of the North American drug delivery technologies market. However, risk of needlestick injuries and side effects related to drugs are expected to restrain the growth of this market in the coming years.
Based on the route of administration, the North American drug delivery technologies market is segmented into oral, pulmonary, injectable, ocular, nasal, topical, implantable, and transmucosal drug delivery. The topical drug delivery market is expected to grow at the highest CAGR during the forecast period. The high growth in this segment is attributed to the advantages of topical drugs, such as convenience and ease of use, right dosage to the right place, painless application, noninvasive nature, superior spreadability, and enhanced patient compliance.
On the basis of type, the oral drug delivery technologies market is segmented into solid, liquid, and semi-solid drug delivery. Solid oral drug delivery is segmented into tablets, capsules, pills, and powders. In 2016, tablets are estimated to account for the largest share of the solid oral drug delivery market. High patient compliance and acceptability are the major factors driving the growth of this market segment.
The injectable drug delivery market is segmented into two broad categories, namely, devices and formulations. Devices are further subsegmented into conventional and self-injectors, while formulations are further categorized into conventional, novel, and long-acting. In 2016, novel drug delivery formulations are expected to account for the largest share of the formulations market. Enhanced efficacy, increased patient compliance by decreasing dose frequency, and targeted drug delivery (which reduces side effects) are some of the key factors driving the growth of this market segment.
Topical drug delivery is segmented into solid, liquid, semi-solid, and transdermal drug delivery. Transdermal drug delivery is expected to register the highest CAGR during the forecast period. The noninvasive nature of this drug delivery system, feasibility of self-administration, and improved patient compliance are the major factors driving the growth of the transdermal drug delivery market.
Based on end users, the drug delivery technologies market in North America is segmented into hospitals, ambulatory surgical centers (ASCs)/clinics, home care settings, and other end users. The home care settings segment is expected to register the highest CAGR during the forecast period. Improving patient acceptability, patient awareness, and the need for comfortable usability have increased the use of drug delivery systems in home care settings, thus contributing to the growth of this end-user segment.
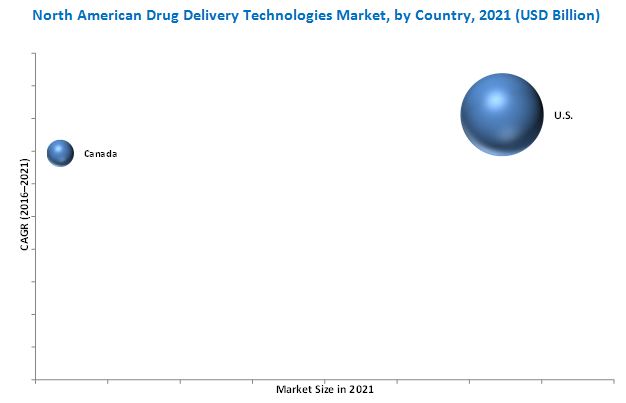
The North American drug delivery technologies market is segmented into the U.S. and Canada. The U.S. is expected to continue to dominate the market during the forecast period. The large share of the U.S. in the North American market can primarily be attributed to factors such as rising prevalence of chronic diseases; rapid growth in the geriatric population; growth in the biologics market; and increasing number of regulatory approvals, new product launches, and technological advancements.
Key players in this market include Johnson & Johnson, Inc. (U.S.), Merck & Co. Inc. (U.S.), Novartis AG (Switzerland), Bayer AG (Germany), 3M Company (U.S.), F. Hoffmann-La Roche (Switzerland), Becton, Dickinson and Company (U.S.), GlaxoSmithKline (U.K.), Pfizer, Inc. (U.S.), Antares Pharma (U.S.), and Sanofi (France).
To speak to our analyst for a discussion on the above findings, click Speak to Analyst
 Exclusive indicates content/data unique to MarketsandMarkets and not available with any competitors.
Table of Contents
1 Introduction (Page No. - 21)
1.1 Objectives of the Study
1.2 Market Definition
1.3 Market Scope
1.3.1 Markets Covered
1.3.2 Years Considered for the Study
1.4 Currency
1.5 Limitations
1.6 Market Stakeholders
2 Research Methodology (Page No. - 26)
2.1 Market Size Estimation
2.2 Market Breakdown and Data Triangulation
2.3 Key Data From Secondary Sources
2.4 Key Data From Primary Sources
2.5 Key Industry Insights
2.6 Assumptions for the Study
3 Executive Summary (Page No. - 34)
4 Premium Insights (Page No. - 41)
4.1 North American Drug Delivery Technologies Market
4.2 North American Drug Delivery Technologies Market, By Route of Administration
4.3 North American Oral Drug Delivery Market, By Type
4.4 North American Pulmonary Drug Delivery Market, By Type
4.5 North American Injectable Drug Delivery Market, By Type
4.6 North American Ocular Drug Delivery Market, By Type
4.7 North American Nasal Drug Delivery Market, By Type
4.8 North American Topical Drug Delivery Market, By Type
4.9 North American Implantable Drug Delivery Market, By Type
4.10 North American Transmucosal Drug Delivery Market, By Type
4.11 North American Drug Delivery Technologies Market, By End User
4.12 North American Drug Delivery Technologies Market: Geographic Mix
5 Market Overview (Page No. - 48)
5.1 Introduction
5.2 Market Dynamics
5.2.1 Market Drivers
5.2.1.1 Rising Prevalence of Chronic Diseases
5.2.1.2 Launch of New Products in the Market
5.2.1.3 Technological Advancements
5.2.1.4 Growth in the Biologics Market
5.2.1.5 Funding Initiatives for Drug Delivery Research
5.2.2 Market Restraints
5.2.2.1 Risk of Needlestick Injuries and Side Effects Related to Drugs
5.2.3 Market Opportunities
5.2.3.1 Self-Administration and Home Care Drug Delivery
5.2.3.2 Rising Demand for Biosimilars and Generic Drugs
5.2.3.2.1 Biosimilars
5.2.3.2.2 Generic Drugs
5.2.3.3 Collaborations/Partnerships Among Companies
5.2.3.4 Improving the Bioavailability of Drugs
5.2.4 Market Challenges
5.2.4.1 Product Recalls
5.2.4.2 Patent Expiry and Patent Cliffs
5.2.5 Stringent Regulatory Approval Process
6 Regulatory Environment (Page No. - 61)
6.1 Introduction
6.2 Drug Approval
6.3 Device Approval
7 North American Drug Delivery Technologies Market, By Route of Administration (Page No. - 64)
7.1 Introduction
7.2 Oral Drug Delivery
7.2.1 Solid Oral Drugs
7.2.1.1 Tablets
7.2.1.2 Capsules
7.2.1.3 Pills
7.2.1.4 Powders
7.2.2 Liquid Oral Drugs
7.2.2.1 Syrups
7.2.2.2 Solutions
7.2.3 Semi-Solid Oral Drugs
7.2.3.1 Gels
7.2.3.2 Emulsions
7.2.3.3 Elixirs
7.3 Pulmonary Drug Delivery
7.3.1 Metered-Dose Inhalers
7.3.2 Dry Powder Inhalers
7.3.3 Nebulizers
7.3.3.1 Jet Nebulizers
7.3.3.2 Ultrasonic Nebulizers
7.3.3.3 Soft Mist Nebulizers
7.4 Injectable Drug Delivery
7.4.1 Injectable Drug Delivery Formulations
7.4.1.1 Novel Drug Delivery Formulations
7.4.1.2 Conventional Drug Delivery Formulations
7.4.1.3 Long-Acting Drug Delivery Formulations
7.4.2 Injectable Drug Delivery Devices
7.4.2.1 Conventional Injection Devices
7.4.2.1.1 Conventional Injection Devices, By Material
7.4.2.1.1.1 Glass
7.4.2.1.1.2 Plastic
7.4.2.1.2 Conventional Injection Devices, By Product
7.4.2.1.2.1 Fillable Syringes
7.4.2.1.2.2 Prefilled Syringes
7.4.2.1.3 Conventional Injection Devices, By Usability
7.4.2.1.3.1 Disposable Syringes
7.4.2.1.3.2 Reusable Syringes
7.4.2.2 Self-Injection Devices
7.4.2.3 Needle-Free Injectors
7.4.2.4 Wearable Injectors
7.4.2.5 Pen Injectors
7.4.2.6 Autoinjectors
7.4.3 Other Devices
7.5 Ocular Drug Delivery
7.5.1 Ocular Drug Delivery Formulations
7.5.1.1 Liquid Drug Delivery
7.5.1.1.1 Eye Drops
7.5.1.1.2 Liquid Sprays
7.5.1.2 Semi-Solid Drug Delivery
7.5.1.2.1 Gels
7.5.1.2.2 Eye Ointments
7.5.2 Ocular Drug Delivery Devices
7.5.2.1 Ocular Inserts
7.5.2.2 Contact Lenses Coated With Drugs
7.6 Nasal Drug Delivery
7.6.1 Nasal Sprays
7.6.2 Nasal Drops
7.6.3 Nasal Gels
7.6.4 Nasal Powders
7.7 Topical Drug Delivery
7.7.1 Semi-Solid Topical Drug Delivery
7.7.1.1 Creams
7.7.1.2 Gels
7.7.1.3 Ointments
7.7.1.4 Lotions
7.7.2 Transdermal Drug Delivery
7.7.2.1 Transdermal Patches
7.7.2.2 Transdermal Gels
7.7.3 Liquid Topical Drug Delivery
7.7.3.1 Solutions
7.7.3.2 Suspensions
7.7.4 Solid Topical Drug Formulations
7.7.4.1 Powders
7.7.4.2 Suppositories
7.8 Implantable Drug Delivery
7.8.1 Passive Implantable Drug Delivery
7.8.2 Active Implantable Drug Delivery
7.9 Transmucosal Drug Delivery
7.9.1 Oral Transmucosal Drug Delivery
7.9.1.1 Buccal Drug Delivery
7.9.1.2 Sublingual Drug Delivery
7.9.2 Other Transmucosal Drug Delivery
7.9.2.1 Rectal Transmucosal Drug Delivery
7.9.2.2 Vaginal Transmucosal Drug Delivery
8 North American Drug Delivery Technologies Market, By End User (Page No. - 141)
8.1 Introduction
8.2 Hospitals
8.3 Ambulatory Surgical Centers/Clinics
8.4 Home Care Settings
8.5 Other End Users
9 North American Drug Delivery Technologies Market, By Country (Page No. - 147)
9.1 Introduction
9.2 U.S.
9.3 Canada
10 Competitive Landscape (Page No. - 192)
10.1 Overview
10.2 Market Evolution Framework
10.3 Market Share Analysis
10.4 Competitive Situations and Trends
10.4.1 New Product Launches and Product Approvals
10.4.2 Partnerships, Agreements, and Collaborations
10.4.3 Acquisitions
10.4.4 Expansions
10.4.5 Other Strategies
11 Company Profiles (Page No. - 201)
(Overview, Products and Services, Financials, Strategy & Development)*
11.1 Johnson & Johnson Services, Inc.
11.2 Novartis AG
11.3 F. Hoffmann-La Roche Ltd.
11.4 Pfizer, Inc.
11.5 Bayer AG
11.6 Antares Pharma, Inc.
11.7 Becton, Dickinson and Company
11.8 Glaxosmithkline PLC
11.9 3M Company
11.10 Merck & Co., Inc.
11.11 Sanofi
*Details on Overview, Products and Services, Financials, Strategy & Development Might Not Be Captured in Case of Unlisted Companies.
12 Appendix (Page No. - 249)
12.1 Industry Insights
12.2 Discussion Guide
12.3 Other Recent Developments
12.4 Knowledge Store: Marketsandmarkets’ Subscription Portal
12.5 Introducing RT: Real-Time Market Intelligence
12.6 Available Customizations
12.7 Related Reports
List of Tables (206 Tables)
Table 1 New Product Launches
Table 2 Indicative List of Biologics That Gained U.S. FDA Approval in 2015–2016
Table 3 Funding Initiatives for Drug Delivery Research
Table 4 Rising Incidence of Chronic Diseases is A Major Factor Driving Market Growth
Table 5 Risk of Needlestick Injuries and Side Effects Related to Drugs Form A Major Factor Restraining Market Growth
Table 6 Indicative List of Generic Drugs That Gained U.S. FDA in 2016
Table 7 Collaborations/Partnerships
Table 8 Self-Administration and Home Care Drug Delivery to Provide Significant Growth Opportunities
Table 9 Product Recalls (2013–2015)
Table 10 Patent Expiry of Drugs, 2014–2015
Table 11 Product Recalls are A Significant Challenge for Market Growth
Table 12 North America: Drug Delivery Technologies Market Size, By Route of Administration, 2014–2021 (USD Billion)
Table 13 North America: Oral Drug Delivery Market Size, By Type, 2014–2021 (USD Billion)
Table 14 North America: Solid Oral Drug Delivery Market Size, By Type, 2014–2021 (USD Billion)
Table 15 North America: Tablets Market Size, By Country, 2014–2021 (USD Billion)
Table 16 North America: Capsules Market Size, By Country, 2014–2021 (USD Billion)
Table 17 North America: Pills Market Size, By Country, 2014–2021 (USD Billion)
Table 18 North America: Powders Market Size, By Country, 2014–2021 (USD Billion)
Table 19 North America: Liquid Oral Drug Delivery Market Size, By Type, 2014–2021 (USD Billion)
Table 20 North America: Syrups Market Size, By Country, 2014–2021 (USD Billion)
Table 21 North America: Solutions Market Size, By Country, 2014–2021 (USD Billion)
Table 22 North America: Semi-Solid Oral Drug Delivery Market Size, By Type, 2014–2021 (USD Billion)
Table 23 North America: Gels Market Size, By Country, 2014–2021 (USD Billion)
Table 24 North America: Emulsions Market Size, By Country, 2014–2021 (USD Billion)
Table 25 North America: Elixirs Market Size, By Country, 2014–2021 (USD Billion)
Table 26 North America: Pulmonary Drug Delivery Market Size, By Type, 2014–2021 (USD Billion)
Table 27 North America: Metered-Dose Inhalers Market Size, By Country, 2014–2021 (USD Billion)
Table 28 North America: Dry Powder Inhalers Market Size, By Country, 2014–2021 (USD Billion)
Table 29 North America: Nebulizers Market Size, By Country, 2014–2021 (USD Billion)
Table 30 North America: Nebulizers Market Size, By Type, 2014–2021 (USD Billion)
Table 31 North America: Jet Nebulizers Market Size, By Country, 2014–2021 (USD Billion)
Table 32 North America: Ultrasonic Nebulizers Market Size, By Country, 2014–2021 (USD Billion)
Table 33 North America: Soft Mist Nebulizers Market Size, By Country, 2014–2021 (USD Billion)
Table 34 North America: Injectable Drug Delivery Market Size, By Type, 2014–2021 USD (Billion)
Table 35 North America: Injectable Drug Delivery Formulations, By Type, 2014–2021 (USD Billion)
Table 36 Examples of Commercially Available Novel Drug Delivery Formulations
Table 37 North America: Novel Drug Delivery Formulations Market Size, By Country, 2014–2021 (USD Billion)
Table 38 North America: Conventional Drug Delivery Formulations Market Size, By Country, 2014–2021 (USD Billion)
Table 39 North America: Long-Acting Drug Delivery Formulations Market Size, By Country, 2014–2021 (USD Billion)
Table 40 North America: Injectable Drug Delivery Devices Market Size, By Type, 2014–2021 (USD Billion)
Table 41 North America: Conventional Injection Devices Market Size, By Material, 2014–2021 (USD Billion)
Table 42 North America: Glass Conventional Injection Devices Market Size, By Country, 2014–2021 (USD Billion)
Table 43 North America: Plastic Conventional Injection Devices Market Size, By Country, 2014–2021 (USD Billion)
Table 44 North America: Conventional Injection Devices Market Size, By Product, 2014–2021 (USD Billion)
Table 45 North America: Fillable Syringes Market Size, By Country, 2014–2021 (USD Billion)
Table 46 North America: Conventional Injection Devices Market Size, By Usability, 2014–2021 (USD Billion)
Table 47 North America: Disposable Syringes Market Size, By Country, 2014–2021 (USD Billion)
Table 48 North America: Reusable Syringes Market Size, By Country, 2014–2021 (USD Billion)
Table 49 North America: Self-Injection Devices Market Size, By Type, 2014–2021 (USD Billion)
Table 50 North America: Needle-Free Injectors Market Size, By Country, 2014–2021 (USD Billion)
Table 51 North America: Wearable Injectors Market Size, By Country, 2014–2021 (USD Billion)
Table 52 Examples of Commercially Available Pen Injectors
Table 53 North America: Pen Injectors Market Size, By Country, 2014–2021 (USD Billion)
Table 54 Autoinjectors: Recent New Product Launches and U.S. FDA Approvals
Table 55 Examples of Commercially Available Autoinjectors
Table 56 North America: Autoinjectors Market Size, By Country, 2014–2021 (USD Billion)
Table 57 North America: Other Devices Market Size, By Country, 2014–2021 (USD Billion)
Table 58 North America: Ocular Drug Delivery Market Size, By Type, 2014–2021 (USD Billion)
Table 59 North America: Ocular Drug Delivery Formulations Market Size, By Type, 2014–2021 (USD Billion)
Table 60 North America: Liquid Ocular Drug Delivery Market Size, By Type, 2014–2021 (USD Billion)
Table 61 Examples of Commercially Available Eye Drops
Table 62 North America: Eye Drops Market Size By Country, 2014–2021 (USD Billion)
Table 63 North America: Liquid Sprays Market Size, By Country, 2014–2021 (USD Billion)
Table 64 North America: Semi-Solid Ocular Drug Delivery Market Size, By Type, 2014–2021 (USD Billion)
Table 65 North America: Gels Market Size By Country, 2014–2021 (USD Billion)
Table 66 North America: Eye Ointments Market Size, By Country, 2014–2021 (USD Billion)
Table 67 North America: Ocular Drug Delivery Devices Market Size, By Type, 2014–2021 (USD Billion)
Table 68 North America: Ocular Inserts Market Size, By Country, 2014–2021 (USD Billion)
Table 69 North America: Contact Lenses Coated With Drugs Market Size, By Country, 2014–2021 (USD Billion)
Table 70 North America: Nasal Drug Delivery Market Size, By Type, 2014–2021 (USD Billion)
Table 71 Nasal Sprays: Recent New Product Launches and Approvals
Table 72 North America: Nasal Sprays Market Size, By Country, 2014–2021 (USD Billion)
Table 73 North America: Nasal Drops Market Size, By Country, 2014–2021 (USD Billion)
Table 74 North America: Nasal Gels Market Size, By Country, 2014–2021 (USD Billion)
Table 75 North America: Nasal Powders Market Size By Country, 2014–2021 (USD Billion)
Table 76 North America: Topical Drug Delivery Market Size, By Type, 2014–2021 (USD Billion)
Table 77 North America: Semi-Solid Topical Drug Delivery Market Size, By Type, 2014–2021 (USD Billion)
Table 78 North America: Creams Market Size, By Country, 2014–2021 (USD Billion)
Table 79 North America: Gels Market Size, By Country, 2014–2021 (USD Billion)
Table 80 North America: Ointments Market Size , By Country, 2014–2021 (USD Billion)
Table 81 North America: Lotions Market Size, By Country, 2014–2021 (USD Billion)
Table 82 North America: Transdermal Drug Delivery Market Size, By Type, 2014–2021 (USD Billion)
Table 83 North America: Transdermal Patches Market Size, By Country, 2014–2021 (USD Billion)
Table 84 North America: Transdermal Gels Market Size, By Country, 2014–2021 (USD Billion)
Table 85 North America: Liquid Topical Drug Delivery Market Size, By Type, 2014–2021 (USD Billion)
Table 86 North America: Solutions Market Size, By Country, 2014–2021 (USD Billion)
Table 87 North America: Suspensions Market Size, By Country, 2014–2021 (USD Billion)
Table 88 North America: Solid Topical Drug Delivery Market Size, By Type, 2014–2021 (USD Billion)
Table 89 North America: Powders Market Size, By Country, 2014–2021 (USD Billion)
Table 90 North America: Suppositories Market Size, By Country, 2014–2021 (USD Billion)
Table 91 North America: Implantable Drug Delivery, By Type, 2014–2021 (USD Billion)
Table 92 North America: Passive Implantable Drug Delivery, By Country, 2014–2021 (USD Billion)
Table 93 North America: Active Implantable Drug Delivery Market Size, By Country, 2014–2021 (USD Billion)
Table 94 North America: Transmucosal Drug Delivery Market Size, By Type, 2014–2021 (USD Billion)
Table 95 North America: Oral Transmucosal Drug Delivery Market Size, By Type, 2014–2021 (USD Billion)
Table 96 North America: Buccal Drug Delivery Market Size, By Country, 2014–2021 (USD Billion)
Table 97 North America: Sublingual Drug Delivery Market Size, By Country, 2014–2021 (USD Billion)
Table 98 North America: Other Transmucosal Drug Delivery Market Size, By Type, 2014–2021 (USD Billion)
Table 99 North America: Rectal Transmucosal Drug Delivery Market Size, By Country, 2014–2021 (USD Billion)
Table 100 North America: Vaginal Transmucosal Drug Delivery Market Size, By Country, 2014–2021 (USD Billion)
Table 101 North America: Drug Delivery Technologies Market Size, By End User, 2014–2021 (USD Billion)
Table 102 North America: Drug Delivery Market Size for Hospitals, By Country, 2014-2021 (USD Billion)
Table 103 North America: Drug Delivery Market Size for Ambulatory Surgical Centers/Clinics, By Country, 2014–2021 (USD Billion)
Table 104 North America: Drug Delivery Market Size for Home Care, By Country, 2014–2021 (USD Billion)
Table 105 North America: Drug Delivery Market Size for Other End Users, By Country, 2014–2021 (USD Billion)
Table 106 North America: Drug Delivery Technologies Market Size, By Country, 2014–2021 (USD Billion)
Table 107 North America: Drug Delivery Technologies Market Size, By Route of Administration, 2014–2021 (USD Billion)
Table 108 North America: Oral Drug Delivery Market Size, By Dosage Form, 2014–2021 (USD Billion)
Table 109 North America: Solid Oral Drug Delivery Market Size, By Dosage Form, 2014–2021 (USD Billion)
Table 110 North America: Liquid Oral Drug Delivery Market Size, By Dosage Form, 2014–2021 (USD Billion)
Table 111 North America: Semi-Solid Oral Drug Delivery Market Size, By Dosage Form, 2014–2021 (USD Billion)
Table 112 North America: Pulmonary Drug Delivery Market Size, By Type, 2014–2021 (USD Billion)
Table 113 North America: Nebulizers Market Size, By Type, 2014–2021 (USD Billion)
Table 114 North America: Injectable Drug Delivery Market Size, By Type, 2014–2021 (USD Billion)
Table 115 North America: Injectable Drug Delivery Formulations Market Size, By Type, 2014–2021 (USD Billion)
Table 116 North America: Injectable Drug Delivery Devices Market Size, By Type, 2014–2021 (USD Billion)
Table 117 North America: Conventional Injection Devices Market Size, By Material, 2014–2021 (USD Billion)
Table 118 North America: Conventional Injection Devices Market Size, By Usability, 2014–2021 (USD Billion)
Table 119 North America: Conventional Injection Devices Market Size, By Product, 2014–2021 (USD Billion)
Table 120 North America: Self-Injection Devices Market Size, By Type, 2014–2021 (USD Billion)
Table 121 North America: Ocular Drug Delivery Market Size, By Type, 2014–2021 (USD Billion)
Table 122 North America: Ocular Drug Delivery Formulations Market Size, By Type, 2014–2021 (USD Billion)
Table 123 North America: Liquid Ocular Formulations Market Size, By Type, 2014–2021 (USD Billion)
Table 124 North America: Semi-Solid Ocular Formulations Market Size, By Type, 2014–2021 (USD Billion)
Table 125 North America: Ocular Drug Delivery Devices Market Size, By Type, 2014–2021 (USD Billion)
Table 126 North America: Nasal Drug Delivery Market Size, By Type, 2014–2021 (USD Billion)
Table 127 North America: Topical Drug Delivery Market Size, By Dosage Form, 2014–2021 (USD Billion)
Table 128 North America: Liquid Topical Drug Delivery Market Size, By Type, 2014–2021 (USD Billion)
Table 129 North America: Semi-Solid Topical Drug Delivery Market Size, By Type, 2014–2021 (USD Billion)
Table 130 North America: Solid Topical Drug Delivery Market Size, By Type, 2014–2021 (USD Billion)
Table 131 North America: Transdermal Drug Delivery Market Size, By Type, 2014–2021 (USD Billion)
Table 132 North America: Implantable Drug Delivery Market Size, By Type, 2014–2021 (USD Billion)
Table 133 North America: Transmucosal Drug Delivery Market Size, By Type, 2014–2021 (USD Billion)
Table 134 North America: Other Transmucosal Drug Delivery Market Size, By Type, 2014–2021 (USD Billion)
Table 135 North America: Drug Delivery Technologies Market Size, By End User, 2014–2021 (USD Billion)
Table 136 Recent FDA Approvals for Drug Delivery Products
Table 137 Conferences & Symposia for Drug Delivery Technologies
Table 138 U.S.: Drug Delivery Technologies Market Size, By Route of Administration, 2014–2021 (USD Billion)
Table 139 U.S.: Oral Drug Delivery Market Size, By Dosage Form, 2014–2021 (USD Million)
Table 140 U.S.: Solid Oral Drug Delivery Market Size, By Dosage Form, 2014–2021 (USD Billion)
Table 141 U.S.: Liquid Oral Drug Delivery Market Size, By Type, 2014–2021 (USD Billion)
Table 142 U.S.: Semi-Solid Oral Drug Delivery Market Size, By Type, 2014–2021 (USD Billion)
Table 143 U.S.: Pulmonary Drug Delivery Market Size, By Type, 2014–2021 (USD Billion)
Table 144 U.S.: Nebulizers Market Size, By Type, 2014–2021 (USD Billion)
Table 145 U.S.: Injectable Drug Delivery Market Size, By Type, 2014–2021 (USD Billion)
Table 146 U.S.: Injectable Drug Delivery Formulations Market Size, By Type, 2014–2021 (USD Billion)
Table 147 U.S.: Injectable Drug Delivery Devices Market Size, By Type, 2014–2021 (USD Billion)
Table 148 U.S.: Conventional Injection Devices Market Size, By Material, 2014–2021 (USD Billion)
Table 149 U.S.: Conventional Injection Devices Market Size, By Usability, 2014–2021 (USD Billion)
Table 150 U.S.: Conventional Injection Devices Market Size, By Product, 2014–2021 (USD Billion)
Table 151 U.S.: Self-Injection Devices Market Size, By Type, 2014–2021 (USD Billion)
Table 152 U.S.: Ocular Drug Delivery Market Size, By Type, 2014–2021 (USD Billion)
Table 153 U.S.: Ocular Drug Delivery Market Size, By Formulation, 2014–2021 (USD Billion)
Table 154 U.S.: Liquid Ocular Formulations Market Size, By Type, 2014–2021 (USD Billion)
Table 155 U.S.: Semi-Solid Ocular Formulations Market Size, By Type, 2014–2021 (USD Billion)
Table 156 U.S.: Ocular Drug Delivery Market Size, By Device Type, 2014–2021 (USD Billion)
Table 157 U.S.: Nasal Drug Delivery Market Size, By Type, 2014–2021 (USD Billion)
Table 158 U.S.: Topical Drug Delivery Market Size, By Type, 2014–2021 (USD Billion)
Table 159 U.S.: Liquid Topical Drug Delivery Market Size, By Type, 2014–2021 (USD Billion)
Table 160 U.S.: Semi-Solid Topical Drug Delivery Market Size, By Type, 2014–2021 (USD Billion)
Table 161 U.S.: Solid Topical Drug Delivery Market Size, By Dosage Form, 2014–2021 (USD Billion)
Table 162 U.S.: Transdermal Drug Delivery Market Size, By Dosage Form, 2014–2021 (USD Billion)
Table 163 U.S.: Implantable Drug Delivery Market Size, By Type, 2014–2021 (USD Billion)
Table 164 U.S.: Transmucosal Drug Delivery Market Size, By Type, 2014–2021 (USD Billion)
Table 165 U.S.: Oral Transmucosal Drug Delivery Market Size, By Type, 2014–2021 (USD Billion)
Table 166 U.S.: Other Transmucosal Drug Delivery Market Size, By Type, 2014–2021 (USD Billion)
Table 167 U.S.: Drug Delivery Technologies Market Size, By End User, 2014–2021 (USD Billion)
Table 168 Canada: Drug Delivery Technologies Market Size, By Route of Administration, 2014–2021 (USD Billion)
Table 169 Canada: Oral Drug Delivery Market Size, By Dosage Form, 2014–2021 (USD Billion)
Table 170 Canada: Solid Oral Drug Delivery Market Size, By Dosage Form, 2014–2021 (USD Billion)
Table 171 Canada: Liquid Oral Drug Delivery Market Size, By Dosage Form, 2014–2021 (USD Billion)
Table 172 Canada: Semi-Solid Oral Drug Delivery Market Size, By Dosage Form, 2014–2021 (USD Billion)
Table 173 Canada: Pulmonary Drug Delivery Market Size, By Type, 2014–2021 (USD Billion)
Table 174 Canada: Nebulizers Market Size, By Type, 2014–2021 (USD Billion)
Table 175 Canada: Injectable Drug Delivery Market Size, By Type, 2014–2021 (USD Billion)
Table 176 Canada: Injectable Drug Delivery Formulations Market Size, By Type, 2014–2021 (USD Billion)
Table 177 Canada: Injectable Drug Delivery Devices Market Size, By Type, 2014–2021 (USD Billion)
Table 178 Canada: Conventional Injection Devices Market Size, By Material, 2014–2021 (USD Billion)
Table 179 Canada: Conventional Injection Devices Market Size, By Usability, 2014–2021 (USD Billion)
Table 180 Canada: Conventional Injection Devices Market Size, By Product, 2014–2021 (USD Billion)
Table 181 Canada: Self-Injection Devices Market Size, By Type, 2014–2021 (USD Billion)
Table 182 Canada: Ocular Drug Delivery Market Size, By Type, 2014–2021 (USD Billion)
Table 183 Canada: Ocular Drug Delivery Formulations Market Size, By Type, 2014–2021 (USD Billion)
Table 184 Canada: Liquid Ocular Drug Delivery Market Size, By Type, 2014–2021 (USD Billion)
Table 185 Canada: Semi-Solid Ocular Drug Delivery Market Size, By Type, 2014–2021 (USD Billion)
Table 186 Canada: Ocular Drug Delivery Devices Market Size, By Type, 2014–2021 (USD Billion)
Table 187 Canada: Nasal Drug Delivery Market Size, By Type, 2014-2021 (USD Billion)
Table 188 Canada: Topical Drug Delivery Market Size, By Type, 2014–2021 (USD Billion)
Table 189 Canada: Liquid Topical Drug Delivery Market Size, By Type, 2014-2021 (USD Billion)
Table 190 Canada: Semi-Solid Topical Drug Delivery Market Size, By Type, 2014–2021 (USD Billion)
Table 191 Canada: Solid Topical Drug Delivery Market Size, By Type, 2014-2021 (USD Billion)
Table 192 Canada: Transdermal Drug Delivery Market Size, By Type, 2014–2021 (USD Billion)
Table 193 Canada: Implantable Drug Delivery Market Size, By Type, 2014-2021 (USD Billion)
Table 194 Canada: Transmucosal Drug Delivery Market Size, By Type, 2014-2021 (USD Billion)
Table 195 Canada: Oral Transmucosal Drug Delivery Market Size, By Type, 2014-2021 (USD Billion)
Table 196 Canada: Other Transmucosal Drug Delivery Market Size, By Type, 2014-2021 (USD Billion)
Table 197 Canada: Drug Delivery Technologies Market Size, By End User, 2014-2021 (USD Billion)
Table 198 Recent New Product Launches and Product Approvals
Table 199 Recent Partnerships, Agreements, and Collaborations
Table 200 Recent Acquisitions
Table 201 Recent Expansions
Table 202 Other Strategies
Table 203 Exchange Rates (Utilized for the Conversion of CHF to USD)
Table 204 Exchange Rate (Utilized for the Conversion of EUR to USD)
Table 205 Exchange Rate (Utilized for the Conversion of GBP to USD)
Table 206 Exchange Rate (Utilized for the Conversion of EUR to USD)
List of Figures (57 Figures)
Figure 1 Research Design
Figure 2 Market Size Estimation Methodology: Bottom-Up Approach
Figure 3 Market Size Estimation Methodology: Top-Down Approach
Figure 4 Breakdown of Primary Interviews: By Company Type, Designation, and Country
Figure 5 Data Triangulation Methodology
Figure 6 North American Drug Delivery Technologies Market, By Route of Administration (2016–2021): Topical Drug Delivery to Offer Significant Growth Opportunities During the Forecast Period
Figure 7 Tablets to Command the Largest Share of the Solid Oral Drug Delivery Market in 2016
Figure 8 Novel Drug Delivery Formulations to Dominate the Injectable Drug Delivery Formulations Market During the Forecast Period
Figure 9 Transdermal Drug Delivery to Register the Highest CAGR in the Topical Drug Delivery Market
Figure 10 Hospitals to Form the Largest End-User Segment of the North American Drug Delivery Market
Figure 11 The U.S. to Witness High Growth in the North American Drug Delivery Technologies Market During the Forecast Period
Figure 12 Rising Prevalence of Chronic Diseases and Growing Geriatric Population: Key Market Drivers
Figure 13 Topical Drug Delivery Segment to Register the Highest CAGR During the Forecast Period
Figure 14 Solid Oral Drug Delivery to Register the Highest CAGR During the Forecast Period
Figure 15 Metered Dose Inhalers to Dominate the Market During the Forecast Period
Figure 16 Injectable Formulations to Dominate the Market During the Forecast Period
Figure 17 Ocular Devices to Register the Highest CAGR During the Forecast Period
Figure 18 Nasal Sprays to Dominate the Market During the Forecast Period
Figure 19 Semi-Solid Dosage Forms to Dominate the Market During the Forecast Period
Figure 20 Passive Implantable Drug Delivery Segment to Register the Highest CAGR During the Forecast Period
Figure 21 Oral Transmucosal Drug Delivery to Register the Highest CAGR During the Forecast Period
Figure 22 Hospitals to Form the Largest End-User Segment During the Forecast Period
Figure 23 The U.S. to Dominate the North American Market During the Forecast Period
Figure 24 North American Drug Delivery Technologies Market: Drivers, Restraints, Opportunities, and Challenges
Figure 25 Topical Drug Delivery Segment to Register Highest Growth During the Forecast Period (2016–2021)
Figure 26 Oral Drug Delivery Market Segmentation
Figure 27 Solid Oral Drug Delivery to Dominate the Oral Drug Delivery Market in 2016
Figure 28 Pulmonary Drug Delivery Market Segmentation
Figure 29 Metered-Dose Inhalers to Dominate the Market During the Forecast Period
Figure 30 Injectable Drug Delivery Market Segmentation
Figure 31 Formulations to Witness Highest Growth in the Injectable Drug Delivery Market
Figure 32 Ocular Drug Delivery Market Segmentation
Figure 33 Ocular Drug Delivery Formulations to Dominate the Ocular Drug Delivery Market During the Forecast Period (2016–2021)
Figure 34 Nasal Drug Delivery Market Segmentation
Figure 35 Nasal Sprays to Dominate the Nasal Drug Delivery Market During Forecast Period
Figure 36 Topical Drug Delivery Market Segmentation
Figure 37 Transdermal Drug Delivery Segment to Register Highest Growth During the Forecast Period
Figure 38 Implantable Drug Delivery Market Segmentation
Figure 39 Passive Implantable Drug Delivery to Register Highest CAGR During the Forecast Period
Figure 40 Transmucosal Drug Delivery Market Segmentation
Figure 41 Oral Drug Delivery Segment to Dominate the Transmucosal Drug Delivery Market
Figure 42 Home Care Settings Segment to Witness High Growth During the Forecast Period (2016–2021)
Figure 43 North America: Drug Delivery Technologies Market Snapshot (2016)
Figure 44 Key Developments Adopted By Major Players Between 2013 & 2016
Figure 45 North American Drug Delivery Technologies Market Share Analysis, By Key Player (2015)
Figure 46 Battle for Market Share: New Product Launches and Product Approvals Was the Key Growth Strategy Adopted By Market Players
Figure 47 Johnson & Johnson Services, Inc.: Company Snapshot
Figure 48 Novartis AG: Company Snapshot
Figure 49 F. Hoffmann-La Roche Ltd.: Company Snapshot
Figure 50 Pfizer, Inc.: Company Snapshot
Figure 51 Bayer AG: Company Snapshot
Figure 52 Antares Pharma, Inc.: Company Snapshot
Figure 53 Becton, Dickinson and Company: Company Snapshot
Figure 54 Glaxosmithkline PLC: Company Snapshot
Figure 55 3M Company: Company Snapshot
Figure 56 Merck & Co., Inc.: Company Snapshot
Figure 57 Sanofi: Company Snapshot

 Generating Response ...


Growth opportunities and latent adjacency in North American Drug Delivery Technologies Market