Filter Market by Filter Type (Oil & Fuel), Fuel Type (Gasoline & Diesel), Vehicle Type (Passenger Car, LCV, HCV, & Off- Highway), Filter Media (Cellulose, Synthetic-Laminated, Pure glass), Market (OE & Aftermarket), & by Region - Global Forecast to 2020


[208 Pages Report] Oil and fuel filters are mandatory components in a vehicle. These filters have a limited life span, which has led to growing demand for them in both the OE market and the aftermarket. The global automotive OE oil and fuel filter market, in terms of value, is estimated to grow at a CAGR of 6.64% from 2015 to 2020. The growing demand for vehicles in the BRICS nations, increasingly stringent emission and efficiency regulations, and increase in the average miles travelled per year, and increasing vehicle parc are key factors driving the oil and fuel filter OE market as well as the aftermarket. Alternatively, the rising demand for electric vehicles and long drain intervals are hampering the growth of this market. Manufacturing economical filters with increased service life is the key challenge faced by players in the oil and fuel filter market.
Emerging economies like China, India, and Brazil are attractive markets for companies manufacturing oil and fuel filters. The demand for passenger cars and commercial vehicles is on the rise, owing to the increase in the per capita income of consumers in this region. Growing awareness regarding clean emission and favorable government policies are driving the demand for oil and fuel filters in developing economies. The passenger car segment is estimated to be the largest consumer of oil and fuel filters in the world, with a market share, in terms of value, of approximately 66%. Asia-Oceania is estimated to be the market leader, and accounts for a share, by value, of approximately 46% of the global automotive oil and fuel filter market.
In 2014, MANN+HUMMEL Group (Germany) held the leading position in the oil and fuel filter market. Over the past three years, the company has adopted expansion, new product launches, and strategic partnerships/agreements as its key business strategies to retain its position in this market. Affinia Group (U.S.), Ahlstrom Corporation (Finland), Fram/UCI (U.S.), Cummins Inc. (U.S.), Sogefi SpA (Italy), Donaldson Co. Inc. (U.S.), Mahle GmbH (Germany), Clarcor Inc. (U.S.) and Denso Corp. (Japan) are other key players in the global automotive oil and fuel filter market.
Scope of the Report
This research report categorizes the automotive oil and fuel filter market into the following segments and sub segments:
Global Automotive Filter Market
- Automotive Oil & Fuel Filter Market, By Type
- Oil Filter
- Fuel Filter
- Automotive Oil and Fuel Filter Aftermarket
- Vehicle Type
- Fuel Type
- Region
- Off-Highway Oil and Fuel Filter Market
- Agricultural tractor
- Fuel filter
- Oil filter
- Construction vehicle
- Fuel filter
- Oil filter
- Agricultural tractor
- Automotive Oil and Fuel Filter Market, by Media
- Cellulose Media
- Synthetic & Laminated Media
- Pure Glass Media
- Global Automotive Oil and Fuel Filter Market, by Region
- North America
- U.S.
- Canada
- Mexico
- Europe
- Germany
- U.K.
- France
- Rest of Europe
- Asia-Oceania
- China
- Japan
- India
- South Korea
- Rest of Asia-Pacific
- Rest of the World
- Brazil
- Russia
- Others
- North America
Global Automotive Oil & Fuel Filter Market, by Region, 2015 vs. 2020 ($Million)
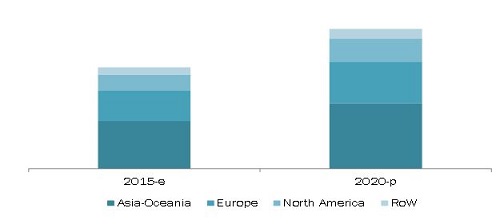
Source: MarketsandMarkets Analysis
The automotive oil and fuel filter market size is projected to grow at a CAGR of 6.64 % from 2015 to 2020 to reach $1,006.4 Million by 2020.
Automotive engine technologies around the world are becoming increasingly sophisticated, and supplying clean oil and fuel to these complex engines is a critical task. Oil and fuel filters are an integral part of modern automobiles, as they not only purify oil and fuel, but play a key role in engine efficiency and emissions. Stringent emission and fuel efficiency norms enforced by governments and legislative bodies around the world have compelled automotive manufacturers to seek various methods to meet these standards, thereby driving the demand for automotive oil and fuel filters.
The global automotive oil and fuel filter market size is projected to reach $1,006.4 Million by 2020. The automotive oil and fuel filter OE market is primarily driven by rising vehicle production levels and increasingly stringent emission regulations. Alternatively, demand for these filters in the aftermarket is triggered by the growing vehicle parc and increased vehicle miles travelled per year in all countries. Asia-Oceania is estimated to dominate the market, accounting for a market share of about 46% in 2015. China is the key contributor to the oil and fuel filter market in the Asia-Oceania region. The North American automotive oil and fuel filter market is projected to grow at the highest CAGR that is, 7.98% from 2015 to 2020. The European region is witnessing steady growth and is projected to grow at CAGR of 6.27% for the period under study.
The oil and fuel filter aftermarket is estimated to be dominated by diesel oil and fuel filters, with this market estimated to grow at a higher CAGR than the gasoline oil and fuel filter market. The primary reason for this trend is the short service life of diesel filters compared to gasoline filters. As of 2015, the share of replacement (aftermarket) oil and fuel filter in terms of value is estimated to be around 66% of the global automotive oil and fuel filter aftermarket. Filter manufacturers are currently working towards developing filters with increased service life of up to 30,000 kms.
This report covers the market for automotive oil and fuel filters based on filter type (oil and fuel), fuel type (gasoline and diesel), market type (OE and aftermarket), filter media (cellulose, synthetic & laminated, pure glass), vehicle type (passenger cars, LCVs, HCVs, and off-highway), and region (Asia-Oceania, Europe, North America and the Rest of the World). Key manufacturers in the automotive oil and fuel filter market are Mann+Hummel (Germany), Affinia Group (U.S.), Ahlstrom Corporation (Finland), Cummins Inc. (U.S.), Sogefi SpA (Italy), Donaldson Co. Inc. (U.S.), Mahle GmbH (Germany), Clarcor Inc. (U.S.) and Denso Corp. (Japan).
Automotive OE Oil & Fuel Filter Market Size, by Filter Type, 2015 vs. 2020 ($Million)
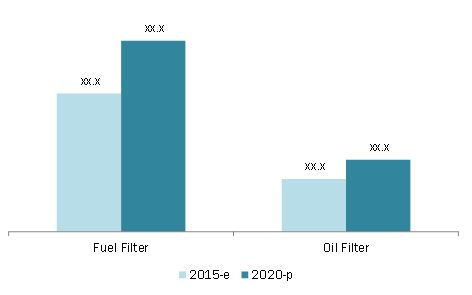
Source: MarketsandMarkets Analysis
 Exclusive indicates content/data unique to MarketsandMarkets and not available with any competitors.
Table of Contents
1 Introduction (Page No. - 18)
1.1 Objectives
1.2 Market Definition
1.3 Market Scope
1.3.1 Markets Covered
1.3.2 Years Considered in the Report
1.4 Currency
1.5 Package Size
1.6 Limitations
1.7 Stakeholders
2 Research Methodology (Page No. - 21)
2.1 Research Data
2.2 Secondary Data
2.2.1 Key Secondary Sources
2.2.2 Data From Secondary Sources
2.3 Primary Data
2.3.1 Sampling Techniques & Data Collection Methods
2.3.2 Primary Participants
2.4 Factor Analysis
2.4.1 Introduction
2.4.2 Demand Side Analysis
2.4.2.1 Impact of GDP on Commercial Vehicle Sales
2.4.2.2 Infrastructure: Roadways
2.4.3 Supply Side Analysis
2.4.3.1 Increasing Vehicle Production in Developing Countries
2.4.4 Influence of Other Factors
2.5 Market Size Estimation
2.6 Data Triangualtion
2.7 Assumptions
3 Executive Summary (Page No. - 34)
4 Premium Insights (Page No. - 39)
5 Technology Overview (Page No. - 46)
5.1 Automotive Oil Filters
5.1.1 Technology Roadmap
5.1.2 Working
5.1.3 Major Components of an Oil Filter
5.1.3.1 Canister
5.1.3.2 Filtration Media
5.1.3.3 Anti-Drain Back Seal
5.1.3.4 Base Plate
5.1.3.5 Base Gasket
5.2 Automotive Fuel Filters
6 Market Overview (Page No. - 49)
6.1 Introduction
6.2 Market Segmentation
6.3 Market Dynamics
6.3.1 Drivers
6.3.1.1 Increasing Vehicle Demand
6.3.1.2 Strict Emission Norms
6.3.1.3 Increase in Global Vehicle Parc
6.3.2 Restraints
6.3.2.1 Longer Drain Intervals
6.3.2.2 Increase in Demand for Electric Vehicles
6.3.3 Opportunities
6.3.3.1 Small-But-Efficient Filters
6.3.3.2 Increasing Demand of Automotive Filters From Brics Nations
6.3.4 Challenge
6.3.4.1 Manufacturing Economical Filters With Increased Service Life
6.4 Burning Issue
6.4.1 Conventional Or Synthetic Media
6.5 Porter�s Five Forces Analysis
6.5.1 Threat of New Entrants
6.5.2 Threat of Substitutes
6.5.3 Bargaining Power of Suppliers
6.5.4 Bargaining Power of Buyers
6.5.5 Intensity of Competitive Rivalry
6.6 Value Chain Analysis
6.7 Global Oil & Fuel Filter Cost Analysis
6.8 Product Life Cycle
6.9 Comparative Economic Analysis of Major Markets
6.9.1 China
6.9.2 Germany
6.9.3 Russia
6.9.4 U.K.
6.9.5 Brazil
6.9.6 U.S.
6.1 Global Plant Analysis of Key Suppliers
7 Automotive OE Oil & Fuel Filter Market, By Filter Type (Page No. - 75)
7.1 Introduction
7.2 Oil Filters
7.3 Fuel Filters
8 Automotive Oil & Fuel Filter Market, By Filter Media (Page No. - 90)
8.1 Introduction
8.2 Celluose
8.3 Synthetic-Laminated
8.4 Pure Glass
9 Automotive Oil & Fuel Filter Aftermarket (Page No. - 94)
9.1 Introduction
9.2 By Vehicle Type
9.3 By Fuel Type
9.4 By Region
10 Off-Highway Oil & Fuel Filter Market (Page No. - 103)
10.1 Introduction
10.2 Agricultural Tractors
10.3 Construction Vehicles
11 Automotive OE Oil & Fuel Filters Market, By Region (Page No. - 111)
11.1 Introduction
11.2 Asia-Oceania
11.3 Europe
11.4 North America
11.5 RoW
12 Competitive Landscape (Page No. - 158)
12.1 Overview
12.2 Market Share Analysis, Automotive Oil & Fuel Filter Market
12.2.1 Leadership Analysis
12.3 Competitive Situation and Trends
12.4 Battle for Market Share: Expansion Was the Key Strategy
12.5 Expansions
12.6 New Product Launches and Developments
12.7 Mergers & Acquisitions
12.8 Agreements, Partnerships, Collaborations, & Joint Ventures
12.9 Supply Contracts
13 Company Profile (Page No. - 168)
(Overview, Financial*, Products & Services, Strategy, and Developments)
13.1 Introduction
13.2 Mann+Hummel Group
13.3 Sogefi Group
13.4 Affinia Group Inc.
13.5 Mahle GmbH
13.6 Donaldson Company, Inc.
13.7 Ahlstrom Corporation
13.8 Cummins Inc.
13.9 Denso Corporation
13.10 Acdelco Corporation
13.11 Hengst Se & Co. Kg
*Details Might Not Be Captured in Case of Unlisted Companies
14 Appendix (Page No. - 197)
14.1 Insights of Industry Experts
14.2 Discussion Guide
14.3 Other Developments
14.4 Introducing Rt: Real Time Market Intelligence
14.5 Available Customizations
14.5.1 Regional Analysis
14.5.2 Automotive Oil & Fuel Filter Market, By Type (Light-Duty Filters & Heavy-Duty Filters)
14.5.3 Automotive Filter Module Market, By Type
14.5.4 Company Information
14.6 Related Reports
List of Tables (93 Tables)
Table 1 Who Supplies Whom: Key Suppliers
Table 2 Increased Vehicle Production, Stringent Emission Norms, & Increasing Vehicle Parc Propelling Growth of the Automotive Filter Market
Table 3 Longer Drain Intervals & Increasing Demand for Electric Vehicles Restraining Market Growth
Table 4 Small-But-Efficient Filters & Rising Demand of Automotive Filters From Brics Nations Offer Opportunities for Market Growth
Table 5 Manufacturing Economical Filters With Increased Service Life: A Challenge in the Automotive Filters Market
Table 6 Automotive Oil & Fuel Filters: Value Chain
Table 7 China: Economic Indicators & Their Descriptions
Table 8 Germany: Economic Indicators & Their Descriptions
Table 9 Russia: Economic Indicators & Their Descriptions
Table 10 U.K.: Economic Indicators & Their Descriptions
Table 11 Brazil: Economic Indicators & Their Descriptions
Table 12 U.S.: Economic Indicators & Their Descriptions
Table 13 Global: Automotive OE Filters Market Size, By Filter & Fuel Type, 2013�2020 (�000 Units)
Table 14 Global: Automotive OE Filters Market Size, By Filter & Fuel Type, 2013�2020 ($Million)
Table 15 Asia-Oceania: Automotive OE Oil Filters Market Size, By Country & Fuel Type, 2013�2020 (�000 Units)
Table 16 Asia-Oceania: Automotive OE Oil Filters Market Size, By Country & Fuel Type, 2013�2020 ($Million)
Table 17 Europe: Automotive OE Oil Filters Market Size, By Country & Fuel Type, 2013�2020 (�000 Units)
Table 18 Europe: Automotive OE Oil Filters Market Size, By Country & Fuel Type, 2013�2020 ($Million)
Table 19 North America: Automotive OE Oil Filters Market Size, By Country & Fuel Type, 2013�2020 (�000 Units)
Table 20 North America: Automotive OE Oil Filters Market Size, By Country & Fuel Type, 2013�2020 ($Million)
Table 21 RoW: Automotive OE Oil Filters Market Size, By Country & Fuel Type, 2013�2020 (�000 Units)
Table 22 RoW: Automotive OE Oil Filters Market Size, By Country & Fuel Type, 2013�2020 ($Million)
Table 23 Asia-Oceania: Automotive OE Fuel Filters Market Size, By Country & Fuel Type, 2013�2020 (�000 Units)
Table 24 Asia-Oceania: Automotive OE Fuel Filters Market Size, By Country & Fuel Type, 2013�2020 ($Million)
Table 25 Europe: Automotive OE Fuel Filters Market Size, By Country & Fuel Type, 2013�2020 (�000 Units)
Table 26 Europe: Automotive OE Fuel Filters Market Size, By Country & Fuel Type, 2013�2020 ($Million)
Table 27 North America: Automotive OE Fuel Filters Market Size, By Country & Fuel Type, 2013�2020 (�000 Units)
Table 28 North America: Automotive OE Fuel Filters Market Size, By Country & Fuel Type, 2013�2020 ($Million)
Table 29 RoW: Automotive OE Fuel Filters Market Size, By Country & Fuel Type, 2013�2020 (�000 Units)
Table 30 RoW: Automotive OE Fuel Filters Market Size, By Country & Fuel Type, 2013�2020 ($Million)
Table 31 Automotive Oil & Fuel Filters Market, By Filter Media Type, 2013�2020 (�000 Units)
Table 32 Cellulose : Automotive Oil & Fuel Filters Market, By Region, 2013�2020 (�000 Units)
Table 33 Synthetic & Laminated: Automotive Oil & Fuel Filters Market, By Region, 2013�2020 (�000 Units)
Table 34 Pure Glass: Automotive Oil & Fuel Filters Market, By Region, 2013�2020 (�000 Units)
Table 35 Automotive Oil & Fuel Filter Aftermarket Size, By Vehicle Type, 2013�2020 (�000 Units)
Table 36 Automotive Oil & Fuel Filter Aftermarket Size, By Vehicle Type, 2013�2020 ($Million)
Table 37 Automotive Oil & Fuel Filter Aftermarket Size, By Fuel Type, 2013�2020 (�000 Units)
Table 38 Automotive Oil & Fuel Filters Aftermarket Size, By Fuel Type, 2013�2020 ($Million)
Table 39 Automotive Oil & Fuel Filter Aftermarket Size, By Region, 2015�2020 (�000 Units)
Table 40 Automotive Oil & Fuel Filter Aftermarket Size, By Region, 2015�2020 ($Million)
Table 41 Agricultural Tractors Oil & Fuel Filter Market Size, By Region, 2013�2020 (�000 Units)
Table 42 Agricultural Tractors Oil & Fuel Filter Market Size, By Region, 2013�2020 ($Million)
Table 43 Construction Vehicle Oil & Fuel Filter Market Size, By Region, 2013�2020 (�000 Units)
Table 44 Construction Vehicle Oil & Fuel Filter Market Size, By Region, 2013�2020 ($Million)
Table 45 Global: Automotive OE Filters Market Size, By Region & Filter Type, 2013�2020 (�000 Units)
Table 46 Global: Automotive OE Filters Market Size, By Region & Filter Type, 2013�2020 ($Million)
Table 47 Global: Automotive OE Filters Market Size, By Filter & Vehicle Type, 2013�2020 (�000 Units)
Table 48 Global: Automotive OE Filters Market Size, By Filter & Vehicle Type, 2013�2020 ($Million)
Table 49 Asia-Oceania: Automotive OE Filters Market Size, By Filter & Vehicle Type, 2013�2020 (�000 Units)
Table 50 Asia-Oceania: Automotive OE Filters Market Size, By Filter & Vehicle Type, 2013�2020 ($Million)
Table 51 China: Automotive OE Filters Market Size, By Filter & Vehicle Type, 2013�2020 (�000 Units)
Table 52 China: Automotive OE Filters Market Size, By Filter & Vehicle Type, 2013�2020 ($Million)
Table 53 Japan: Automotive OE Filters Market Size, By Filter & Vehicle Type, 2013�2020 (�000 Units)
Table 54 Japan: Automotive OE Filters Market Size, By Filter & Vehicle Type, 2013�2020 ($Million)
Table 55 South Korea: Automotive OE Filters Market Size, By Filter & Vehicle Type, 2013�2020 (�000 Units)
Table 56 South Korea: Automotive OE Filters Market Size, By Filter & Vehicle Type, 2013�2020 ($Million)
Table 57 India: Automotive OE Filters Market Size, By Filter & Vehicle Type, 2013�2020 (�000 Units)
Table 58 India: Automotive OE Filters Market Size, By Filter & Vehicle Type, 2013�2020 ($Million)
Table 59 Rest of Asia-Oceania: Automotive OE Filters Market Size, By Filter & Vehicle Type, 2013�2020 (�000 Units)
Table 60 Rest of Asia-Oceania: Automotive OE Filters Market Size, By Filter & Vehicle Type, 2013�2020 ($Million)
Table 61 Europe: Automotive OE Filters Market Size, By Filter & Vehicle Type, 2013�2020 (�000 Units)
Table 62 Europe: Automotive OE Filters Market Size, By Filter & Vehicle Type, 2013�2020 ($Million)
Table 63 Germany: Automotive OE Filters Market Size, By Filter & Vehicle Type, 2013�2020 (�000 Units)
Table 64 Germany: Automotive OE Filters Market Size, By Filter & Vehicle Type, 2013�2020 ($Million)
Table 65 U.K.: Automotive OE Filters Market Size, By Filter & Vehicle Type, 2013�2020 (�000 Units)
Table 66 U.K.: Automotive OE Filters Market Size, By Filter & Vehicle Type, 2013�2020 ($Million)
Table 67 France: Automotive OE Filters Market Size, By Filter & Vehicle Type, 2013�2020 (�000 Units)
Table 68 France: Automotive OE Filters Market Size, By Filter & Vehicle Type, 2013�2020 ($Million)
Table 69 Rest of Europe: Automotive OE Filters Market Size, By Filter & Vehicle Type, 2013�2020 (�000 Units)
Table 70 Rest of Europe: Automotive OE Filters Market Size, By Filter & Vehicle Type, 2013�2020 ($Million)
Table 71 North America: Automotive OE Filters Market Size, By Filter & Vehicle Type, 2013�2020 (�000 Units)
Table 72 North America: Automotive OE Filters Market Size, By Filter & Vehicle Type, 2013�2020 ($Million)
Table 73 U.S.: Automotive OE Filters Market Size, By Filter & Vehicle Type, 2013�2020 (�000 Units)
Table 74 U.S.: Automotive OE Filters Market Size, By Filter & Vehicle Type, 2013�2020 ($Million)
Table 75 Mexico: Automotive OE Filters Market Size, By Filter & Vehicle Type, 2013�2020 (�000 Units)
Table 76 Mexico: Automotive OE Filters Market Size, By Filter & Vehicle Type, 2013�2020 ($Million)
Table 77 Canada: Automotive OE Filters Market Size, By Filter & Vehicle Type, 2013�2020 (�000 Units)
Table 78 Canada: Automotive OE Filters Market Size, By Filter & Vehicle Type, 2013�2020 ($Million)
Table 79 RoW: Automotive OE Filters Market Size, By Filter & Vehicle Type, 2013�2020 (�000 Units)
Table 80 RoW: Automotive OE Filters Market Size, By Filter & Vehicle Type, 2013�2020 ($Million)
Table 81 Brazil: Automotive OE Filters Market Size, By Filter & Vehicle Type, 2013�2020 (�000 Units)
Table 82 Brazil: Automotive OE Filters Market Size, By Filter & Vehicle Type, 2013�2020 ($Million)
Table 83 Russia: Automotive OE Filters Market Size, By Filter & Vehicle Type, 2013�2020 (�000 Units)
Table 84 Russia: Automotive OE Filters Market Size, By Filter & Vehicle Type, 2013�2020 ($Million)
Table 85 Others: Automotive OE Filters Market Size, By Filter & Vehicle Type, 2013�2020 (�000 Units)
Table 86 Others: Automotive OE Filters Market Size, By Filter & Vehicle Type, 2013�2020 ($Million)
Table 87 Leadership Analysis - Mann+Hummel, 2014
Table 88 Regional Expansion is the Key Strategy Adopted By Automotive Oil & Fuel Filter Market Players
Table 89 Expansions, 2010�2015
Table 90 New Product Launches and Developments, 2010�2015
Table 91 Mergers & Acquisitions, 2010�2015
Table 92 Agreements, Partnerships, Collaborations, & Joint Ventures, 2010�2015
Table 93 Supply Contracts, 2010-2015
List of Figures (73 Figures)
Figure 1 Automotive Oil & Fuel Filter Market: Markets Covered
Figure 2 Research Design
Figure 3 Research Methodology Model
Figure 4 Breakdown of Primary Interviews: By Company Type, Designation, & Region
Figure 5 Gross Domestic Product (GDP) vs Commercial Vehicle Sales
Figure 6 Roadways Infrastructure: Road Network (Km), By Country, 2011
Figure 7 Significant Growth in Vehicle Production Across the Globe
Figure 8 Micro & Macro Factor Analysis
Figure 9 Market Size Estimation Methodology (By Fuel Type): Bottom-Up Approach
Figure 10 Market Size Estimation Methodology (By Fuel Type): Top-Down Approach
Figure 11 Asia-Oceania: the Largest Market for Oil & Fuel Filters, 2014
Figure 12 Passenger Car Segment to Dominate the Global Oil & Fuel Filter Market
Figure 13 Cellulose Oil & Fuel Filters Estimated to Account for Maximum Share in Asia-Oceania Market, 2015
Figure 14 Global Off-Highway Oil & Fuel Filter Market By Value, 2015 vs 2020
Figure 15 Diesel Oil & Fuel Filters Projected to Account for Major Market Share($Million), 2015�2020
Figure 16 Fuel Filters Projected to Account for Largest Market Share in Global Aftermarket ($Million),2015�2020
Figure 17 Diesel Fuel Filter Segment & Asia-Oceania Region Dominate the Automotive OE Oil & Fuel Filters Market
Figure 18 U.S. to Be the Fastest Growing Automotive OE Oil & Fuel Filters Market, 2015�2020
Figure 19 Passenger Car Segment is Estimated to Dominate Automotive OE Oil & Fuel Filters Market in 2015
Figure 20 Automotive Oil Filter Aftermarket in Asia-Oceania to Lead the Global Automotive Oil & Fuel Filter Aftermarket in 2015
Figure 21 Automotive Oil & Fuel Filter Media Market, By Volume, 2015-E
Figure 22 Oil & Fuel Filters in Agricultural Tractors Market is Gaining Popularity in the Automotive Oil & Fuel Filters Off-Highway Market
Figure 23 Top 4 Countries to Generate Around Majority of the Automotive OE Oil & Fuel Filters Market Size, By Value, 2015�2020
Figure 24 Technology Roadmap: Automotive Oil Filters
Figure 25 Working of A Modern Automotive Oil Filter
Figure 26 Market Segmentation
Figure 27 Automotive Oil & Fuel Filter Market Dynamics
Figure 28 Global Vehicle Production, 2008�2014 (Million Units)
Figure 29 Declining Emission Limits in Euro Emission Standards
Figure 30 Vehicle Parc, By Region, 2011�2020-P (Million Units)
Figure 31 Average Life of Automotive Oil Filter, By Vehicle Type, 2015 vs 2020 (Miles)
Figure 32 Growth in Electric Vehicle Sales, By Region, 2012�2014 (�000 Units)
Figure 33 Brics Nations: Vehicle Production (Million Units) vs GDP ($Trillion), 2009-2013
Figure 34 Porter�s Five Forces Analysis
Figure 35 Automotive Oil & Fuel Filters: Value Chain Analysis
Figure 36 Automotive Filter Media Market
Figure 37 China: Economic Indicator Analysis
Figure 38 Germany: Economic Indicator Analysis
Figure 39 Russia: Economic Indicator Analysis
Figure 40 U.K.: Economic Indicator Analysis
Figure 41 Brazil: Economic Indicator Analysis
Figure 42 U.S.: Economic Indicator Analysis
Figure 43 Global Automotive OE Filters Market Trend, By Filter Type, 2015�2020 ($Million)
Figure 44 Automotive OE Oil Filters Market Size, By Region & Fuel Type, 2015 vs 2020 ($Million)
Figure 45 Automotive OE Fuel Filters Market Size, By Region & Fuel Type, 2015 vs 2020 ($Million)
Figure 46 Cellulose Oil & Fuel Filters to Lead the Oil & Fuel Filter Market, By Volume, 2015
Figure 47 Automotive Oil Filter Aftermarket: Fastest Growing Segment From 2015 to 2020
Figure 48 Automotive Oil & Fuel Filter Aftermarket ($Million), By Vehicle Type: Snapshot 2015 vs 2020
Figure 49 Fuel Filters to Lead the Filter Aftermarket Segment, By Value, 2015
Figure 50 Asia-Oceania: Fastest Growing Region in the Filter Aftermarket (By Value), 2015�2020
Figure 51 Agricultural Tractors Oil & Fuel Filter Market For, By Region, 2015�2020 ($Million)
Figure 52 Construction Vehicles Oil & Fuel Filter Market, 2015�2020 ($Million)
Figure 53 Region-Wise Snapshot: China & India Emerging as New Hotspots for Automotive OE Filters Market
Figure 54 Asia-Oceania Market Snapshot (2015): Largest Market for Automotive OE Filters
Figure 55 North America Market Snapshot (2015-E): Fastest Growing Market for Automotive OE Filters
Figure 56 Companies Adopted Regional Expansion as the Key Growth Strategy, 2010�2015
Figure 57 Sogefi Group Grew at the Highest Rate, 2009�2014
Figure 58 Automotive Oil & Fuel Filter Market Share, By Key Player, 2014
Figure 59 Geographic Revenue of Top 5 Market Players
Figure 60 Competitve Benchmarking of Key Market Players (2009-2014)
Figure 61 Mann+Hummel Group: Company Snapshot
Figure 62 Mann+Hummel: SWOT Analysis
Figure 63 Sogefi Group: Company Snapshot
Figure 64 Sogefi Group: SWOT Analysis
Figure 65 Affinia Group Inc.: Company Snapshot
Figure 66 Affinia Group Inc.: SWOT Analysis
Figure 67 Company Snapshot: Mahle GmbH
Figure 68 Mahle GmbH: SWOT Analysis
Figure 69 Donaldson Company, Inc.: Company Snapshot
Figure 70 Donaldson Company, Inc.: SWOT Analysis
Figure 71 Ahlstrom Corporation: Company Snapshot
Figure 72 Cummins Inc.: Company Snapshot
Figure 73 Denso Corporation: Company Snapshot


Growth opportunities and latent adjacency in Filter Market
Hi, I am looking for specific information on Capacitive dividers for EVT, Testing, RC Dividers, Grading AIS, Grading GIS, TRV AIS, TRV GIS, Thyristor Valve, HVDC Bypass, Filter capacitor, EVT For the following countries and region - Europe. U.S., Canada, India, China, South America, and Middle East Can you please help me with a quote and timeline for the same?