Optical Sensing Market by Industry (Aerospace & Defense, Utilities, Oil & Gas, Medical, Construction, and Consumer Electronics), Application, Method, and Geography - Global Forecast to 2023


The overall optical sensing market is projected to reach USD 3.47 billion by 2023 from USD 1.13 billion in 2016, at a CAGR of 15.47% between 2017 and 2023. The study involved 4 major steps to estimate the current size of the market.
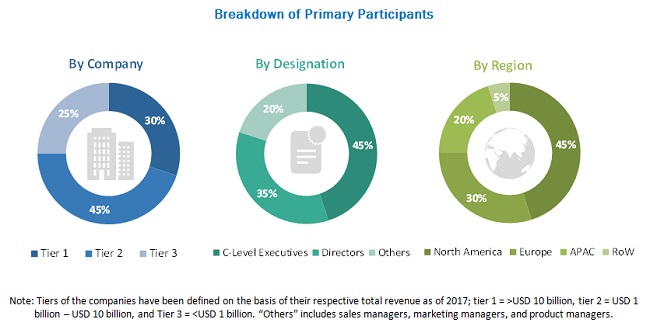
The exhaustive secondary research was conducted to collect information on the focused market, peer market, and parent market. The next step was to validate these findings, assumptions, and sizing with industry experts across value chain through primary research. Both, top-down and bottom-up approaches were employed to estimate the complete market size. Thereafter, market breakdown and data triangulation procedures were used to estimate the market size of segments and subsegments.
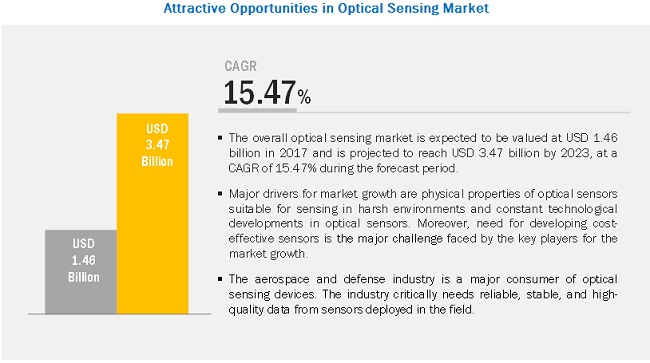
The overall optical sensing market is projected to reach USD 3.47 billion by 2023 from USD 1.13 billion in 2016, at a CAGR of 15.47% between 2017 and 2023. Major drivers for market growth are physical properties of optical sensors suitable for sensing in harsh environments and constant technological developments in optical sensors.
Market for medical industry is expected to grow at a substantial CAGR during the forecast period
The various uses of optical sensing devices in the medical industry include optical coherence tomography, biochemical sensing, and pressure and temperature sensing, among others. The medical industry has a stringent regulatory framework overseeing the deployment of new devices. There are a number of companies that produce optical sensing devices for the medical industry. Owing to increased R&D and growing awareness, the medical optical sensing market is expected to show good growth in the coming years.
Among applications, market for others is expected to register highest CAGR during the forecast period
Other applications in the optical sensing market include radiation sensing, flow sensing, and partial discharge detection. These applications have a small market share in the market. These are used in few industries to a limited extent. The market for these applications is expected to grow steadily but is not expected to impact the overall market considerably.
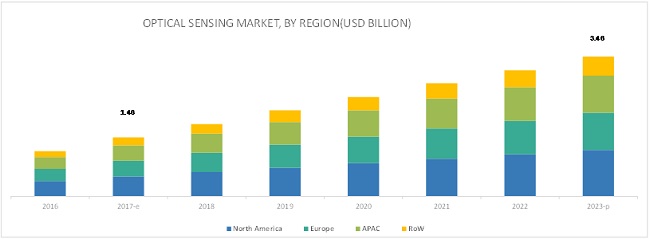
North America is expected to account for largest market size during forecast period
The North American market for optical sensing devices consists of the following countries: the US, Canada, and Mexico. The US is a dominant market for optical sensing devices. On the basis of application, pressure, strain, and temperature sensing devices are most popular in deployment across industries in the region. High investment in key industries such as aerospace and defense; utilities; and oil and gas is one of the key factors for the dominance of the North American region in the optical sensing market.
Key players in the optical sensing market include ROHM Semiconductor (Japan), ABB (Switzerland), Hamamatsu Photonics K.K. (Japan), AMS AG (Austria), Fairchild Semiconductor (US), Analog Devices Inc. (US), Texas Instruments Inc.(US), STMicroelectronics (Switzerland), Vishay Intertechnology, Inc. (US), Alphasense (UK), Teledyne DALSA Inc. (Canada), Oxsensis Ltd. (UK), RJC Enterprises LLC (US), Silixa Ltd. (UK), OptaSense Ltd (UK), Intelligent Fiber Optic Systems Corporation (US) and Fotech Solutions Limited (UK).
Recent Developments
- ROHM Semiconductor launched an optical sensor for heart rate monitoring, which is optimized for wearable devices. This product launch seeks to cash in on the wearables market.
- ABB launched an optical sensor that measures dissolved oxygen. This device has applications in sewage treatment and water processing activities.
- Hamamatsu Photonics K.K. launched a photomultiplier tube, which finds applications in chemiluminescence measurement and semiconductor inspection. The device is capable of continuous measurement amid varying signals.
- AMS AG launched 6-channel digital multispectral sensor ICs, AS7262 and AS7263, which can communicate via I2C or UART interface. These sensors are expected to spur growth in consumer and industrial spectral analysis applications.
Critical questions the report answers:
- Where will all these developments take the industry in the mid to long term?
- Which are emerging industries in terms of the expected adoption of optical sensing?
- How is optical sensing influencing the medical industry?
- How are the companies addressing the challenges regarding developing cost-effective sensors?
To speak to our analyst for a discussion on the above findings, click Speak to Analyst
 Exclusive indicates content/data unique to MarketsandMarkets and not available with any competitors.
Table of Contents
1 Introduction (Page No. - 16)
1.1 Study Objectives
1.2 Market Definition
1.3 Study Scope
1.3.1 Markets Covered
1.3.2 Years Considered for Study
1.4 Currency
1.5 Limitations
1.6 Stakeholders
2 Research Methodology (Page No. - 20)
2.1 Research Data
2.1.1 Secondary Data
2.1.1.1 Major Secondary Sources
2.1.1.2 Secondary Sources
2.1.2 Primary Data
2.1.2.1 Primary Interviews With Experts
2.1.2.2 Breakdown of Primaries
2.1.2.3 Key Data From Primary Sources
2.1.2.4 Key Industry Insights
2.2 Secondary and Primary Research
2.3 Market Size Estimation
2.3.1 Bottom-Up Approach
2.3.1.1 Approach for Capturing the Market Share By Bottom-Up Analysis (Demand Side)
2.3.2 Top-Down Approach
2.3.2.1 Approach for Capturing the Market Share By Top-Down Analysis (Supply Side)
2.4 Market Breakdown and Data Triangulation
2.5 Research Assumptions
3 Executive Summary (Page No. - 30)
4 Premium Insights (Page No. - 34)
4.1 Attractive Opportunities in Optical Sensing Market
4.2 Market in APAC
4.3 Market, By Application
4.4 Market, By Geography
5 Market Overview (Page No. - 37)
5.1 Introduction
5.2 Market Evolution
5.3 Market Dynamics
5.3.1 Drivers
5.3.1.1 Physical Properties Suitable for Sensing in Harsh Environments
5.3.1.2 Constant Technological Developments in Optical Sensors
5.3.2 Restraints
5.3.2.1 Cheaper Substitutes to Optical Sensors
5.3.3 Opportunities
5.3.3.1 Promising Industrial IoT Applications
5.3.3.2 Rising Applications in Healthcare
5.3.4 Challenges
5.3.4.1 Need for Developing Cost-Effective Sensors
6 Industry Trends (Page No. - 41)
6.1 Introduction
6.2 Value Chain Analysis
6.2.1 Research and Product Development
6.2.2 Manufacturing and Assembly
6.2.3 Distribution/Marketing
6.2.4 Post-Sales Services
6.3 Key Industry Trends
7 Optical Sensing Market, By Industry (Page No. - 43)
7.1 Introduction
7.2 Aerospace and Defense
7.3 Utilities
7.4 Oil and Gas
7.5 Medical
7.6 Construction
7.7 Consumer Electronics
7.8 Others
8 Optical Sensing Market, By Application (Page No. - 54)
8.1 Introduction
8.2 Pressure and Strain Sensing
8.3 Temperature Sensing
8.4 Geological Survey
8.5 Biochemical
8.6 Biometric and Ambience
8.7 Others
9 Methods Used in Optical Sensing (Page No. - 83)
9.1 Introduction
9.2 Extrinsic
9.2.1 Optical Coherence Tomography
9.2.2 Encoders
9.2.3 Laser Doppler Velocimetry
9.2.4 Pyrometers
9.2.5 Fabry–Perot Interferometers
9.2.6 Spectroscopy
9.3 Intrinsic
9.3.1 Scattering Based
9.3.1.1 Raman Scattering
9.3.1.2 Rayleigh Scattering
9.3.1.3 Brillouin Scattering
9.3.2 Fiber Bragg Grating Based
9.3.2.1 Point Fbg Based
9.3.2.2 Spatially Continuous Based
10 Geographic Analysis (Page No. - 87)
10.1 Introduction
10.2 North America
10.2.1 US
10.2.2 Canada
10.2.3 Mexico
10.3 Europe
10.3.1 Germany
10.3.2 France
10.3.3 UK
10.3.4 Italy
10.3.5 Russia
10.3.6 Spain
10.3.7 Rest of Europe
10.4 APAC
10.4.1 China
10.4.2 Japan
10.4.3 India
10.4.4 South Korea
10.4.5 Rest of APAC
10.5 RoW
10.5.1 Middle East and Africa
10.5.2 Latin America
11 Competitive Landscape (Page No. - 104)
11.1 Introduction
11.2 Market Ranking of Players in Optical Sensing Market, 2016
11.3 Vendor Dive Overview
11.3.1 Vanguards
11.3.2 Dynamic
11.3.3 Innovators
11.3.4 Emerging
11.4 Competitive Benchmarking
11.4.1 Business Strategy Analysis (25 Companies)
11.4.2 Product Offering Analysis (25 Companies)
*Top 25 Companies Analyzed for This Study are -ROHM Semiconductor, ABB, Hamamatsu Photonics K.K., AMS AG, Fairchild Semiconductor, Analog Devices, Inc., Texas Instruments, Inc., Vishay Intertechnology, Inc., Micron Optics, Inc., Cementys, Stmicroelectronics N.V., Opsens Inc., Newport Corporation, Alphasense, Teledyne Dalsa Inc., Oxsensis Ltd., Silixa Ltd., Optasense Ltd., Intelligent Fiber Optic Systems Corporation, Fotech Solutions Ltd., Optek Technology, Inc., Sharp Corporation, Broadcom, Fiso Technologies Inc., RJC Enterprises LLC, 12
12 Company Profiles (Page No. - 110)
(Overview, Products and Services, Financials, Strategy & Development)*
12.1 Introduction
12.2 ROHM Semiconductor
12.3 ABB
12.4 Hamamatsu Photonics K.K.
12.5 AMS AG
12.6 Fairchild Semiconductor
12.7 Analog Devices, Inc.
12.8 Texas Instruments Inc.
12.9 Stmicroelectronics N.V.
12.10 Vishay Intertechnology, Inc.
12.11 Alphasense
12.12 Teledyne Dalsa Inc.
12.13 Oxsensis Ltd.
12.14 RJC Enterprises, LLC
12.15 Key Innovators
*Details on Overview, Products and Services, Financials, Strategy & Development Might Not Be Captured in Case of Unlisted Companies.
13 Appendix (Page No. - 149)
13.1 Insights of Industry Experts
13.2 Discussion Guide
13.3 Knowledge Store: Marketsandmarkets’ Subscription Portal
13.4 Introducing RT: Real-Time Market Intelligence
13.5 Available Customizations
13.6 Related Reports
13.7 Author Details
List of Tables (76 Tables)
Table 1 Optical Sensing Market, By Industry, 2014–2023 (USD Million)
Table 2 Market for Aerospace and Defense Industry, By Region, 2014–2023 (USD Million)
Table 3 Market for Aerospace and Defense Industry, By Application, 2014–2023 (USD Million)
Table 4 Market for Utilities Industry, By Region, 2014–2023 (USD Million)
Table 5 Market for Utilities Industry, By Application, 2014–2023 (USD Million)
Table 6 Market for Oil and Gas Industry, By Region, 2014–2023 (USD Million)
Table 7 Market for Oil and Gas Industry, By Application, 2014–2023 (USD Million)
Table 8 Market for Medical Industry, By Region, 2014–2023 (USD Million)
Table 9 Market for Medical Industry, By Application, 2014–2023 (USD Million)
Table 10 Market for Construction Industry, By Region, 2014–2023 (USD Million)
Table 11 Market for Construction Industry, By Application, 2014–2023 (USD Million)
Table 12 Market for Consumer Electronics Industry, By Region, 2014–2023 (USD Million)
Table 13 Market for Consumer Electronics Industry, By Application, 2014–2023 (USD Million)
Table 14 Market for Other Industries, By Region, 2014–2023 (USD Million)
Table 15 Market for Other Industries, By Application, 2014–2023 (USD Million)
Table 16 Market, By Application, 2014–2023 (USD Million)
Table 17 Market, By Application, 2014–2023 (Thousand Units)
Table 18 Market for Pressure and Strain Application, By Region, 2014–2023 (USD Million)
Table 19 Market for Aerospace and Defense Industry, By Region, 2014–2023 (USD Million)
Table 20 Market for Utilities Industry, By Region, 2014–2023 (USD Million)
Table 21 Market for Oil and Gas Industry, By Region, 2014–2023 (USD Million)
Table 22 Market for Medical Industry, By Region, 2014–2023 (USD Million)
Table 23 Market for Construction Industry, By Region, 2014–2023 (USD Million)
Table 24 Market for Consumer Electronics Industry, By Region, 2014–2023 (USD Million)
Table 25 Market for Other Industries, By Region, 2014–2023 (USD Million)
Table 26 Market for Temperature Application, By Region, 2014–2023 (USD Million)
Table 27 Market for Aerospace and Defense Industry, By Region, 2014–2023 (USD Million)
Table 28 Market for Utilities Industry, By Region, 2014–2023 (USD Million)
Table 29 Market for Oil and Gas Industry, By Region, 2014–2023 (USD Million)
Table 30 Market for Medical Industry, By Region, 2014–2023 (USD Million)
Table 31 Market for Construction Industry, By Region, 2014–2023 (USD Million)
Table 32 Market for Consumer Electronics Industry, By Region, 2014–2023 (USD Million)
Table 33 Market for Other Industries, By Region, 2014–2023 (USD Million)
Table 34 Market for Geological Survey Application, By Region, 2014–2023 (USD Million)
Table 35 Market for Aerospace and Defense Industry, By Region, 2014–2023 (USD Million)
Table 36 Market for Utilities Industry, By Region, 2014–2023 (USD Million)
Table 37 Market for Oil and Gas Industry, By Region, 2014–2023 (USD Million)
Table 38 Market for Construction Industry, By Region, 2014–2023 (USD Million)
Table 39 Market for Other Industries, By Region, 2014–2023 (USD Million)
Table 40 Market for Biochemical Application, By Region, 2014–2023 (USD Million)
Table 41 Market for Aerospace and Defense Industry, By Region, 2014–2023 (USD Million)
Table 42 Market for Utilities Industry, By Region, 2014–2023 (USD Million)
Table 43 Market for Oil and Gas Industry, By Region, 2014–2023 (USD Million)
Table 44 Market for Medical Industry, By Region, 2014–2023 (USD Million)
Table 45 Market for Construction Industry, By Region, 2014–2023 (USD Million)
Table 46 Market for Consumer Electronics Industry, By Region, 2014–2023 (USD Million)
Table 47 Market for Other Industries, By Region, 2014–2023 (USD Million)
Table 48 Market for Biometric and Ambience Application, By Region, 2014–2023 (USD Million)
Table 49 Market for Aerospace and Defense Industry, By Region, 2014–2023 (USD Million)
Table 50 Market for Utilities Industry, By Region, 2014–2023 (USD Million)
Table 51 Market for Oil and Gas Industry, By Region, 2014–2023 (USD Million)
Table 52 Market for Medical Industry, By Region, 2014–2023 (USD Million)
Table 53 Market for Construction Industry, By Region, 2014–2023 (USD Million)
Table 54 Market for Consumer Electronics Industry, By Region, 2014–2023 (USD Million)
Table 55 Market for Other Industries, By Region, 2014–2023 (USD Million)
Table 56 Market for Other Applications, By Region, 2014–2023 (USD Million)
Table 57 Market for Aerospace and Defense Industry, By Region, 2014–2023 (USD Million)
Table 58 Market for Utilities Industry, By Region, 2014–2023 (USD Million)
Table 59 Market for Oil and Gas Industry, By Region, 2014–2023 (USD Million)
Table 60 Market for Construction Industry, By Region, 2014–2023 (USD Million)
Table 61 Market for Other Industries, By Region, 2014–2023 (USD Million)
Table 62 Market, By Region, 2014–2023 (USD Million)
Table 63 Market, By Region, 2014–2023 (Thousand Units)
Table 64 Market in North America, By Application, 2014–2023 (USD Million)
Table 65 Market in North America, By Application, 2014–2023 (Thousand Units)
Table 66 Market in North America, By Country, 2014–2023 (USD Million)
Table 67 Market in Europe, By Application, 2014–2023 (USD Million)
Table 68 Market in Europe, By Application, 2014–2023 (Thousand Units)
Table 69 Market in Europe, By Country, 2014–2023 (USD Million)
Table 70 Market in APAC, By Application, 2014–2023 (USD Million)
Table 71 Market in APAC, By Application, 2014–2023 (Thousand Units)
Table 72 Market in APAC, By Country, 2014–2023 (USD Million)
Table 73 Market in RoW, By Application, 2014–2023 (USD Million)
Table 74 Market in RoW, By Application, 2014–2023 (Thousand Units)
Table 75 Market in RoW, By Region, 2014–2023 (USD Million)
Table 76 Market Ranking of Top 5 Players in Optical Sensing Market (2016)
List of Figures (47 Figures)
Figure 1 Optical Sensing Market Segmentation
Figure 2 Market: Research Design
Figure 3 Market Size Estimation Methodology: Bottom-Up Approach
Figure 4 Market Size Estimation Methodology: Top-Down Approach
Figure 5 Data Triangulation
Figure 6 Aerospace and Defense Industry has the Largest Share of the Total Market in 2016
Figure 7 Market for Pressure and Strain Application Expected to Dominate During the Forecast Period
Figure 8 North America Expected to Dominate Market During the Forecast Period
Figure 9 Market Offers Lucrative Opportunities Owing to Increased Investments to Develop Innovative Products During the Forecast Period
Figure 10 China Holds the Largest Share of Optical Sensing Market in APAC
Figure 11 Pressure and Strain Application Expected to Dominate Market During the Forecast Period
Figure 12 Market in APAC Expected to Grow at the Highest Rate During the Forecast Period
Figure 13 Drivers, Restraints, Opportunities, and Challenges for Market
Figure 14 Market: Value Chain Analysis
Figure 15 Product Innovation—Key Trend in the Market
Figure 16 Optical Sensing Market, By Industry
Figure 17 Aerospace and Defense Industry Expected to Dominate Market During the Forecast Period
Figure 18 Market for Oil and Gas Industry in RoW Expected to Grow at the Highest CAGR During the Forecast Period
Figure 19 Pressure and Strain Sensors Expected to Dominate Market for Construction Industry During the Forecast Period
Figure 20 Optical Sensing Market, By Application
Figure 21 Pressure and Strain Application Expected to Dominate Market During the Forecast Period
Figure 22 Shipments for Biochemical Sensors Expected to Grow at the Highest CAGR During the Forecast Period
Figure 23 North America Expected to Dominate Market for Pressure and Strain Application During the Forecast Period
Figure 24 Market for Temperature Application in APAC Expected to Grow at the Highest CAGR During the Forecast Period
Figure 25 APAC Expected to Demonstrate Significant Growth for Temperature Application in Market for Other Industries
Figure 26 Market for Geological Survey Application in APAC Expected to Grow at the Highest CAGR During the Forecast Period
Figure 27 North America Expected to Dominate Market for Biochemical Application During the Forecast Period
Figure 28 North America Expected to Dominate Market for Biometric and Ambience Application During the Forecast Period
Figure 29 North America Accounted for the Largest Share of the Total Market for Other Applications During the Forecast Period
Figure 30 Methods Used in Optical Sensing
Figure 31 Optical Sensing Market, By Geography
Figure 32 India and Latin America Expected to Witness Significant Growth in Market During the Forecast Period
Figure 33 North America: Optical Sensing Market Snapshot
Figure 34 Europe: Market Snapshot
Figure 35 APAC: Market Snapshot
Figure 36 RoW: Market Snapshot
Figure 37 Key Growth Strategies Adopted By Top Companies Between 2014 and 2016
Figure 38 Dive Chart
Figure 39 Geographic Revenue Mix of Top 5 Market Players
Figure 40 ROHM Semiconductor: Company Snapshot
Figure 41 ABB: Company Snapshot
Figure 42 Hamamatsu Photonics K.K.: Company Snapshot
Figure 43 AMS AG: Company Snapshot
Figure 44 Analog Devices, Inc.: Company Snapshot
Figure 45 Texas Instruments, Inc.: Company Snapshot
Figure 46 Stmicroelectronics N.V.: Company Snapshot
Figure 47 Vishay Intertechnology, Inc.: Company Snapshot
Secondary Research
In the secondary research process, various secondary sources have been referred to for identifying and collecting information important for this study. These secondary sources include annual reports, press releases, and investor presentations of companies; white papers; and certified publications and articles from recognized authors; directories; and databases. The secondary data has been collected and analyzed from various association and journals, such as The Fiber Optic Association, Inc., Society of Photo-Optical Instrumentation Engineers, American Optometric Association to arrive at the overall market size, which has further been validated by the primary research.
Primary Research
In the primary research process, various primary sources from both the supply and demand sides have been interviewed to obtain qualitative and quantitative information important for this report. The primary sources from the supply side include industry experts such as CEOs, VPs, marketing directors, technology and innovation directors, and related executives from key companies and organizations operating in the optical sensing market. After complete market engineering (including calculations regarding market statistics, market breakdown, market size estimations, market forecasting, and data triangulation), extensive primary research has been conducted to gather information as well as verify and validate the critical numbers arrived at.
To know about the assumptions considered for the study, download the pdf brochure
Market Size Estimation
In the complete market engineering process, both top-down and bottom-up approaches have been implemented, along with several data triangulation methods, to estimate and validate the size of the optical sensing market and other dependent submarkets listed in this report.
- The key players in the industry and markets have been identified through extensive secondary research.
- The industry’s supply chain and market size, in terms of value, have been determined through primary and secondary research processes.
- All percentage shares, splits, and breakdowns have been determined using secondary sources and verified through primary sources.
Data Triangulation
After arriving at the overall market size from the estimation process explained above, the overall market has been split into several segments and subsegments. To complete the overall market engineering process and arrive at the exact statistics for all segments and subsegments, the market breakdown and data triangulation procedures have been employed, wherever applicable. The data have been triangulated by studying various factors and trends identified from both demand and supply sides in the end-use industrial segments such as aerospace & defense; utilities; oil & gas; medical, construction, consumer electronics, and others. Along with this, the market size has been validated using both top-down and bottom-up approaches.
The following are the major objectives of the study.
- To define, describe, and forecast the optical sensing market on the basis of industry, application, and geography
- To describe the methods used in optical sensing
- To forecast the market size across various segments with respect to 4 major regions: North America, Europe, Asia Pacific (APAC), and Rest of the World (RoW)
- To provide information and analysis of the major factors influencing the market growth (drivers, restraints, opportunities, and challenges)
- To strategically analyze the micromarkets1 with respect to growth trends, prospects, and contribution to the total market
- To analyze opportunities for the stakeholders by identifying the high-growth segments within the market
- To strategically profile the key players and their core competencies2, and provide comprehensive details of their businesses with respect to the optical sensing market, along with detailed competitive landscape for the market players
- To study the complete value chain and allied industry segments, and perform a value chain analysis of the global market
- To track and analyze competitive developments such as joint ventures, mergers and acquisitions, new product developments, and research and development (R&D) in the optical sensing market
|
Report Metric |
Details |
|
Market size available for years |
2014–2023 |
|
Base year considered |
2016 |
|
Forecast period |
2017–2023 |
|
Forecast units |
Value (USD) in million |
|
Segments covered |
Industry, Application, and Region |
|
Geographies covered |
North America, APAC, Europe, and RoW |
|
Companies covered |
ROHM Semiconductor (Japan), ABB (Switzerland), Hamamatsu Photonics K.K. (Japan), AMS AG (Austria), Fairchild Semiconductor (US), Analog Devices Inc. (US), Texas Instruments Inc.(US), STMicroelectronics (Switzerland), Vishay Intertechnology, Inc. (US), Alphasense (UK), Teledyne DALSA Inc. (Canada), Oxsensis Ltd. (UK), RJC Enterprises LLC (US), Silixa Ltd. (UK), OPTEK Technology Inc. (US), Opsens Inc. (Canada), Intelligent Fiber Optic Systems Corporation (US) and Fotech Solutions Limited (UK). |
The detailed segmentation of the optical sensing market based on industry, application, and region has been given below.
Market, by Industry
- Aerospace and Defense
- Utilities
- Oil and Gas
- Medical
- Construction
- Consumer Electronics
- Others (Chemicals, Transportation, and Marine)
Market, by Application
- Pressure and Strain Sensing
- Temperature Sensing
- Geological Survey
- Biochemical
- Biometric and Ambience
- Others (Radiation Sensing, Flow Sensing, and Partial Discharge Detection)
By Geography
- North America
- Europe
- Asia Pacific (APAC)
- Rest of the World (RoW)
Available Customizations
Based on the given market data, MarketsandMarkets offers customizations in the reports as per the client’s specific requirements. The following customization options are available for this report:
Geographic Analysis
- Further country-wise breakdown of the market for all 4 regions based on various end user
Company Information
- Detailed analysis and profiling of additional market players (Up to 5)


Growth opportunities and latent adjacency in Optical Sensing Market
More focused on intrinsic optical fiber sensors. Please let me know the best deal you can provide for this report and we will consider purchasing today.
We are developing an optical sensor for use within the activation industry and are interested in technology & market developments in this space.
Can you provide sampe information about the optical sensing market, including the market size for say any particular historical year and the market growth?