Petroleum Resins Market by Type (C5, C9, Hydrogenated Hydrocarbon Resins and C5/C9 Resins), Application (Adhesive & Sealants, Printing Inks, Paints & Coatings), End-Use Industry (Building & Construction, Tire) and by Region - Global Forecast to 2021


[166 Pages Report] The global petroleum resins market is estimated to reach USD 2.58 Billion by 2021, at a CAGR of 7.7%. The market is segmented by application, such as adhesives & sealants, printing inks, paints & coatings, rubber compounding, tapes & labels, and others applications; by type that includes C5 petroleum resins, C9 petroleum resins, hydrogenated hydrocarbon resins, and C5/C9 petroleum resins; by end-use industry such as building & construction, tire industry, personal hygiene, consumer goods, automotive, and others; by region, namely, North America, Middle East & Africa, Latin America, Asia-Pacific, and Europe. The base year considered for the study is 2015, while the forecast period is between 2016 and 2021. The petroleum resins market is driven by the increasing demand for low VOC, green, and sustainable resins and rising demand of hydrogenated hydrocarbon resins due to its excellent adhesion and chemical resistance properties.
Both, top-down and bottom-up approaches have been used to estimate and validate the size of the market and to estimate the size of various other dependent submarkets in the overall petroleum resins market. The research study involved the use of extensive secondary sources, directories, and databases such as Hoovers, Bloomberg, Chemical Weekly, Factiva, Hydrocarbon and Resins, Rosin Resins Pine Chemicals Producers Association (HARRPA), American Chemistry Council (ACC), among other government and private websites, to identify and collect information useful for the technical, market-oriented, and commercial study of the petroleum resins market.
To know about the assumptions considered for the study, download the pdf brochure
Petroleum resins are manufactured from various fractions of naphtha such as C5, C9, and DCPD. The raw materials available in the market are supplied by major companies such as BASF SE (Germany) and The DOW Chemical Company (U.S.) to the petroleum resins manufacturers such as Eastman Chemical Company (U.S.), ExxonMobil Corporation (U.S.), Total CrayValley (U.S.), and Kolon Industries (South Korea).
Key Target Audience:
- Manufacturers of petroleum resins
- Traders, distributors, and suppliers of petroleum resins
- Regional manufacturers� associations and general petroleum resins� associations
- Government and regional agencies and research organizations
- Investment research firms
Scope of the Report:
This research report categorizes the petroleum resins market on the basis of application, material type, and region
On the basis of Type:
- C5 Resins
- C9 Resins
- Hydrogenated Hydrocarbon Resins
- C5/C9 Resins
On the basis of Application:
- Adhesives & Sealants
- Printing Inks
- Paints & Coatings
- Rubber Compounding
- Tapes & Labels
- Others
On the basis of End-Use Industry:
- Building & Construction
- Tire Industry
- Personal Hygiene
- Consumer Goods
- Automotive
- Others
On the basis of Region:
- North America
- Middle East & Africa
- Latin America
- Asia-Pacific
- Europe
The market is further analyzed for the key countries in each of these regions.
Available Customizations:
With the given market data, MarketsandMarkets offers customizations according to the specific needs of the company. The following customization options are available for the report:
Regional Analysis:
- Country-level analysis of the petroleum resins market, by type, by application, by end-use industry
Company Information:
- Detailed analysis and profiling of additional market players.
The petroleum resins market is estimated to reach USD 2.58 Billion by 2021, at a CAGR of 7.7%. The petroleum resins market is growing because of growth in end-use industries such as automotive, building & construction, personal hygiene, and tire. Petroleum resins are used to provide chemical resistance, adhesion,and pressure resistance properties in these industries.
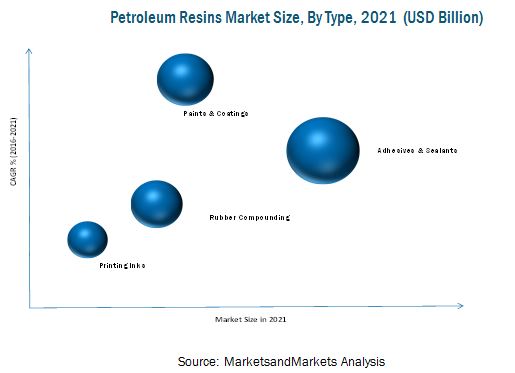
Petroleum resins are used in adhesives & sealants, paints & coatings , rubber compounding, printing inks, and others applications. These are the main applications considered in the report. In 2015, the adhesives & sealants application accounted for the largest market share as compared to onshore application, in terms of value. The paints & coatings application is estimated to register the highest CAGR between 2016 and 2021 among all the applications considered.
Asia-Pacific, North America, Europe, the Middle East & Africa, and Latin America are considered the main regions for the petroleum resins market in the report. The Asia-Pacific region is dominaning the petroleum resins market. The rising demand for petroleum resins in this region is mainly driven by its usage in building & construction. The presence of key market players in this region also contributed in the growing demand for petroleum resins. The North American region is the second-largest consumer of petroleum resins, globally. The market in this region is mainly driven by the growing opportunities from personal hygiene, automotive, and tire industries. The adhesives & sealants application is the major contributer for the growing demand of petroleum resins in North America. Latin America is expected to be the second fastest-growing region between 2016 and 2021.
Though the petroleum resins market is growing at a significant rate, decreasing prices of crude oil and the rising cost of production are restraining the growth of the market.
Total CrayValley (U.S.), Exxon Mobil Corporation (U.S.), and Eastman Chemical Company (U.S.) are the leading companies that have an excellent foothold in the U.S. These companies are expected to account for a significant market share in the near future. Entering related industries and targeting new markets will enable the petroleum resins manufacturers to overcome the effects of a volatile economy, leading to diversified business portfolio and increase in the revenue. Other major manufacturers of petroleum resins are Kolon Industries, Inc. (South Korea), Arakawa Chemical Industries Limited (Japan), Lesco Chemical Limited (China), Puyang Ruisen Petroleum Resins Co., Ltd. (China), Zeon Corporation (Japan), Innova (Tianjin) Chemical Co., Limited (The Netherlands), Shandong Landun Petroleum Resin Co., Ltd. (China), Puyang Tiacheng Chemical Co., Ltd. (China), and Shanghai Jinsen Hydrocarbon Resins Co., Limited (China).
To speak to our analyst for a discussion on the above findings, click Speak to Analyst
 Exclusive indicates content/data unique to MarketsandMarkets and not available with any competitors.
Table of Contents
1 Introduction (Page No. - 16)
1.1 Objectives of the Study
1.2 Market Definition
1.3 Market Scope
1.3.1 Markets Covered
1.3.2 Years Considered for the Study
1.4 Currency
1.5 Package Size
1.6 Stakeholders
2 Research Methodology (Page No. - 19)
2.1 Research Data
2.1.1 Secondary Data
2.1.1.1 Key Data From Secondary Sources
2.1.2 Primary Data
2.1.2.1 Key Data From Primary Sources
2.1.2.2 Breakdown of Primary Interviews
2.2 Market Size Estimation
2.2.1 Bottom-Up Approach
2.2.2 Top-Down Approach
2.3 Market Breakdown and Data Triangulation
2.3.1 Assumptions
2.3.2 Limitations
3 Executive Summary (Page No. - 27)
4 Premium Insights (Page No. - 31)
4.1 Attractive Opportunities in Petroleum Resins Market
4.2 Petroleum Resins Market
4.3 Petroleum Resins Market in Asia-Pacific, 2014
4.4 Leading Countries in Petroleum Resins Market, 2015
4.5 Petroleum Resins Market Size, By Leading Countries, 2016-2021 (USD Million)
4.6 Petroleum Resins Market, By Application (2015)
4.7 Lifecycle Analysis, By Region
5 Market Overview (Page No. - 35)
5.1 Introduction
5.2 Market Segmentation
5.3 Market Dynamics
5.3.1 Drivers
5.3.1.1 Construction, Automotive, and Consumer Goods Application to Drive the Petroleum Resins Market
5.3.1.2 Rising Demand for Hydrogenated Hydrocarbon Petroleum Resins
5.3.1.3 High Demand for Petroleum Resins in the Asia-Pacific Region
5.3.2 Restraint
5.3.2.1 Volatility in Raw Material Prices
5.3.2.2 Fluctuating Prices of Naphtha
5.3.3 Opportunities
5.3.3.1 Growing Demand for Low Voc, Green, and Sustainable Petroleum Resins
5.3.4 Challenges
5.3.4.1 High Capital & Energy Requirement for Manufacturing of Petroleum Resins
5.3.4.2 Replacement of Petroleum Resins By Rosin Resins
6 Industry Trends (Page No. - 42)
6.1 Introduction
6.2 Value Chain Analysis
6.3 Porter�s Five Forces Analysis
6.3.1 Bargaining Power of Suppliers
6.3.2 Bargaining Power of Buyers
6.3.3 Threat of Substitutes
6.3.4 Threat of New Entrants
6.3.5 Intensity of Competitive Rivalry
7 Petroleum Resins Market, By Type (Page No. - 45)
7.1 Introduction
7.2 Aliphatic C5 Resins
7.3 Aromatic C9 Resins
7.4 Hydrogenated Hydrocarbon Resins
7.5 C5/C9 Resins
8 Petroleum Resins Market, By Application (Page No. - 54)
8.1 Introduction
8.2 Adhesive & Sealants
8.2.1 Psa (Pressure Sensitive Adhesives)
8.2.2 Hot Melt Adhesives (HMA)
8.3 Paints & Coatings
8.4 Printing Inks
8.5 Rubber Compounding
8.6 Tapes & Labels
8.7 Others
9 Petroleum Resins Market, By End-Use Industry (Page No. - 65)
9.1 Introduction
9.2 Building & Construction
9.3 Tire Industry
9.4 Automotive
9.5 Personal Hygiene
9.6 Consumer Goods
9.7 Others
10 Petroleum Resins Market, By Region (Page No. - 76)
10.1 Introduction
10.2 North America
10.2.1 U.S.
10.2.2 Canada
10.2.3 Mexico
10.3 Asia-Pacific
10.3.1 China
10.3.2 India
10.3.3 Japan
10.3.4 South Korea
10.4 Europe
10.4.1 Germany
10.4.2 France
10.4.3 Italy
10.4.4 Netherlands
10.4.5 Russia
10.5 Middle East & Africa
10.5.1 Saudi Arabia
10.5.2 U.A.E.
10.5.3 Nigeria
10.6 Latin America
10.6.1 Brazil
11 Competitive Landscape (Page No. - 128)
11.1 Overview
11.2 Competitive Situations & Trends
11.3 Key Growth Strategies in the Petroleum Resins Market, 2011�2016
11.4 Contracts, Expansions, Agreements, Joint Ventures & Investments
11.5 New Product Launches
12 Company Profile (Page No. - 131)
(Overview, Financials, Products & Services, Strategy, and Developments)*
12.1 Total Cray Valley
12.2 Eastman Chemical Company
12.3 Exxon Mobil Corporation
12.4 Arakawa Chemical Industries Limited
12.5 Kolon Industries, Inc.
12.6 Lesco Chemical Limited
12.7 Puyang Ruisen Petroleum Resins Co., Ltd.
12.8 Zeon Corporation
12.9 Innova (Tianjin) Chemical Co., Limited
12.10 Anglxxon Chemical Co., Ltd
12.11 Shandong Landun Petroleum Resin Co., Ltd.
12.12 Puyang Tiancheng Chemical Co., Ltd.
12.13 Neville Chemical Company
12.14 Shanghai Jinsen Hydrocarbon Resins Co., Limited
12.15 Seacon Corporation
12.16 Thankyou Chem (Henan) Co., Ltd.
12.17 Nanjing Yuangang Fine Chemicals Co., Ltd
*Details on Overview, Financials, Product & Services, Strategy, and Developments Might Not Be Captured in Case of Unlisted Companies.
13 Appendix (Page No. - 158)
13.1 Insights of Industry Experts
13.2 Discussion Guide
13.3 Knowledge Store: Marketsandmarkets� Subscription Portal
13.4 Introducing RT: Real Time Market Intelligence
13.5 Available Customizations
13.6 Related Reports
List of Tables (147 Tables)
Table 1 Petroleum Resins Market Size, By Region, 2014�2020 (USD Million)
Table 2 Market Size, By Application, 2014�2020 (USD Million)
Table 3 Market, By Type
Table 4 Market, By Application
Table 5 C5 Market, By Region, 2014-2021 (Kilotons)
Table 6 C5 Market, By Region, 2014�2021 (USD Million)
Table 7 C5 Market, By Region, 2014-2021 (Kilotons)
Table 8 Market in C9 Resins, By Region, 2014�2021 (USD Million)
Table 9 Market in Hydrogenated Hydrocarbon Resins, By Region, 2014�2021 (Kilotons)
Table 10 Market in Hydrogenated Hydrocarbon Resins, By Region, 2014�2021 (USD Million)
Table 11 Market in C5/C9 Resins, By Region, 2014�2021 (Kilotons)
Table 12 Market in C5/C9 Resins, By Region, 2014�2021 (USD Million)
Table 13 Market, By Application, 2014-2021 (USD Million)
Table 14 Market in Adhesives & Sealants Application, By Region, 2014�2021 (Kilotons)
Table 15 Market in Adhesives & Sealants Application, By Region, 2014�2021 (USD Million)
Table 16 Market in Paints & Coatings Application, By Region, 2014�2021 (Kilotons)
Table 17 Market in Paints & Coatings Application, By Region, 2014�2021 (USD Million)
Table 18 Market in Printing Inks Application, By Region, 2014�2021 (Kilotons)
Table 19 Market in Printing Inks Application, By Region, 2014�2021 (USD Million)
Table 20 Market in Rubber Compounding Application, By Region, 2014�2021 (Kilotons)
Table 21 Petroleum Resins Market in Rubber Compounding Application, By Region, 2014�2021 (USD Million)
Table 22 Market in Tapes & Labels Application, By Region, 2014�2021 (Kilotons)
Table 23 Market in Tapes & Labels Application, By Region, 2014�2021 (USD Million)
Table 24 Market in Others Application, By Region, 2014�2021 (Kilotons)
Table 25 Market in Others Application, By Region, 2014�2021 (USD Million)
Table 26 Market, By End-Use Industry, 2014�2021 (USD Million)
Table 27 Market, By End-Use Industry, 2014�2021 (Kilotons)
Table 28 Market in Building & Construction Industry, By Region, 2014�2021 (Kilotons)
Table 29 Market in Building & Construction Industry, By Region, 2014�2021 (USD Million)
Table 30 Market in Tire Industry, By Region, 2014�2021 (Kilotons)
Table 31 Market in Tire Industry, By Region, 2014�2021 (USD Million)
Table 32 Market in Automotive Industry, By Region, 2014�2021 (Kilotons)
Table 33 Market in Automotive Industry, By Region, 2014�2021 (USD Million)
Table 34 Market in Personal Hygiene, By Region, 2014�2021 (Kilotons)
Table 35 Market in Personal Hygiene, By Region, 2014�2021 (USD Million)
Table 36 Market in Consumer Goods, By Region, 2014�2021 (Kilotons)
Table 37 Market in Consumer Goods, By Region, 2014�2021 (USD Million)
Table 38 Market in Others End-Use Industry, By Region, 2014�2021 (Kilotons)
Table 39 Market in Others End-Use Industry, By Region, 2014�2021 (USD Million)
Table 40 Market, By Region, 2014�2021 (Kilotons)
Table 41 Market, By Region, 2014�2021 (USD Million)
Table 42 North America Petroleum Resins Market, By Country, 2014�2020 (Kilotons)
Table 43 North America Market, By Country, 2014�2020 (USD Million)
Table 44 North America Market, By Type, 2014-2021 (Kilotons)
Table 45 North America Market, By Type, 2014-2021 (USD Million)
Table 46 North America Market, By Application, 2014-2021 (Kilotons)
Table 47 North America Market, By Application, 2014-2021 (USD Million)
Table 48 North America Market, By End-Use Industry, 2014-2021 (Kilotons)
Table 49 North America Market, By End-Use Industry, 2014-2021 (USD Million)
Table 50 U.S. Market, By Application, 2014�2021 (Kilotons)
Table 51 U.S. Market, By Application, 2014�2021 (USD Million)
Table 52 U.S. Market, By End-Use Industry, 2014-2021 (Kilotons)
Table 53 U.S. Market, By End-Use Industry, 2014-2021 (USD Million)
Table 54 Canada Market, By Application, 2014�2021 (Kilotons)
Table 55 Canada Market, By Application, 2014�2021 (USD Million)
Table 56 Canada Market, By End-Use Industry, 2014-2021 (Kilotons)
Table 57 Canada Market, By End-Use Industry, 2014-2021 (USD Million)
Table 58 Mexico Market, By Application, 2014�2021 (USD Million)
Table 59 Mexico Market, By Application, 2014�2021 (USD Million)
Table 60 Mexico Market, By End-Use Industry, 2014-2021 (Kilotons)
Table 61 Mexico Market, By End-Use Industry, 2014-2021 (USD Million)
Table 62 Asia-Pacific Petroleum Resins Market, By Country, 2014-2021 (Kilotons)
Table 63 Asia-Pacific Market, By Country, 2014-2021 (USD Million)
Table 64 Asia-Pacific Market, By Type, 2014-2021 (Kilotons)
Table 65 Asia-Pacific Market, By Type, 2014-2021 (USD Million)
Table 66 Asia-Pacific Market, By Application, 2014-2021 (Kilotons)
Table 67 Asia-Pacific Market, By Application, 2014-2021 (USD Million)
Table 68 Asia-Pacific Market, By End-Use Industry, 2014-2021 (Kilotons)
Table 69 Asia-Pacific Market, By End-Use Industry, 2014-2021 (USD Million)
Table 70 China Market, By Application, 2014-2021 (Kilotons)
Table 71 China Market, By Application, 2014-2021 (USD Million)
Table 72 China Market, By End-Use Industry, 2014-2021 (Kilotons)
Table 73 China Market, By End-Use Industry, 2014-2021 (USD Million)
Table 74 India Market, By Application, 2014-2021 (Kilotons)
Table 75 India Market, By Application, 2014-2021 (USD Million)
Table 76 India Market, By End-Use Industry, 2014-2021 (Kilotons)
Table 77 India Market, By End-Use Industry, 2014-2021 (USD Million)
Table 78 Japan Market, By Application, 2014-2021 (Kilotons)
Table 79 Japan Market, By Application, 2014-2021 (USD Million)
Table 80 Japan Market, By End-Use Industry, 2014-2021 (Kilotons)
Table 81 Japan Market, By End-Use Industry, 2014-2021 (USD Million)
Table 82 South Korea Market, By Application, 2014-2021 (Kilotons)
Table 83 South Korea Market, By Application, 2014-2021 (USD Million)
Table 84 South Korea Market, By End-Use Industry, 2014-2021 (Kilotons)
Table 85 South Korea Market, By End-Use Industry, 2014-2021 (USD Million)
Table 86 Europe Petroleum Resins Market, By Country, 2013�2020 (Kilotons)
Table 87 Europe Market, By Country, 2014�2021 (USD Million)
Table 88 Europe Market, By Type, 2014-2021 (Kilotons)
Table 89 Europe Market, By Type, 2014-2021 (USD Million)
Table 90 Europe Market, By Application, 2014-2021 (Kilotons)
Table 91 Europe Market, By Application, 2014-2021 (USD Million)
Table 92 Europe Market, By End-Use Industry, 2014-2021 (Kilotons)
Table 93 Europe Market, By End-Use Industry, 2014-2021 (USD Million)
Table 94 Germany Market, By Application, 2014-2021 (Kilotons)
Table 95 Germany Market, By Application, 2014-2021 (USD Million)
Table 96 Germany Market, By End-Use Industry, 2014-2021 (Kilotons)
Table 97 Germany Market, By End-Use Industry, 2014-2021 (USD Million)
Table 98 France Market, By Application, 2014-2021 (Kilotons)
Table 99 France Market, By Application, 2014-2021 (USD Million)
Table 100 France Market, By End-Use Industry, 2014-2021 (Kilotons)
Table 101 France Market, By End-Use Industry, 2014-2021 (USD Million)
Table 102 Italy Market, By Application, 2014-2021 (Kilotons)
Table 103 Italy Market, By Application, 2014-2021 (USD Million)
Table 104 Italy Market, By End-Use Industry, 2014-2021 (Kilotons)
Table 105 Italy Market, By End-Use Industry, 2014-2021 (USD Million)
Table 106 Netherlands Market, By Application, 2014-2021 (Kilotons)
Table 107 Netherlands Market, By Application, 2014-2021 (USD Million)
Table 108 Netherlands Market, By End-Use Industry, 2014-2021 (Kilotons)
Table 109 Netherlands Market, By End-Use Industry, 2014-2021 (USD Million)
Table 110 Russia Market, By Application, 2014-2021 (Kilotons)
Table 111 Russia Market, By Application, 2014-2021 (USD Million)
Table 112 Russia Market, By End-Use Industry, 2014-2021 (Kilotons)
Table 113 Russia Market, By End-Use Industry, 2014-2021 (USD Million)
Table 114 Middle East & Africa Petroleum Resins Market, By Country, 2013�2020 (Kilotons)
Table 115 Middle East & Africa Market, By Country, 2013�2020 (USD Million)
Table 116 Middle East & Africa Market, By Type, 2014-2021 (Kilotons)
Table 117 Middle East & Africa Market, By Type, 2014-2021 (USD Million)
Table 118 Middle East & Africa Market, By Application, 2014-2021 (Kilotons)
Table 119 Middle East & Africa Market, By Application, 2014-2021 (USD Million)
Table 120 Middle East & Africa Market, By End-Use Industry, 2014-2021 (Kilotons)
Table 121 Middle East & Africa Market, By End-Use Industry, 2014-2021 (USD Million)
Table 122 Saudi Arabia Market, By Application, 2014-2021 (Kilotons)
Table 123 Saudi Arabia Market, By Application, 2014-2021 (USD Million)
Table 124 Saudi Arabia Market, By End-Use Industry, 2014-2021 (Kilotons)
Table 125 Saudi Arabia Market, By End-Use Industry, 2014-2021 (USD Million)
Table 126 U.A.E. Market, By Application, 2014-2021 (Kilotons)
Table 127 U.A.E. Market, By Application, 2014-2021 (USD Million)
Table 128 U.A.E. Market, By End-Use Industry, 2014-2021 (Kilotons)
Table 129 U.A.E. Market, By End-Use Industry, 2014-2021 (USD Million)
Table 130 Nigeria Market, By Application, 2014-2021 (Kilotons)
Table 131 Nigeria Market, By Application, 2014-2021 (USD Million)
Table 132 Nigeria Market, By End-Use Industry, 2014-2021 (Kilotons)
Table 133 Nigeria Market, By End-Use Industry, 2014-2021 (USD Million)
Table 134 Latin America Market, By Country, 2014-2021 (Kilotons)
Table 135 Latin America Market, By Country, 2014�2020 (USD Million)
Table 136 Latin America Market, By Type, 2014-2021 (Kilotons)
Table 137 Latin America Market, By Type, 2014-2021 (USD Million)
Table 138 Latin America Market, By Application, 2014-2021 (Kilotons)
Table 139 Latin America Market, By Application, 2014-2021 (USD Million)
Table 140 Latin America Market, By End-Use Industry, 2014-2021 (Kilotons)
Table 141 Latin America Market, By End-Use Industry, 2014-2021 (USD Million)
Table 142 Brazil Market, By Application, 2014-2021 (Kilotons)
Table 143 Brazil Market, By Application, 2014-2021 (USD Million )
Table 144 Brazil Market, By End-Use Industry, 2014-2021 (Kilotons)
Table 145 Brazil Market, By End-Use Industry, 2014-2021 (USD Million)
Table 146 Contracts, Expansions, Agreements, Joint Ventures & Collaborations, 2011-2015
Table 147 New Product Launches, 2011-2015
List of Figures (61 Figures)
Figure 1 Petroleum Resins Market Segmentation
Figure 2 Years Considered for the Study
Figure 3 Petroleum Resins Market: Research Design
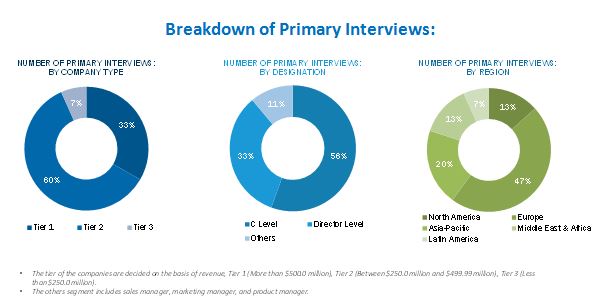
Figure 4 Breakdown of Primary Interviews, By Company Type, Designation& Region
Figure 5 Market Size Estimation Methodology: Bottom-Up Approach
Figure 6 Market Size Estimation Methodology: Top-Down Approach
Figure 7 Data Triangulation Methodology
Figure 8 Limitations of the Research Study
Figure 9 Adhesives & Sealants is the Largest Segment By Application in Petroleum Resins Market (2015) in Terms of Volume
Figure 10 Asia-Pacific is Expected to Dominate the Petroleum Resins Market During the Forecast Period
Figure 11 Petroleum Resins Market Size, By Country, 2015 (USD Million)
Figure 12 Petroleum Resins Market Share (Volume), By Region, 2015
Figure 13 Adhesives & Sealants Application in Asia-Pacific is Expected to Drive the Petroleum Resins Market During the Forecast Period
Figure 14 Hydrogenated Hydrocarbon Resins are Expected to Be the Fastest-Growing Type Between 2016 and 2021
Figure 15 China to Be the Largest Market in Asia-Pacific
Figure 16 China, the U.S., and Japan : Key Revenue Contributors of Petroleum Resins Market, 2015
Figure 17 China is the Fastest-Growing Market, 2016-2021
Figure 18 Adhesives & Sealants Application Dominates the Petroleum Resins Market
Figure 19 The Petroleum Resins Market in Asia-Pacific is in the Growth Phase
Figure 20 Petroleum Resins Market, By Region
Figure 21 Petroleum Resins Market Dynamics
Figure 22 Brent Crude Oil Prices (USD Per Barrel)
Figure 23 Naphtha Prices (USD /Ton)
Figure 24 Overview of Petroleum Resins Market Value Chain
Figure 25 Porter�s Five Forces Analysis :Petroleum Resins Market
Figure 26 Hydrogenated Hydrocarbon Resins is the Fastest-Growing Type Segment in the Petroleum Resins Market
Figure 27 Manufacturing Process: C5 Aliphatic Petroleum Resins
Figure 28 Asia-Pacific is Expected to Be the Largest Market for C5 Petroleum Resins Between 2016 and 2021
Figure 29 Asia-Pacific is Expected to Be the Largest Market for C9 Aromatic Petroleum Resins Between 2016 and 2021
Figure 30 Asia-Pacific is the Fastest-Growing Region in the Hydrogenated Hydrocarbon Resins Market Between 2016 and 2021
Figure 31 The Asia-Pacific C5/C9 Petroleum Resins Market is Projected to Grow at the Highest CAGR Between 2016 and 2021
Figure 32 Paints & Coatings is the Fastest-Growing Application Segment in the Petroleum Resins Market
Figure 33 Asia-Pacific is the Fastest-Growing Region in the Adhesives & Sealants Application Segment
Figure 34 Asia-Pacific is the Largest Regional Segment in the Petroleum Resins Market in Paints & Coatings Application
Figure 35 Middle East & Africa is the Second Fastest-Growing Regional Segment in the Petroleum Resins Market in Printing Ink Application
Figure 36 Asia-Pacific is the Largest Regional Segment in the Petroleum Resins Market in Rubber Compounding Application
Figure 37 Asia-Pacific is the Largest Regional Segment in the Petroleum Resins Market in Tapes & Labels Application
Figure 38 The Asia-Pacific Petroleum Resins Market in Others Application Segment is Projected to Grow at the Highest CAGR Between 2016 and 2021
Figure 39 Automotive is the Fastest-Growing End-Use Industry in the Petroleum Resins Market
Figure 40 Asia-Pacific is the Fastest-Growing Region for the Building & Construction End-Use Industry Segment
Figure 41 Asia-Pacific is the Largest Regional Segment in the Tire Industry
Figure 42 Asia-Pacific is the Largest Regional Segment in the Automotive Industry
Figure 43 Middle East & Africa is the Second Fastest-Growing Regional Segment in the Personal Hygiene Industry
Figure 44 Asia-Pacific is the Largest Regional Segment in the Consumer Goods Industry
Figure 45 The Others End-Use Industry Segment in the Asia-Pacific Region is Projected to Grow at the Highest CAGR During the Forecast Period
Figure 46 India, China, Japan, and Brazil are Emerging as Strategic Destinations
Figure 47 U.S. to Account for the Largest Share in the North America Petroleum Resins Market
Figure 48 Adhesives & Sealants Application Segment to Dominate the Petroleum Resins Market in the U.S. Between 2016 and 2021
Figure 49 Asia-Pacific is Expected to Be the Largest Market for Global Petroleum Resins Market: Regional Snapshot (2014)
Figure 50 Europe Market for Petroleum Resins: Regional Snapshot (2015)
Figure 51 Saudi Arabia is the Largest Consumer of Petroleum Resins in the Middle & Africa
Figure 52 Brazil is the Largest Market for Petroleum Resins in Latin America
Figure 53 Companies Adopted Contracts, Expansions, Agreements, Joint Ventures & Investments as the Key Strategies, 2011-2016
Figure 54 Battle for Market Share: Contracts, Expansions, Agreements, Joint Ventures & Investments Were the Key Strategy, 2011-2016
Figure 55 Eastman Chemical Company: Company Snapshot
Figure 56 Eastman Chemical Company: SWOT Analysis
Figure 57 Exxon Mobil Corporation : Company Snapshot
Figure 58 Exxon Mobil Corporation: SWOT Analysis
Figure 59 Arakawa Chemical Industries Limited: Company Snapshot
Figure 60 Kolon Industries, Inc.: Company Snapshot
Figure 61 Zeon Corporation: Company Snapshot


Growth opportunities and latent adjacency in Petroleum Resins Market