Phenol Derivatives Market by Derivatives (Bisphenol derivatives-A, Phenolic Resins, Caprolactam, Alkylphenol, and Other Derivatives), by Region - Global Forecast to 2026


[145 Pages Report] Phenol Derivatives Market is projected to be valued at USD 19.78 Billion by 2026, at a CAGR of 4.6% from 2016 to 2026. In this study, 2015 has been considered the base year and 2016 to 2026, the forecast period, to estimate the global market of phenol derivatives. The growing demand in the Asia-Pacific, coupled with the growing demand for automotive and electronics goods, is expected to drive the global phenol derivatives market during the forecast period.
Objectives of the Study
- To define and segment the global market for phenol derivatives by derivatives and region
- To estimate and forecast the global market for phenol derivatives in terms of value & volume
- To analyze significant region-specific trends of the market in Asia-Pacific, North America, Europe, South America, and the Middle East & Africa regions
- To estimate and forecast the global market for phenol derivatives by derivatives at the country level in each of the regions
- To identify and analyze the key drivers, restraints, and opportunities, and challenges influencing the phenol derivatives market
- To analyze recent market developments and competitive strategies such as expansions, agreements, and acquisitions to draw the competitive landscape in the global market for phenol derivatives
- To strategically identify and profile the key market players and analyze their core competencies in each derivatives of the global phenol derivatives market
This research study used extensive secondary sources, directories, and databases, such as Hoovers, Bloomberg BusinessWeek, and Factiva to identify and collect information useful for this technical, market-oriented, and commercial study of the global phenol derivatives market. The primary sources are mainly several industry experts from core and related industries and preferred suppliers, manufacturers, distributors, service providers, and organizations related to all segments of the industry�s supply chain. The bottom-up approach has been used to estimate the global market size of phenol derivatives on the basis of type, application, and region, in terms of value. The top-down approach has been implemented to validate the market size, in terms of value. With the data triangulation procedure, and validation of data through primary interviews, the exact values of the overall parent market and individual market sizes have been determined and confirmed in this study.
To know about the assumptions considered for the study, download the pdf brochure
The phenol derivatives supply chain includes raw material manufacturers such as Sinopec (China), Exxon Mobil Corporation (U.S.), Royal Dutch Shell Plc (Netherlands) which are major producers of benzene. Further, the products manufactured by these companies are used by phenol derivatives and its derivatives producers.
�This study answers several questions for the stakeholders, primarily which market segments they need to focus upon during the next two to ten years to prioritize their efforts and investments�
Target Audience:
- Phenol derivatives manufacturers
- Phenol derivatives traders, distributors, and suppliers
- End-use market participants of different segments of phenol derivatives
- Government and research organizations
- Associations and industrial bodies
- Research and consulting firms
- R&D institutions
- Environment support agencies
- Investment banks and private equity firms
Scope of the Report:
This research report categorizes the global market for phenol derivatives based on type, application, and region and forecasts the revenue growth and provides an analysis of the trends in each of the submarkets.
On the Basis of Derivatives:
- Bisphenol-A
- Phenolic Resin
- Alkylphenol
- Caprolactum
- Others
On the Basis of Region:
- Asia-Pacific
- China
- Taiwan
- India
- Japan
- South Korea
- Others
- North America
- U.S.
- Canada
- Mexico
- Europe
- Germany
- Italy
- France
- U.K.
- Russia
- Turkey
- Europe
- South America
- Brazil
- Argentina
- Others
- Middle East & Africa
- UAE
- Saudi Arabia
- Others
These segments are further described in detail with their subsegments in the report, with value forecasts till 2026.
Available Customizations: The following customization options are available for the report:
- Company Information
Analysis and profiles of additional global as well as regional market players (Up to three)
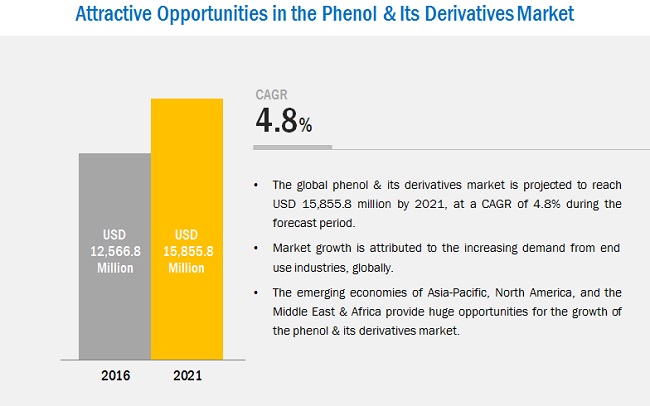
The global phenol derivatives market is projected to reach USD 19.78 Billion by 2026, at a CAGR of 4.6% from 2016 to 2026. Phenol derivatives are experiencing a high demand from the Asia-Pacific region mainly from China. Expansions and agreements activities undertaken by different companies for increasing the production capacity in the Asia-Pacific region is the key factors driving the growth of the phenol derivatives market. Phenol derivatives find numerous application in electronics & electrical goods and automotive through the polycarbonate and epoxy resins. Increasing demand from end-use industries such as wind energy, promoted the usage of phenol derivatives due to high use of epoxy resins in production of wind turbine blades. Shale oil/tight oil contains more amount naphtha than conventional oil, so the increase in shale oil exploration and production activities will further increase the supply of feedstock.
The bisphenol-A is projected to be the leading derivative in the phenol derivatives market from 2016 to 2026. Bisphenol-A is majorly used in the production of polycarbonates and epoxy resins. Polycarbonate is majorly used in food and drink packaging such as water & baby bottles, compact discs, impact-resistant safety equipment, and medical devices and epoxy resins are used to coat metal products such as food cans, bottle tops, and water supply pipes. Further the growth in end use industries using polycarbonate and epoxy resin resins will fuel the growth of phenol derivatives market.
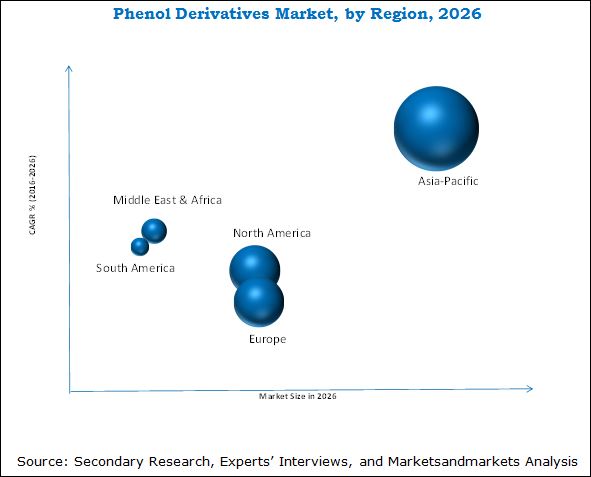
The Asia-Pacific region was the fastest-growing market for phenol derivatives, in terms of value, in 2015 and this trend is expected to continue till 2026. China, India, South Korea, and Japan are the major consumers in the Asia-Pacific region. The demand for phenol derivatives is primarily driven by the increasing population & urbanization in these countries which creates huge demand for electronics and automotive goods. Further these end use industries drives the phenol derivatives market. China is a major growing economy in the world, and the demand for phenol derivatives is expected to increase during the forecast period for the same region.
Though the global phenol derivatives market is growing at a moderate pace, a few factors are hampering the growth of this market. Such as, direct exposure to phenol derivatives is harmful to human body over a certain limit. Therefore to control this, some countries have already implemented regulatory standards to limit the exposure of phenol derivatives.
Companies such as Compa��a Espa�ola de Petr�leos S.A.U. (Spain), LG Chem (South Korea), Honeywell International Inc. (U.S.), INEOS (Switzerland), and Mitsui Chemicals, Inc. (Japan) are the leading market participants in the global phenol derivatives market. These companies have been adopting various organic and inorganic growth strategies such as expansions, acquisitions, and agreements to expand their market shares of phenol derivatives.
To speak to our analyst for a discussion on the above findings, click Speak to Analyst
 Exclusive indicates content/data unique to MarketsandMarkets and not available with any competitors.
Table of Contents
1 Introduction (Page No. - 16)
1.1 Objectives of the Study
1.2 Market Definition
1.2.1 Markets Covered
1.2.2 By Region
1.2.3 Years Considered for the Study
1.3 Currency Considered
1.4 Limitations
1.5 Stakeholders
2 Research Methodology (Page No. - 20)
2.1 Research Data
2.1.1 Secondary Data
2.1.1.1 Key Data From Secondary Sources
2.1.2 Primary Data
2.1.2.1 Key Data From Primary Sources
2.1.2.2 Key Industry Insights
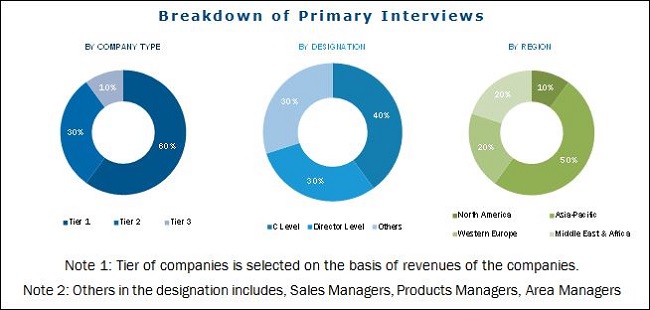
2.1.2.3 Breakdown of Primary Interviews
2.2 Market Size Estimation
2.3 Data Triangulation
2.4 Research Assumptions
3 Executive Summary (Page No. - 28)
4 Premium Insights (Page No. - 31)
4.1 Attractive Opportunities in the Phenol Derivatives Market
4.2 Phenol Derivatives Market Growth, By Derivatives
4.3 Phenol Derivatives Market Share, By Region and Derivatives, 2015
4.4 Phenol Derivatives Market Attractiveness
5 Market Overview (Page No. - 34)
5.1 Introduction
5.2 Market Segmentation
5.2.1 By Derivatives
5.2.2 By Raw Material
5.2.3 By Technology
5.3 Market Dynamics
5.3.1 Drivers
5.3.1.1 Short-Term Drivers
5.3.1.1.1 Increasing Demand From Asia-Pacific Region
5.3.1.2 Mid-Term Drivers
5.3.1.2.1 Rising Demand From End-Use Industries
5.3.1.3 Long-Term Drivers
5.3.1.3.1 Growth in Wind Energy Sector
5.3.2 Restraints
5.3.2.1 Generation of Hazardous Waste During Production of Phenol
5.3.3 Opportunities
5.3.3.1 Extraction of Raw Material From Shale Oil/Tight Oil
5.3.4 Challenges
5.3.4.1 Health & Safety Concerns Associated With Phenol Derivatives
6 Industry Trends (Page No. - 41)
6.1 Introduction
6.2 Value Chain Analysis
6.3 Porter�s Five Forces Analysis
6.3.1 Bargaining Power of Suppliers
6.3.2 Threat of New Entrants
6.3.3 Threat of Substitutes
6.3.4 Bargaining Power of Buyers
6.3.5 Intensity of Competitive Rivalry
6.4 Economic Indicators
6.4.1 Trend of Production of Oil
6.5 Patent Analysis
6.5.1 Introduction
6.5.2 Patent Analysis of Phenol Derivatives, By Derivatives
6.5.3 Patent Analysis of Phenol Derivatives, By Region
7 Phenol Derivatives Market, By Raw Material (Page No. - 49)
7.1 Introduction
7.2 Benzene
7.3 Propylene
7.4 Toulene
8 Phenol Derivatives Market, By Technology (Page No. - 51)
8.1 Introduction
8.2 Cumene Peroxidation Process
8.3 Raschig Process
8.4 Toluene Two Stage Oxidation Process
8.5 Sulphonation Process
9 Phenol Derivatives Market, By Derivative (Page No. - 53)
9.1 Introduction
9.2 Bisphenol-A
9.2.1 Polycarbonate
9.2.1.1 Optical Media
9.2.1.2 Automotive
9.2.1.3 Electrical & Electronic Appliances
9.2.2 Epoxy Resin
9.2.2.1 Marine
9.2.2.2 Can Coating
9.2.2.3 Others
9.3 Phenolic Resin
9.3.1 Bakelite
9.3.1.1 Coating Industry
9.3.1.2 Adhesives
9.3.2 Others
9.4 Caprolactam
9.4.1 Nylon Fiber
9.4.1.1 Textile/Fabric
9.4.1.2 Industrial Yarn
9.5 Alkylphenol
9.5.1 Detergents
9.5.2 Additives
9.6 Other Derivatives
9.6.1 Aminophenol
9.6.1.1 Dye
9.6.1.2 Pharmaceutical Drugs
9.6.2 Cresol
9.6.2.1 Antioxidants
9.6.2.2 Pesticides
10 Phenol Derivatives Market, By Region (Page No. - 68)
10.1 Introduction
10.2 Asia-Pacific
10.2.1 China
10.2.2 South Korea
10.2.3 Taiwan
10.2.4 Japan
10.2.5 India
10.2.6 Rest of Asia-Pacific
10.3 Europe
10.3.1 Germany
10.3.2 Italy
10.3.3 U.K.
10.3.4 France
10.3.5 Russia
10.3.6 Turkey
10.3.7 Rest of Europe
10.4 North America
10.4.1 U. S.
10.4.2 Canada
10.4.3 Mexico
10.5 Middle East & Africa
10.5.1 Saudi Arabia
10.5.2 UAE
10.5.3 Rest of Middle East & Africa
10.6 South America
10.6.1 Brazil
10.6.2 Argentina
10.6.3 Rest of South America
11 Competitive Landscape (Page No. - 106)
11.1 Overview
11.2 Expansions: the Most Popular Growth Strategy
11.3 Market Share Analysis
11.4 Competitive Situation and Trends
11.4.1 Expansions
11.4.2 Agreements
11.4.3 Acquisitions
11.4.4 Joint Ventures
12 Company Profile (Page No. - 111)
(Business Overview, Products & Services, Key Insights, Recent Developments, SWOT Analysis, MnM View)*
12.1 Royal Dutch Shell PLC
12.2 The DOW Chemical Company
12.3 Mitsui Chemicals, Inc.
12.4 Saudi Basic Industries Corporation (SABIC)
12.5 INEOS
12.6 Compa��a Espa�ola De Petr�leos S.A.U. (CEPSA)
12.7 Honeywell International Inc.
12.8 LG Chem
12.9 Kumho Petrochemical Co., Ltd.
12.10 PTT Global Chemical Public Company Limited
12.11 Additional Company Profile
12.11.1 Altivia Petrochemicals LLC
12.11.2 Solvay SA
12.11.3 Chang Chun Petrochemical Co. Ltd.
12.11.4 Formosa Chemicals and Fibre Corporation
12.11.5 Taiwan Prosperity Chemicals Corporation
12.11.6 Versalis
12.11.7 Borealis
12.11.8 Novapex
12.11.9 DOMO Chemicals
12.11.10 Georgia Gulf Corporation
12.11.11 Zaozhuang Hailong Chemical Co., Ltd
12.11.12 Allnex Belgium SA
12.11.13 Hexion LLC
*Details on Business Overview, Products & Services, Key Insights, Recent Developments, SWOT Analysis, MnM View Might Not Be Captured in Case of Unlisted Companies.
13 Appendix (Page No. - 137)
13.1 Insights From Industry Experts
13.2 Discussion Guide
13.3 Knowledge Store: Marketsandmarkets� Subscription Portal
13.4 Introducing RT : Real Time Market Intelligence
13.5 Author Details
List of Tables (86 Tables)
Table 1 Phenol Derivatives Market, By Derivatives
Table 2 Phenol Derivatives Market, By Raw Material
Table 3 Phenol Derivatives Market, By Technology
Table 4 Trend of Oil Production, Thousand Barrels Per Day (2011�2015)
Table 5 Phenol Derivatives Market Size, By Derivative, 2014�2026 (USD Billion)
Table 6 Phenol Derivatives Market Size, By Derivative, 2014�2026 (Thousand Ton)
Table 7 Bisphenol-A Market Size, By Region, 2014�2026 (USD Million)
Table 8 Bisphenol-A Market Size, By Region, 2014�2026 (Thousand Ton)
Table 9 Phenolic Resin Market Size, By Region, 2014�2026 (USD Million)
Table 10 Phenolic Resin Market Size, By Region, 2014�2026 (Thousand Ton)
Table 11 Caprolactam Market Size, By Region, 2014�2026 (USD Million)
Table 12 Caprolactam Market Size, By Region, 2014�2026 (Thousand Ton)
Table 13 Alkylphenol Market Size, By Region, 2014�2026 (USD Million)
Table 14 Alkylphenol Market Size, By Region, 2014�2026 (Thousand Ton)
Table 15 Other Derivatives Market Size, By Region, 2014�2026 (USD Million)
Table 16 Other Derivatives Market Size, By Region, 2014�2026 (Thousand Tone)
Table 17 Phenol Derivatives Market Size, By Region, 2014�2026 (USD Billion)
Table 18 Phenol Derivatives Market Size, By Region, 2014�2026 (Thousand Ton)
Table 19 Asia-Pacific: Phenol Derivatives Market Size, By Country, 2014�2026 (USD Billion)
Table 20 Asia-Pacific: Market Size, By Country, 2014�2026 (Thousand Ton)
Table 21 Asia-Pacific: Market Size, By Derivatives, 2014�2026 (USD Billion)
Table 22 Asia-Pacific: Market Size, By Derivatives, 2014�2026 (Thousand Ton)
Table 23 China: Phenol Derivatives Market Size, By Derivatives, 2014�2026 (USD Million)
Table 24 China: Market Size, By Derivatives, 2014�2026 (Thousand Ton)
Table 25 South Korea: Phenol Derivatives Market Size, By Derivatives, 2014�2026 (USD Million)
Table 26 South Korea: Market Size, By Derivatives, 2014�2026 (Thousand Ton)
Table 27 Taiwan: Phenol Derivatives Market Size, By Derivatives, 2014�2026 (USD Million)
Table 28 Taiwan: Market Size, By Derivatives, 2014�2026 (Thousand Ton)
Table 29 Japan: Phenol Derivatives Market Size, By Derivatives, 2014�2026 (USD Million)
Table 30 Japan: Market Size, By Derivatives, 2014�2026 (Thousand Ton)
Table 31 India: Phenol Derivatives Market Size, By Derivatives, 2014�2026 (USD Million)
Table 32 India: Market Size, By Derivatives, 2014�2026 (Thousand Ton)
Table 33 Rest of Asia-Pacific: Phenol Derivatives Market Size, By Derivatives, 2014�2026 (USD Million)
Table 34 Rest of Asia-Pacific: Market Size, By Derivatives, 2014�2026 (Thousand Ton)
Table 35 Europe: Phenol Derivatives Market Size, By Country, 2014�2026 (USD Billion)
Table 36 Europe: Market Size, By Country, 2014�2026 (Thousand Ton)
Table 37 Europe: Market Size, By Derivatives, 2014�2026 (USD Billion)
Table 38 Europe: Market Size, By Derivatives, 2014�2026 (Thousand Ton)
Table 39 Germany: Phenol Derivatives Market Size, By Derivatives, 2014�2026 (USD Million)
Table 40 Germany: Market Size, By Derivatives, 2014�2026 (Thousand Ton)
Table 41 Italy: Phenol Derivatives Market Size, By Derivatives, 2014�2026 (USD Million)
Table 42 Italy: Phenol Derivative Market Size, By Derivatives, 2014�2026 (Thousand Ton)
Table 43 U.K.: Phenol Derivatives Market Size, By Derivatives, 2014�2026 (USD Million)
Table 44 U.K.: Phenol Derivative Market Size, By Derivatives, 2014�2026 (Thousand Ton)
Table 45 France: Phenol Derivatives Market Size, By Derivatives, 2014�2026 (USD Million)
Table 46 France: Phenol Derivative Market Size, By Derivatives, 2014�2026 (Thousand Ton)
Table 47 Russia: Phenol Derivatives Market Size, By Derivatives, 2014�2026 (USD Million)
Table 48 Russia: Phenol Derivative Market Size, By Derivatives, 2014�2026 (Thousand Ton)
Table 49 Turkey: Phenol Derivatives Market Size, By Derivatives, 2014�2026 (USD Million)
Table 50 Turkey: Phenol Derivative Market Size, By Derivatives, 2014�2026 (Thousand Ton)
Table 51 Rest of Europe: Phenol Derivatives Market Size, By Derivatives, 2014�2026 (USD Million)
Table 52 Rest of Europe: Phenol Derivative Market Size, By Derivatives, 2014�2026 (Thousand Ton)
Table 53 North America: Phenol Derivatives Market Size, By Country, 2014�2026 (USD Billion)
Table 54 North America: Phenol Derivative Market Size, By Country, 2014�2026 (Thousand Ton)
Table 55 North America: Phenol Derivative Market Size, By Derivatives, 2014�2026 (USD Billion)
Table 56 North America: Phenol Derivative Market Size, By Derivatives, 2014�2026 (Thousand Ton)
Table 57 U.S.: Phenol Derivatives Market Size, By Derivatives, 2014�2026 (USD Million)
Table 58 U.S.: Phenol Derivative Market Size, By Derivatives, 2014�2026 (Thousand Ton)
Table 59 Canada: Phenol Derivatives Market Size, By Derivatives, 2014�2026 (USD Million)
Table 60 Canada: Phenol Derivative Market Size, By Derivatives, 2014�2026 (Thousand Ton)
Table 61 Mexico: Phenol Derivatives Market Size, By Derivatives, 2014�2026 (USD Million)
Table 62 Mexico: Phenol Derivative Market Size, By Derivatives, 2014�2026 (Thousand Ton)
Table 63 Middle East & Africa: Phenol Derivatives Market Size, By Country, 2014�2026 (USD Billion)
Table 64 Middle East & Africa: Market Size, By Country, 2014�2026 (Thousand Ton)
Table 65 Middle East & Africa: Market Size, By Derivatives, 2014�2026 (USD Billion)
Table 66 Middle East & Africa: Market Size, By Derivatives, 2014�2026 (Thousand Ton)
Table 67 Saudi Arabia: Phenol Derivatives Market Size, By Derivatives, 2014�2026 (USD Million)
Table 68 Saudi Arabia: Phenol Derivative Market Size, By Derivatives, 2014�2026 (Thousand Ton)
Table 69 UAE: Phenol Derivatives Market Size, By Derivatives , 2014�2026 (USD Million)
Table 70 UAE: Market Size, By Derivatives, 2014�2026 (Thousand Ton)
Table 71 Rest of Middle East & Africa: Phenol Derivatives Market Size, By Derivatives, 2014�2026 (USD Million)
Table 72 Rest of Middle East & Africa: Phenol & Its Derivative Market Size, By Derivatives, 2014�2026 (Thousand Ton)
Table 73 South America: Phenol Derivatives Market Size, By Country, 2014�2026 (USD Billion)
Table 74 South America: Market Size, By Country, 2014�2026 (Thousand Ton)
Table 75 South America: Market Size, By Derivatives, 2014�2026 (USD Billion)
Table 76 South America: Market Size, By Derivatives, 2014�2026 (Thousand Ton)
Table 77 Brazil: Phenol Derivatives Market Size, By Derivatives, 2014�2026 (USD Million)
Table 78 Brazil: Market Size, By Derivatives, 2014�2026 (Thousand Ton)
Table 79 Argentina: Phenol Derivatives Market Size, By Derivatives, 2014�2026 (USD Million)
Table 80 Argentina: Market Size, By Derivatives, 2014�2026 (Thousand Ton)
Table 81 Rest of South America: Phenol Derivatives Market Size, By Derivatives , 2014�2026 (USD Million)
Table 82 Rest of South America: Phenol Derivative Market Size, By Derivatives, 2014�2026 (Thousand Ton)
Table 83 Expansions, 2011�2015
Table 84 Agreements, 2011�2015
Table 85 Acquisitions, 2011�2015
Table 86 Joint Ventures, 2011�2016
List of Figures (52 Figures)
Figure 1 Phenol Derivatives: Market Segmentation
Figure 2 Years Considered for the Study
Figure 3 Phenol Derivatives Market: Research Design
Figure 4 Key Data From Secondary Sources
Figure 5 Key Data From Primary Sources
Figure 6 Key Industry Insights
Figure 7 Breakdown of Primary Interviews
Figure 8 Market Size Estimation: Bottom-Up Approach
Figure 9 Market Size Estimation: Top-Down Approach
Figure 10 Data Triangulation
Figure 11 Research Assumptions
Figure 12 Asia-Pacific Dominated the Phenol Derivatives Market in 2015
Figure 13 Bisphenol-A to Dominate the Phenol Derivatives Market Between 2016 and 2021
Figure 14 Phenol Derivatives Market to Witness Moderate Growth Between 2016 and 2021
Figure 15 Bisphenol-A to Be the Fastest-Growing Segment Between 2016 and 2021
Figure 16 Bisphenol-A Accounted for Largest Share of Phenol Derivatives Market in 2015
Figure 17 Phenol Derivatives Market to Register High Growth in Asia-Pacific Between 2016 and 2021
Figure 18 Drivers, Restraints, Opportunities, and Challenges for the Phenol Derivatives Market
Figure 19 Phenol Derivatives Market: Impact Analysis, 2015-2026
Figure 20 Value Chain Analysis of the Phenol Derivatives Market
Figure 21 Porter�s Five Forces Analysis
Figure 22 U.S. Was the Largest Oil Producer, Thousand Barrels Per Day, 2015
Figure 23 Phenolic Resin is the Most Researched Derivative of Phenol, 2011�2016
Figure 24 U.S. Accounts for Most Patents Filed for Phenol, 2011�2016
Figure 25 Bisphenol-A to Drive the Phenol Market Between 2016 and 2021
Figure 26 Asia-Pacific Projected to Be the Largest Market for Bisphenol-A Derivative Between 2016 and 2021
Figure 27 Asia-Pacific Projected to Be the Largest Market for Phenolic Resin Derivative Between 2016 and 2021
Figure 28 Asia-Pacific to Witness Highest Growth for Caprolactam Derivative Between 2016 and 2021
Figure 29 Asia-Pacific is the Largest Market for Alkylphenol Derivative, 2016 - 2021
Figure 30 Asia-Pacific is Projected to Be the Fastest-Growing Market in Other Derivatives Segment
Figure 31 Asia-Pacific Market Snapshot: China is the Fastest-Growing Market, 2016�2021
Figure 32 Europe Market Snapshot: Germany is the Largest Market
Figure 33 North American Market Snapshot: Mexico Projected to Be the Fastest-Growing Market, 2016�2021
Figure 34 Middle East & Africa Market Snapshot: UAE to Be the Largest and the Fastest-Growing Market, 2016�2021
Figure 35 South America Phenol Derivatives Market Snapshot: Brazil is the Largest Market
Figure 36 Companies Adopted Expansion as the Key Growth Strategy, 2011�2015
Figure 37 Key Growth Strategies in Phenol Derivatives Market, 2011�2015
Figure 38 Phenol Market Share Analysis
Figure 39 Royal Dutch Shell PLC.: Company Snapshot
Figure 40 Royal Dutch Shell PLC.: SWOT Analysis
Figure 41 The DOW Chemical Company: Company Snapshot
Figure 42 The DOW Chemical Company: SWOT Analysis
Figure 43 Mitsui Chemicals, Inc.: Company Snapshot
Figure 44 Mitsui Chemicals, Inc.: SWOT Analysis
Figure 45 Saudi Basic Industries Corporation (SABIC): Company Snapshot
Figure 46 Saudi Basic Industries Corporation (SABIC): SWOT Analysis
Figure 47 INEOS: SWOT Analysis
Figure 48 CEPSA: Company Snapshot
Figure 49 Honeywell International Inc.: Company Snapshot
Figure 50 LG Chem: Company Snapshot
Figure 51 Kumho Petrochemical Co., Ltd.: Company Snapshot
Figure 52 PTT Global Chemical Public Company Limited: Company Snapshot


Growth opportunities and latent adjacency in Phenol Derivatives Market