Photometer & Calorimeter Market by Type (Portable Photometer, Flame Photometer, Bomb Calorimeter, Reaction Calorimeter, & Other Photometers & Calorimeters ), Application(Biomedical, Research, Process Industries, & Others), and Geography - Global Forecast to 2013 - 2020


The photometer & calorimeter market report primarily deals with different types and applications of photometer & calorimeter. This report segments global photometer & calorimeter market into three different segments such as: type, application, and geography. The report entails the market analysis and forecasts related to photometer & calorimeter. This report deals with all the driving factors, restraints, and opportunities for the photometer & calorimeter market, which is helpful in identifying trends and key success factors for measuring, analytical & laboratory equipment manufacturing industry. The report also profiles the major companies that are active in the field of developing and manufacturing photometer & calorimeter along with their product offerings, strategy, financial details, developments, and competitive landscape. It also highlights the winning imperatives and burning issues, pertaining to the global industries.
The market is segmented into four major geographical regions; namely North America, Europe, Asia-Pacific, and Rest of the World. The current and future trends for each region have been analyzed in this report. The Porter�s five force model analysis, market share of major players, and competitive landscaping are also included in the report. The global photometer & calorimeter market is expected to reach 162.53 million and 252.79 million by 2020 at an estimated CAGR of 12.19% and 11.39% respectively from 2014 to 2020. The Americas is the leading region in the overall photometer market followed by Europe and Asia-Pacific with 11.71 % and 14.95 % each in 2014. While the Americas are the leading region in the overall calorimeter market followed by Europe and Asia-Pacific with 10.51% and 13.68 % each in 2014.
Scope of the report
This research report categorizes the photometer & calorimeter market based on type, applications, and geography. It also covers the forecasted revenue of photometer & calorimeter market.
On the basis of type
The report highlights various different types of photometer like microscopic, multi-wave, microplate, flame and portable photometer with an overview of their growth potential. Also it includes different types of calorimeters such as differential scanning, coffee cup, reaction, accelerated rate, and bomb calorimeter.
On the basis of application
Global photometer & calorimeter market is categorized into aerospace, automotive, biomedical, research, process industry which includes chemical, oil & gas, food & beverages, water & waste water. Biomedical, process industry applications continue to dominate the photometer & calorimeter market.
On the basis of geography
Geographical analysis covers North America, Europe, Asia-Pacific, and RoW. North America covers the U.S. and Canada. Europe covers the major countries like Germany, Italy, U.K., France, and so on. Asia-Pacific (APAC) covers China, India and so on.
The photometer & calorimeter market is expected to grow due to technological advancement and high requirements of measuring, analytical, and laboratory equipment in various application fields such as, automotive, aerospace, biomedical, research and process industry such as petrochemicals, water & wastewater, and chemicals sector. In photometer, the current market is dominated by flame, portable photometers; while the calorimeter market is mainly dominated by bomb calorimeter and differential scanning calorimeter. Many multinational companies are investing heavily in acquisitions and R&D activities for more innovations and product development involving optic & thermal analysis technologies. The government initiatives for industrial, as well as in municipal wastewater treatment in developed economies and in the developing economies like India and China are acting as the strong driving force for photometer & calorimeter market.
The report briefly explains the market drivers, challenges, opportunities, and trends in the photometer & calorimeter market. This report also provides information of different types of photometer such as microscope, multi-wave, fiber optic, infrared, ultraviolet, micro-plate, flame, and portable photometer. While the different types of calorimeter includes differential scanning calorimeter, isothermal micro-calorimeter, adiabatic and accelerated rate. The different applications of photometer & calorimeter that are included in the report are biomedical, process industry, aerospace, research, electronics, automotive, and others such as Nano science, geology, and energy & synthetics. The company profiles consist of the company overview, financial overview, business strategy, and the recent developments. The big players which provides the different photometer & calorimeter for end user applications are include in the report such as, are ABB Ltd. (Switzerland), Swan Analytical Instruments AG (Switzerland), Yokogawa Electric Corporation (Japan), Setaram Instrumentation (France), Gooch & House (U.K.), Mettler-Toledo International Inc. (U.S.), Konica Minolta, Inc. (Japan), and Hanna Instruments (U.S.).
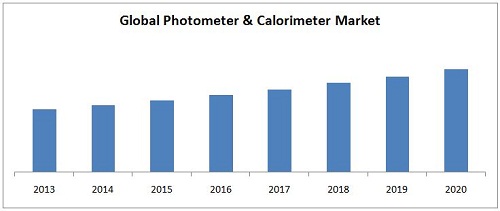
The global photometer & calorimeter market is expected to reach 162.53 million and 252.79 million by 2020 at an estimated CAGR of 12.19% and 11.39% respectively from 2014 to 2020. The Americas is the leading region in the overall photometer market followed by Europe and Asia-Pacific with 11.71 % and 14.95 % each in 2014. While in Calorimeter again, the Americas is the leading region followed by Europe and Asia-Pacific with 10.54 % and 13.69 % each in 2014.
 Exclusive indicates content/data unique to MarketsandMarkets and not available with any competitors.
Table of Contents
1 Introduction (Page No. - 15)
1.1 Objectives of the Study
1.2 Markets Covered
1.3 Stakeholders
1.4 Market Scope
1.4.1 Year
1.4.2 Currency
1.4.3 Limitation
2 Research Methodology (Page No. - 17)
2.1 Market Size Estimation
2.2 Market Crackdown and Data Trangulation
2.3 Market Share Estimation
2.3.1 Key Points Taken From Secondary Sources
2.3.2 Key Points Taken From Primary Sources
2.3.2.1 Key Industry Insights
2.4 Assumptions
3 Executive Summary (Page No. - 23)
4 Premium Insights (Page No. - 26)
4.1 Attractive Opportunites in the Photometer Market
4.2 Attractive Opportunites in the Calorimeter Market
4.3 Photometer� Top Product Segments
4.4 Calorimeter� Top Product Segments
4.5 Photometer Market in the Asia-Pacific Region
4.6 The Americas Dominate the Photometer Market Across Regions
4.7 Photometer & Calorimeter Market, By Geography and Application (2013)
4.8 Photometer & Calorimeter Market: Developed Vs. Non-Developed Nations
4.9 The Photometer & Calorimeter Market Has A Promising Future in Emerging Economies of the APAC Region
4.10 Life Cycle Analysis of the Photometer & Calorimeter Market, By Geography
5 Market Overview (Page No. - 32)
5.1 Introduction
5.2 Evolution of Photometer and Calorimeter
5.3 Photometer & Calorimeter Market Segmentation
5.4 Photometer & Calorimeter Market Dynamics
5.4.1 Drivers
5.4.1.1 Demand for Waste Water Treatment Equipment is Increasing at A Tremendous Rate
5.4.1.2 Need of Calorimeter to Determine the Heat Value of Petroleum Products
5.4.2 Restraints
5.4.2.1 High Unit Cost of Photometer and Calorimeter
5.4.2.2 Adhere to Regulatory Compliances Affect the Photometer and Calorimeter Industry
5.4.3 Opportunities
5.4.3.1 Development of Oil and Gas Industry is Expected to Be the Future of the Calorimeter Market
5.4.3.2 Demand for Photometer in Water and Wastewater Treatment Industries
5.4.4 Challenges
5.4.4.1 R&D Investment Needed to Make Photometer and Calorimeter More Innovative and Technically Advanced
5.4.5 Burning Issue
5.4.5.1 Current Economic Uncertainty and Slow Growth in the Developed Markets
5.4.6 Winning Imperatives
5.4.6.1 Use of Photometer and Calorimeter With Advanced Infrastructure Will Create Opportunities in Various Industries
6 Industry Analysis (Page No. - 41)
6.1 Introduction
6.2 Value Chain Analysis
6.3 Supply Chain Analysis
6.4 Industry Trends
6.5 Porter�s Five forces Model
6.5.1 Threat of New Entrants
6.5.2 Threat 0f Substitutes
6.5.3 Bargaining Power of Buyers
6.5.4 Bargaining Power of Suppliers
6.5.5 Intensity of Rivalry
6.6 Strategic Benchmarking
6.6.1 Technology Integration & Product Enhancement
7 Photometer Market, By Types (Page No. - 50)
7.1 Introduction
7.2 Microscope Photometer
7.2.1 The Science Behind the Microscope Photometer
7.3 Multiwave Photometer
7.3.1 Multi-Wave Fiber Optic Photometer
7.3.2 Multi-Wave Infrared Photometer
7.3.3 Multi-Wave Ultraviolet Photometer
7.4 Microplate Photometer
7.5 Flame Photometer
7.6 Portable Photometer
7.7 Others
7.8 Photometer & Calorimeter Market Insight- Photometer Application Market By Geography
8 Calorimeter Market By Type (Page No. - 67)
8.1 Introduction
8.2 Accerated Rate Calorimeter
8.3 Bomb Calorimeter
8.4 Coffee Cup Calorimetr
8.5 Differential Scanning Calorimeter
8.6 Microcalorimeter
8.7 Reaction Calorimeter
8.8 Others
8.9 Market Insight- Calorimeter Application Market By Geography
9 Photometer & Calorimeter Market, By Applications (Page No. - 80)
9.1 Introduction
9.2 Aerospace
9.3 Automotive
9.4 Biomedical
9.5 Process Industry
9.5.1 Water & Waste Water
9.5.2 Chemical, Petrochemical, Oil & Gas
9.5.3 Food & Beverages
9.6 Research
9.7 Others
10 Geographic Analysis (Page No. - 99)
10.1 Introduction
10.2 Americas
10.2.1 North America
10.2.1.1 U.S
10.2.1.2 Canada
10.2.1.3 Mexico
10.2.2 South America
10.3 Europe
10.3.1 Germany
10.3.2 France
10.3.3 Spain
10.3.4 U.K.
10.3.5 Others
10.4 Asia-Pacific (APAC)
10.4.1 China
10.4.2 India
10.4.3 Japan
10.4.4 South Korea
10.4.5 Others
10.5 Rest of the World
10.5.1 Israel
10.6 The Middle East and Africa
11 Competitive Landscape (Page No. - 133)
11.1 Overview
11.2 Photometer & Calorimeter Market Share Analysis, Photometer & Calorimeter Market
11.3 Competitive Situation and Trends
11.3.1 New Product Launches
11.3.2 Agreements, Partnerships, Collaborations, and Joint Ventures
11.3.1 Mergers and Acquisitions
11.3.2 Expansions
11.3.3 Other Developments
12 Company Profiles (Page No. - 144)
12.1 Introduction
12.2 ABB Ltd.
12.2.1 Business Overview
12.2.2 Product Portfolio
12.2.3 Key Strategy
12.2.4 Recent Developments
12.2.5 SWOT Analysis
12.2.6 MNM View
12.3 Gooch & Housego PLC.
12.3.1 Business Overview
12.3.2 Product Portfolio
12.3.3 Key Strategy
12.3.4 Recent Developments
12.3.5 SWOT Analysis
12.3.6 MNM View
12.4 Hanna Instruments Inc.
12.4.1 Business Overview
12.4.2 Product Portfolio
12.4.3 Key Strategy
12.4.4 Recent Developments
12.5 Konica Minolta, Inc.
12.5.1 Business Overview
12.5.2 Product Portfolio
12.5.3 Key Strategy
12.5.4 Recent Developments
12.5.5 SWOT Analysis
12.5.6 MNM View
12.6 Mettler-Toledo International, Inc.
12.6.1 Business Overview
12.6.2 Products and Services
12.6.3 Key Strategy
12.6.4 Recent Developments
12.6.5 SWOT Analysis
12.7 PARR Instrument Company.
12.7.1 Business Overview
12.7.2 Product Portfolio
12.7.3 Key Strategy
12.7.4 Recent Developments
12.8 Setaram Instrumentation
12.8.1 Business Overview
12.8.2 Product Portfolio
12.8.3 Key Strategy
12.8.4 Recent Developments
12.9 SWAN Analytische Instrumente Ag
12.9.1 Business Overview
12.9.2 Product Portfolio
12.9.3 Key Strategy
12.9.4 Recent Developments
12.10 TA Instruments Inc.
12.10.1 Business Overview
12.10.2 Product Portfolio
12.10.3 Key Strategy
12.10.4 Recent Developments
12.11 Yokogawa Electric Corporation
12.11.1 Business Overview
12.11.2 Product Portfolio
12.11.3 Key Strategy
12.11.4 Recent Developments
12.11.5 SWOT Analysis
12.11.6 MNM View
13 Appendix (Page No. - 182)
13.1 Discussion Guide
13.2 Introducing RT: Real-Time Market Intelligence
13.3 Available Customizations
List of Tables (128 Tables)
Table 1 Driver Analysis
Table 2 Restraint Analysis
Table 3 Opportunity Analysis
Table 4 Challenge Analysis
Table 5 Some of the Prominent Companies in the Photometer & Calorimeter Market
Table 6 Global Photometer Market Size, By Type, 2013 � 2020 ($Million)
Table 7 Microscope Photometer Applications
Table 8 Global Microscope Photometer Market Size, By Application, 2013 � 2020 ($Million)
Table 9 Multiwave Photometer Benefits in Field Proven Process Mesurement
Table 10 Multiwave Photometer Benefits in Field Proven Process Mesurement
Table 11 Global Multiwave Photometer Market Size, By Application, 2013 � 2020 ($Million)
Table 12 Microplate Photometer Applications
Table 13 Global Microplate Photometer Market Size, By Application, 2013 � 2020 ($Million)
Table 14 Flame Photometer Industry Wise Applications
Table 15 Global Flame Photometer Market Size, By Application, 2013 � 2020 ($Million)
Table 16 Global Portable Photometer Market Size, By Application, 2013 � 2020 ($Million)
Table 17 Global Other Photometer Market Size, By Application, 2013 � 2020 ($Million)
Table 18 Global Photometer Market Size for Aerospace Industry, By Geography, 2013 � 2020 ($Million)
Table 19 Global Photometer Market Size for Automotive Industry, By Geography, 2013 � 2020 ($Million)
Table 20 Global Photometer Market Size for Biomedical Sector, By Geography, 2013 � 2020 ($Million)
Table 21 Global Photometer Market Size for Process Industry, By Geography, 2013 � 2020 ($Million)
Table 22 Global Photometer Market Size for Research, By Geography, 2013 � 2020 ($Million)
Table 23 Global Photometer Market Size for Other Application, By Geography, 2013 � 2020 ($Million)
Table 24 Global Calorimeter Market Size, By Type, 2013 � 2020 ($Million)
Table 25 Global Accelerated Rate Calorimeter Market Size, By Application, 2013 � 2020 ($Million)
Table 26 Global Bomb Calorimeter Market Size, By Application, 2013 � 2020 ($Million)
Table 27 Global Coffee Cup Calorimeter Market Size, By Application, 2013 � 2020 ($Million)
Table 28 Global Differential Scanning Calorimeter Market Size, By Application, 2013 � 2020 ($Million)
Table 29 Global Microcalorimeter Market Size, By Application, 2013 � 2020 ($Million)
Table 30 Global Reaction Calorimeter Market Size, By Application, 2013 � 2020 ($Million)
Table 31 Global Other Calorimeter Market Size, By Application, 2013 � 2020 ($Million)
Table 32 Global Photometer & Calorimeter Market Size for Aerospace Industry, By Geography, 2013 � 2020 ($Million)
Table 33 Global Calorimeter Market Size for Automotive Industry, By Geography, 2013 � 2020 ($Million)
Table 34 Global Calorimeter Market Size for Biomedical Sector, By Geography, 2013 � 2020 ($Million)
Table 35 Global Photometer & Calorimeter Market Size for Process Industry, By Geography, 2013 � 2020 ($Million)
Table 36 Global Calorimeter Market Size for Research, By Geography, 2013 � 2020 ($Million)
Table 37 Global Calorimeter Market Size for Other Application, By Geography, 2013 � 2020 ($Million)
Table 38 Global Photometer Market Size, By Application, 2013 � 2020 ($Million)
Table 39 Global Calorimeter Market Size, By Application, 2013 � 2020 ($Million)
Table 40 Global Photometer Market Size for Aerospace Industry, By Type, 2013 � 2020 ($Million)
Table 41 Global Calorimeter Market Size for Aerospace Industry, By Type, 2013 � 2020 ($Million)
Table 42 Global Photometer Market Size for Automotive Industry, By Type, 2013 � 2020 ($Million)
Table 43 Global Photometer & Calorimeter Market Size for Automotive Industry, By Type, 2013 � 2020 ($Million)
Table 44 Different Photometer Applications in Biomedical Industry
Table 45 Global Photometer & Calorimeter Market Size for Biomedical Sector, By Type, 2013 � 2020 ($Million)
Table 46 Global Calorimeter Market Size for Biomedical Sector, By Type, 2013 � 2020 ($Million)
Table 47 Global Photometer Market Size, for Process Industry, By Type, 2013 � 2020 ($Million)
Table 48 Global Calorimeter Market Size for Process Industry, By Type, 2013 � 2020 ($Million)
Table 49 Photometer Water & Waste Water Applications
Table 50 Photometer Chemical & Petrochemical Applications
Table 51 Calorimeter Chemical & Petrochemical Applications
Table 52 Photometer Food & Beverages Applications
Table 53 Calorimeter Food & Beverages Applications
Table 54 Global Photometer Market Size, for Process Industry, By Application, 2013 � 2020 ($Million)
Table 55 Global Calorimeter Market Size, for Process Industry, By Application, 2013 � 2020 ($Million)
Table 56 Photometer Research Applications
Table 57 Calorimeter Research Applications
Table 58 Global Photometer Market Size for Research, By Type, 2013 � 2020 ($Million)
Table 59 Global Calorimeter Market Size for Research, By Type, 2013 � 2020 ($Million)
Table 60 Photometer Applications in Other Industry
Table 61 Global Photometer Market Size, for Other Application, By Type, 2013 � 2020 ($Million)
Table 62 Global Calorimeter Market Size, for Other Application, By Type, 2013 � 2020 ($Million)
Table 63 Global Photometer Market Size, By Geography, 2013 � 2020 ($Million)
Table 64 Global Calorimeter Market Size, By Geography, 2013 � 2020 ($Million)
Table 65 Americas Photometer Market Size, By Regions, 2013 � 2020 ($Million)
Table 66 The Americas Calorimeter Market Size, By Regions, 2013 � 2020 ($Million)
Table 67 North America Photometer Market Size, By Regions, 2013 � 2020 ($Million)
Table 68 North America Calorimeter Market Size, By Regions, 2013 � 2020 ($Million)
Table 69 North America Photometer Market Size, By Application, 2013 � 2020 ($Million)
Table 70 North America Calorimeter Meter Market Size, By Application, 2013 � 2020 ($Million)
Table 71 U.S. Photometer Market Size, By Application, 2013 � 2020 ($Million)
Table 72 U.S. Calorimeter Market Size, By Application, 2013 � 2020 ($Million)
Table 73 Canada Photometer Market Size, By Application, 2013 � 2020 ($Million)
Table 74 Canada Calorimeter Market Size, By Application, 2013 � 2020 ($Million)
Table 75 Mexico Photometer Market Size, By Application, 2013 � 2020 ($Million)
Table 76 Mexico Calorimeter Market Size, By Application, 2013 � 2020 ($Million)
Table 77 South America Photometer Market Size, By Regions, 2013 � 2020 ($Million)
Table 78 South America Calorimeter Market Size, By Regions, 2013 � 2020 ($Million)
Table 79 Europe Photometer Market Size, By Application, 2013 � 2020 ($Million)
Table 80 Europe Calorimeter Market Size, By Application, 2013 � 2020 ($Million)
Table 81 Europe Photometer Market Size, By Country, 2013 � 2020 ($Million)
Table 82 Europe Calorimeter Market Size, By Country, 2013 � 2020 ($Million)
Table 83 Germany Photometer Market Size, By Application, 2013 � 2020 ($Million)
Table 84 Germany Calorimeter Market Size, By Application, 2013 � 2020 ($Million)
Table 85 France Photometer Market Size, By Application, 2013 � 2020 ($Million)
Table 86 France Calorimeter Market Size, By Application, 2013 � 2020 ($Million)
Table 87 Spain Photometer Market Size, By Application, 2013 � 2020 ($Million)
Table 88 Spain Calorimeter Market Size, By Application, 2013 � 2020 ($Million)
Table 89 U.K. Photometer Market Size, By Application, 2013 � 2020 ($Million)
Table 90 U.K. Calorimeter Market Size, By Application, 2013 � 2020 ($Million)
Table 91 Other Photometer Market Size, By Application, 2013 � 2020 ($Million)
Table 92 Others Calorimeter Market Size, By Application, 2013 � 2020 ($Million)
Table 93 APAC Photometer Market Size, By Application, 2013 � 2020 ($Million)
Table 94 APAC Calorimeter Market Size, By Application, 2013 � 2020 ($Million)
Table 95 APAC Photometer Market Size, By Country, 2013 � 2020 ($Million)
Table 96 APAC Calorimeter Market Size, By Country, 2013 � 2020 ($Million)
Table 97 China Photometer Market Size, By Application, 2013 � 2020 ($Million)
Table 98 China Calorimeter Market Size, By Application, 2013 � 2020 ($Million)
Table 99 India Photometer Market Size, By Application, 2013 � 2020 ($Million)
Table 100 India Calorimeter Market Size, By Application, 2013 � 2020 ($Million)
Table 101 Japan Photometer Market Size, By Application, 2013 � 2020 ($Million)
Table 102 Japan Calorimeter Market Size, By Application, 2013 � 2020 ($Million)
Table 103 South Korea Photometer Market Size, By Application, 2013 � 2020 ($Million)
Table 104 South Korea Calorimeter Market Size, By Application, 2013 � 2020 ($Million)
Table 105 Others Photometer Market Size, By Application, 2013 � 2020 ($Million)
Table 106 Others Calorimeter Market Size, By Application, 2013 � 2020 ($Million)
Table 107 ROW Photometer Market Size, By Application, 2013 � 2020 ($Million)
Table 108 ROW Calorimeter Market Size, By Application, 2013 � 2020 ($Million)
Table 109 ROW Photometer Market Size, By Country, 2013 � 2020 ($Million)
Table 110 ROW Calorimeter Market Size, By Country, 2013 � 2020 ($Million)
Table 111 Israel Photometer Market Size, By Application, 2013 � 2020 ($Million)
Table 112 Israel Calorimeter Market Size, By Application, 2013 � 2020 ($Million)
Table 113 The Middle East Photometer Market Size, By Application, 2013 � 2020 ($Million)
Table 114 The Middle East Calorimeter Market Size, By Application, 2013 � 2020 ($Million)
Table 115 New Product Launches, 2011-2014
Table 116 Agreements, Partnerships, Collaborations, and Joint Ventures, 2009-2014
Table 117 Mergers and Acquisitions, 2011-2014
Table 118 Expansions, 2012-2014
Table 119 Other Developments, 2011-2014
Table 120 Gooch & Housego PLC.: Product Portfolio
Table 121 Hanna Instruments Inc.:P roduct Portfolio
Table 122 Konica Minolta Inc: Product Portfolio
Table 123 Mettler -Toledo International Inc: Product and Services
Table 124 PARR Instrument Company: Product Portfolio
Table 125 Setaram Instrumentation: Product Portfolio
Table 126 SWAN Analytical Instruments: Product Portfolio
Table 127 TA Instruments Inc: Product Portfolio
Table 128 Yokogawa Electric Corporation: Product Portfolio
List of Figures (69 Figures)
Figure 1 Photometer & Calorimeter Market-Segmentation
Figure 2 Photometer & Calorimeter Market: Research Methodology
Figure 3 CAGR (%) of the Photometer & Calorimeter Market, By Region
Figure 4 Market Size Estimation Methodology: Bottom-Up Approach
Figure 5 Market Size Estimation Methodology: Top-Down Approach
Figure 6 Breakdown of Primary Interviews: By Company Type, Designation, and Region
Figure 7 Photometer Market Snapshot (2013-2020): the Biomedical Sector is Expected to Grow at A Higher Rate in the Next Six Years
Figure 8 Global Photometer Application Canvas, 2013: Process Industry and Research Sectors Are Expected to Fuel the Market Growth
Figure 9 Calorimeter Market Snapshot (2013-2020): the Process Industry Accounted for the Major Market Share in 2013
Figure 10 Attractive Market Opportunities in the Photometer Market
Figure 11 Differential Scanning Calorimeter is Expected to Grow at A High Rate
Figure 12 The Flame Photometer Market is Expected to Grow at A High Rate
Figure 13 The Differential Scanning Calorimeter Market is Expected to Grow at A High Rate
Figure 14 China Accounted for the Largest Market Share in the APAC Photometer Market
Figure 15 The Americas Accounted for 43% Market Share of the Overall Photometer Market in 2013
Figure 16 The Americas Holds Maximum Share in the Calorimeter Market
Figure 17 China and South Korea Are Expected to Witness Fastest Growth in the Coming Future
Figure 18 Photometer & Calorimeter Market in Emerging Economies of the APAC Region
Figure 19 APAC Market is Expected to Witness High Growth in Coming Future
Figure 20 History and Evolution of Photometer
Figure 21 History and Evolution of Calorimeter
Figure 22 Photometer & Calorimeter Market Segmentation
Figure 23 Drivers, Restraints, Opportunities, and Challenges for the Photometer & Calorimeter Market
Figure 24 Value Chain Analysis
Figure 25 Supply Chain of Major Players in Photometer & Calorimeter Market
Figure 26 Key Industry Trends in the Photometer & Calorimeter Market
Figure 27 Porter�s Five forces Analysis
Figure 28 Threat of New Entrants
Figure 29 Threat From Substitutes
Figure 30 Bargaining Power of Buyers
Figure 31 Bargaining Power of Suppliers
Figure 32 Intensity of Rivalry
Figure 33 Strategic Benchmarking: Inorganic Growth Strategies for Technology Integration and Product Enhancement
Figure 34 Multiwave Fiber Optic Photometer Measuring and Monitoring Applications
Figure 35 Multiwave Infrared Photometer Applications
Figure 36 Multiwave Ultrviolet Photometer Applications
Figure 37 Components of Flame Photometer
Figure 38 Advantages and Disadvantges of Flame Photometer
Figure 39 Different Applications of Poratble Photometer
Figure 40 Different Types of Calorimeters
Figure 41 Photometer & Calorimeter Applications
Figure 42 Geographic Snapshot of Photometer & Calorimeter Market (2013)
Figure 43 The North America Photometer & Calorimeter Market Snapshot
Figure 44 U.S. Photometer & Calorimeter Market Snapshot
Figure 45 Canada Photometer & Calorimeter Market Snapshot
Figure 46 Mexico Photometer & Calorimeter Market Snapshot
Figure 47 Germany is the Major Market Share for Photometer & Calorimeter Market
Figure 48 The Asia-Pacific Photometer & Calorimeter Market Snapshot � China is the Most Lucrative Market
Figure 49 Biomedical and Processing Industries Are Expected to Have High Grwoth in ROW Region
Figure 50 Companies Adopted Product Innovation as the Key Growth Strategy Over the Last Three Years
Figure 51 Gooch & Housego PLC in Photometer Market to Grow at A High Rate Between 2011 - 2013
Figure 52 Global Photometer Market Share, By Key Player, 2013
Figure 53 Global Calorimetr Market Share, By Key Player, 2013
Figure 54 Market Evolution Framework-Significant New Product Development Has Fueled Growth and Innovation in 2012 and 2013
Figure 55 Battle for Market Share: New Product Launches Was the Key Strategy
Figure 56 Geographic Analysis of the top Companies
Figure 57 Gooch and Housego PLC Will Emerge as A Dark Horse
Figure 58 ABB Ltd.: Business Overview
Figure 59 ABB Ltd.: Product Portfolio
Figure 60 ABB Ltd.: SWOT Analysis
Figure 61 Gooch & Housego PLC.: Business Overview
Figure 62 Gooch & Housego PLC.: SWOT Analysis
Figure 63 Konica Minolta Inc.: Business Overview
Figure 64 Konica Minolta Inc.: SWOT Analysis
Figure 65 Mettler-Toledo International Inc. : Business Overview
Figure 66 Mettler-Toledo International Inc.: SWOT Analysis
Figure 67 Yokogawa Electric Corporation: Business Overview
Figure 68 Yokogawa Electric Corporation: Product Portfolio
Figure 69 Yokogawa Electric Corporation: SWOT Analysis


Growth opportunities and latent adjacency in Photometer & Calorimeter Market