Plasma Therapy Market by Type (Pure PRP, Leukocyte-Rich PRP, Pure Platelet-Rich Fibrin, Leukocyte-Rich Fibrin), Source (Autologous, Allogenic), Application (Orthopedic, Dermatology, Cardiac Muscle Injury), End User, Region - Global Forecast to 2021


The global plasma therapy market is expected to grow from USD 135.6 Million in 2016 to USD 297.6 Million by 2021, at a CAGR of 14.0% from 2016 to 2021. The global market is segmented on the basis of type, source, application, end user, and region.
On the basis of type, the plasma therapy market is segmented into pure PRP, leucocyte-rich PRP, platelet-rich fibrin (PRF), and leukocyte-rich fibrin (L-PRF). The pure PRP segment is estimated to account for the largest share of the global market in 2016. One of the most significant factors driving the growth of this market includes the effective results of pure PRP therapy. However, lack of reimbursement policies and varying prices of plasma therapy are hindering the growth of the market.
On the basis of source, the market is segmented into autologous and allogenic. The autologous segment is estimated to account for the largest share of the global market in 2016. Awareness of plasma therapy and its acceptance as a suitable remedy for healing of bones and other tissues are driving the growth of the autologous source segment of the market.
Based on application, the plasma therapy market is segmented into orthopedics, dermatology, dental, cardiac muscle injury, nerve injury, and others. The orthopedic segment is further segmented into arthritis, chronic tendinitis, and bone repair & regeneration. Similarly, the dermatology segment is further segmented into androgenic alopecia and plastic surgery. The dermatology segment is expected to grow at the highest CAGR from 2016 to 2021, owing to the increasing number of dermatological disorders.
On the basis of end user, the market is classified into hospitals & clinics and research institutions. The hospitals & clinics segment is estimated to account for the largest share of the global market in 2016. This large share is mainly attributed to rise in healthcare expenditure and increase in the use of PRP products in hospitals.
Geographically, the market is led by North America, followed by Europe, Asia-Pacific, and rest of the world (RoW). Growth in the global market is primarily driven by the increase in aging population and rise in the number of orthopedic disorders.
Major players in the plasma therapy market include BioLife Plasma Services (U.S.), Cambryn Biologics LLC (U.S.), Biotest (Germany), CSL Ltd. (Australia), Grifols International S.A. (Spain), Kedrion S.p.A. (Italy), LFB (France), Bio Products Laboratory Ltd. (U.K.), China Biologic Products, Inc. (China), and Octapharma (Switzerland).
Target Audience for this Report:
- Platelet-rich Plasma (PRP) Manufacturers and Suppliers
- Academic Research Institutes
- Hospitals & Clinics
- Research & Development (R&D) Companies
- Business Research & Consulting Service Providers
- Medical Research Laboratories
- Academic Medical Centers & Universities
Value Addition for the Buyer:
This report aims to provide insights into the global plasma therapy market. It provides valuable information on plasma types, sources, applications, and end users in the market. Furthermore, it also provides a regional analysis of the market. Leading players are profiled in the report to study their product offerings and understand the strategies undertaken by them to sustain their competitive position in this market.
The above mentioned information would benefit buyers by helping them understand the market dynamics. In addition to this, it will also enable firms to understand the trends in this market and better position themselves to capitalize growth opportunities.
To know about the assumptions considered for the study, download the pdf brochure
Scope of the Report:
This report categorizes the plasma therapy market into the following segments:
By Type
- Pure PRP
- Leucocyte-rich PRP
- Pure Platelet-rich Fibrin (PRF)
- Leukocyte-rich Fibrin (L-PRF)
By Source
- Autologous
- Allogenic
By Application
-
Orthopedics
- Arthritis
- Chronic Tendinitis
- Bone Repair & Regeneration
-
Dermatology
- Androgenic Alopecia
- Plastic Surgery
- Dental
- Cardiac Muscle Injury
- Nerve Injury
- Others
By End User
- Hospitals & Clinics
- Research Institutions
By Region
-
North America
- U.S.
- Canada
-
Europe
- Germany
- France
- Italy
- U.K.
- Spain
- RoE
-
Asia-Pacific
- India
- China
- Japan
- RoA
- Rest of the World (RoW)
Customization Options:
- Company Information: Detailed company profiles of five or more market players
- Opportunities Assessment: A detailed report underlining various growth opportunities presented in the market
The global plasma therapy market comprises various types of platelet-rich plasma that are used by hospitals & clinics and several research institutions. Rise in the number of orthopedic disorders associated with trauma and aging led to the increased demand for minimally-invasive therapies. This has further contributed to the increased demand for PRP in orthopedic, dermatology, nerve injury, cardiac muscle injury, and dental applications.
This market is driven by several factors such as prevalence of orthopedic disorders such as arthritis and increase in healthcare expenditure. On the other hand, stringent regulatory policies and lack of awareness about platelet-rich therapy are factors restraining the growth of the expected to grow from USD 135.6 Million in 2016 to USD 297.6 Million by 2021, at a CAGR of 14.0% during the forecast period.
On the basis of type, the plasma therapy market is segmented into pure PRP, leucocyte-rich PRP, pure platelet-rich fibrin (PRF), and leukocyte-rich fibrin (L-PRF). The pure PRP segment is estimated to account for the largest share of the global market in 2016. Whereas, the leucocyte-rich PRP segment of the market is expected to grow at the highest CAGR from 2016 to 2021.
Based on source, the plasma therapy market is segmented into autologous and allogenic. The autologous segment is estimated to account for the largest share of the global market in 2016. Prevalence of orthopedic disorders such as arthritis and tendinitis has propelled the demand for advanced treatment options and development of minimally-invasive therapies. This in turn has contributed to the growth of the market.
Based on application, the market is segmented into dermatology, cardiac muscle injury, dental, nerve injury, and others. The orthopedic segment is further segmented into arthritis, chronic tendinitis, and bone repair & regeneration. Similarly, the dermatology segment is further segmented into androgenic alopecia and plastic surgery. The dermatology application segment is expected to grow at the highest CAGR from 2016 to 2021, owing to increase in the number of cosmetic procedures.
Based on end user, the plasma therapy market is segmented into hospitals & clinics and research institutions. The hospitals & clinics segment is estimated to account for the largest share of the global market in 2016. Rise in healthcare spending has resulted in the increasing use of PRP in hospitals & clinics.
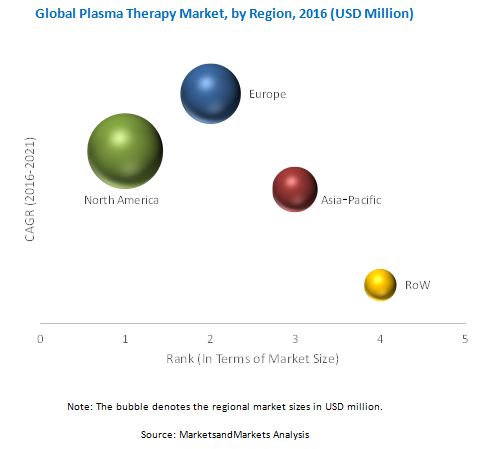
North America led the global market, followed by Europe, Asia-Pacific, and rest of the world (RoW). Major players operating in Plasma Therapy Market include BioLife Plasma Services (U.S.), Cambryn Biologics LLC (U.S.), Biotest (Germany), CSL Ltd. (Australia), Grifols International S.A. (Spain), Kedrion S.p.A. (Italy), LFB (France), Bio Products Laboratory Ltd. (U.K.), China Biologic Products, Inc. (China), and Octapharma (Switzerland).
To speak to our analyst for a discussion on the above findings, click Speak to Analyst
 Exclusive indicates content/data unique to MarketsandMarkets and not available with any competitors.
Table of Contents
1 Introduction (Page No. - 19)
1.1 Objectives of the Study
1.2 Market Definition
1.3 Market Scope
1.3.1 Markets Covered
1.3.2 Years Considered for the Study
1.4 Currency
1.5 Limitations
1.6 Stakeholders
2 Research Methodology (Page No. - 22)
2.1 Research Data
2.1.1 Key Data From Secondary Sources
2.1.2 Key Data From Primary Sources
2.1.2.1 Breakdown of Primary Interview
2.2 Market Size Estimation
2.3 Market Breakdown and Data Triangulation
2.4 Research Assumptions
3 Executive Summary (Page No. - 28)
4 Premium Insights (Page No. - 32)
4.1 Attractive Opportunities in the Global Plasma Therapy Market
4.2 Current Trends in the Plasma Therapy Market
5 Market Overview (Page No. - 36)
5.1 Introduction
5.2 Market Segmentation
5.2.1 Market, By Type
5.2.2 Market, By Source
5.2.3 Market, By Application
5.2.4 Market, By End User
5.3 Market Dynamics
5.3.1 Market Drivers
5.3.1.1 Rising Incidences of Sports Injuries
5.3.1.2 Increase in the Number of Androgenic Alopecia Patients Worldwide
5.3.1.3 Growing Use of Platelet-Rich Plasma in Various Therapeutic Areas
5.3.1.4 Prevalence of Arthritis
5.3.2 Market Restraints
5.3.2.1 Lack of Reimbursement Policies
5.3.2.2 Varying Prices of Plasma Therapy
5.3.3 Market Opportunities
5.3.3.1 Increase in the Number of Patients Suffering From Orthopedic Disorders and Androgenic Alopecia
5.3.4 Market Challenges
5.3.4.1 Restricted Use of PRP in Patients Suffering From Diabetes and Kidney Ailments
5.3.4.2 Developments in Other Fields of Regenerative Medicine
6 Plasma Therapy Market, By Type (Page No. - 45)
6.1 Introduction
6.2 Pure PRP
6.3 Leukocyte-Rich PRP
6.4 Pure Platelet-Rich Fibrin
6.5 Leukocyte-Rich Fibrin
7 Plasma Therapy Market, By Source (Page No. - 53)
7.1 Introduction
7.1.1 Autologous
7.1.2 Allogenic
8 Plasma Therapy Market, By Application (Page No. - 58)
8.1 Introduction
8.2 Orthopedic
8.2.1 Arthritis
8.2.2 Chronic Tendinitis
8.2.3 Bone Repair & Regeneration
8.3 Dermatology
8.3.1 Androgenic Alopecia
8.3.2 Plastic Surgery
8.4 Cardiac Muscle Injury
8.5 Dental
8.6 Nerve Injury
8.7 Others
9 Plasma Therapy Market, By End User (Page No. - 74)
9.1 Introduction
9.2 Hospitals & Clinics
9.3 Research Institutes
10 Plasma Therapy Market, By Geography (Page No. - 80)
10.1 Introduction
10.2 North America
10.2.1 Competition in North America Plasma Therapy Market
10.2.2 Near-Term, Mid-Term, and Long-Term Growth of the Plasma Therapy Market in U.S. and Canada
10.2.3 North America Market, By Type
10.2.4 North America Market, By Source
10.2.5 North America Market, By Application
10.2.6 North America Market, By End User
10.2.7 U.S.
10.2.7.1 U.S. Market Overview
10.2.7.2 U.S. Market, By Type
10.2.7.3 U.S. Market, By Source
10.2.7.4 U.S. Market, By Application
10.2.7.5 U.S. Market, By End User
10.2.8 Canada
10.2.8.1 Canada Market Overview
10.2.8.2 Canada Market, By Type
10.2.8.3 Canada Market, By Source
10.2.8.4 Canada Market, By Application
10.2.8.5 Canada Market, By End User
10.3 Europe
10.3.1 Introduction
10.3.1.1 Competition in the Europe Market
10.3.1.2 Near-Term, Mid-Term, and Long-Term Growth of the Market in Europe
10.3.1.3 Europe Market, By Type
10.3.1.4 Europe Market, By Source
10.3.1.5 Europe Market, By Application
10.3.1.6 Europe Market, By End User
10.3.1.7 Europe Market, By Country
10.3.2 Germany
10.3.2.1 Germany Market Overview
10.3.2.2 Germany Market, By Type
10.3.2.3 Germany Market, By Source
10.3.2.4 Germany Market, By Application
10.3.2.5 Germany Market, By End User
10.3.3 U.K.
10.3.3.1 U.K. Market Overview
10.3.3.2 U.K. Market, By Type
10.3.3.3 U.K. Market, By Source
10.3.3.4 U.K. Market, By Application
10.3.3.5 U.K. Market, By End User
10.3.4 France
10.3.4.1 France Market Overview
10.3.4.2 France Market, By Type
10.3.4.3 France Market, By Source
10.3.4.4 France Market, By Application
10.3.4.5 France Market, By End User
10.3.5 Spain
10.3.5.1 Spain Market Overview
10.3.5.2 Spain Market, By Type
10.3.5.3 Spain Market, By Source
10.3.5.4 Spain Market, By Application
10.3.5.5 Spain Market, By End User
10.3.6 Italy
10.3.6.1 Italy Market Overview
10.3.6.2 Italy Market, By Type
10.3.6.3 Italy Market, By Source
10.3.6.4 Italy Market, By Application
10.3.6.5 Italy Market, By End User
10.3.7 Rest of Europe (Roe)
10.3.7.1 Rest of Europe Market Overview
10.3.7.2 Rest of Europe Market, By Type
10.3.7.3 Rest of Europe Market, By Source
10.3.7.4 Rest of Europe Market, By Application
10.3.7.5 Rest of Europe Market, By End User
10.4 Asia-Pacific
10.4.1 Introduction
10.4.1.1 Competition in Asia-Pacific Plasma Therapy Market
10.4.1.2 Near Term, Mid Term, and Long Term Growth of Market in APAC
10.4.2 Asia-Pacific Market, By Type
10.4.3 Asia-Pacific Market, By Source
10.4.4 Asia-Pacific Market, By Application
10.4.5 Asia-Pacific Market, By End User
10.4.6 Asia-Pacific Market, By Country
10.4.7 Japan
10.4.7.1 Overview
10.4.7.2 Japan Market, By Type
10.4.7.3 Japan Market, By Source
10.4.7.4 Japan Market, By Application
10.4.7.5 Japan Market, By End User
10.4.8 China
10.4.8.1 Overview
10.4.8.2 China Market, By Type
10.4.8.3 China Market, By Source
10.4.8.4 China Market, By Application
10.4.8.5 China Market, By End User
10.4.9 Australia
10.4.9.1 Overview
10.4.9.2 Australia Market, By Type
10.4.9.3 Australia Market, By Source
10.4.9.4 Australia Market, By Application
10.4.9.5 Australia Market, By End User
10.4.10 India
10.4.10.1 Overview
10.4.10.2 India Market, By Type
10.4.10.3 India Market, By Source
10.4.10.4 India Market, By Application
10.4.10.5 India Market, By End User
10.4.11 Republic of Korea
10.4.11.1 Overview
10.4.11.2 Republic of Korea Market, By Type
10.4.11.3 Republic of Korea Market, By Source
10.4.11.4 Republic of Korea Market, By Application
10.4.11.5 Republic of Korea Market, By End User
10.4.12 Rest of Asia-Pacific
10.4.12.1 Overview
10.4.12.2 Rest of Asia-Pacific Market, By Type
10.4.12.3 Rest of Asia-Pacific Market, By Source
10.4.12.4 Rest of Asia-Pacific Market, By Application
10.4.12.5 Rest of Asia-Pacific Market, By End User
10.5 Rest of the World (RoW)
10.5.1 RoW Market, By Type
10.5.2 RoW Market, By Source
10.5.3 RoW Market, By Application
10.5.4 RoW Market, By End User
11 Competitive Landscape (Page No. - 166)
11.1 Overview
11.2 Market Share Analysis
11.3 Competitive Situation and Trends
11.3.1 Regulatory Approvals
11.3.2 Expansions
11.3.3 Agreements
11.3.4 New Product Launches
11.3.5 Acquisitions
12 Company Profile (Page No. - 174)
(Overview, Financial*, Products & Services, Strategy, and Developments)
12.1 Biolife Plasma Services
12.2 Cambryn Biologics LLC
12.3 Biotest
12.4 CSL Ltd.
12.5 Grifols International S.A.
12.6 Kedrion S.P.A.
12.7 LFB SA
12.8 Bio Product Laboratory Ltd. (BPL)
12.9 China Biologic Products, Inc.
12.10 Octapharma
*Details Might Not Be Captured in Case of Unlisted Companies.
13 Appendix (Page No. - 202)
13.1 Insights From Industry Experts
13.2 Discussion Guide
13.3 Introducing RT: Real-Time Market Intelligence
13.4 Knowledge Store: Marketsandmarkets’ Subscription Portal
13.5 Available Customizations
13.6 Related Reports
List of Tables (141 Tables)
Table 1 Indications for Therapeutic Use of Plasma - First Line Therapy
Table 2 Indications for Therapeutic Use of Plasma - Second Line Therapy
Table 3 Plasma Therapy Market By Type, 2014–2021 (USD Million)
Table 4 Pure PRP Market, By Region, 2014–2021 (USD Million)
Table 5 Leukocyte-Rich PRP Market, By Region, 2014–2021 (USD Million)
Table 6 Pure Platelet-Rich Fibrin Market, By Region, 2014–2021 (USD Million)
Table 7 Leukocyte-Rich Fibrin Market, By Region, 2014–2021 (USD Million)
Table 8 Market for Plasma Therapy, By Source, 2014–2021 (USD Million)
Table 9 Autologous Source Market for Plasma Therapy, By Region, 2014–2021 (USD Million)
Table 10 Allogenic Source Market for Plasma Therapy, By Region, 2014–2021 (USD Million)
Table 11 Plasma Therapy Market, By Application, 2014–2021 (USD Million)
Table 12 Plasma Therapy Market for Orthopedic, By Application, 2014–2021 (USD Million)
Table 13 Plasma Therapy Market for Orthopedic Application, By Region, 2014–2021 (USD Million)
Table 14 Plasma Therapy Market for Arthritis Application, By Region, 2014–2021 (USD Million)
Table 15 Plasma Therapy Market for Chronic Tendinitis Application, By Region, 2014–2021 (USD Million)
Table 16 Plasma Therapy Market for Bone Repair & Regeneration Application, By Region, 2014–2021 (USD Million)
Table 17 Plasma Therapy Market for Dermatology Application, By Region, 2014–2021 (USD Million)
Table 18 Plasma Therapy Market for Androgenic Alopecia Application, By Region, 2014–2021 (USD Million)
Table 19 Plasma Therapy Market for Plastic Surgery Application, By Region, 2014–2021 (USD Million)
Table 20 Plasma Therapy Market for Cardiac Muscle Injury Application, By Region, 2014–2021 (USD Million)
Table 21 Plasma Therapy Market for Dental Application, By Region, 2014–2021 (USD Million)
Table 22 Plasma Therapy Market for Nerve Injury Application, By Region, 2014–2021 (USD Million)
Table 23 Plasma Therapy Market, By End User, 2014–2021 (USD Million)
Table 24 Plasma Therapy Market for Hospitals & Clinics, By Region, 2014–2021 (USD Million)
Table 25 Plasma Therapy Market for Research Institutes, By Region, 2014–2021 (USD Million)
Table 26 North America Market for Plasma Therapy, By Type, 2014–2021 (USD Million)
Table 27 North America Market, By Source, 2014–2021 (USD Million)
Table 28 North America Market for Plasma Therapy, By Application, 2014–2021 (USD Million)
Table 29 North America Market in Orthopedic, By Type, 2014–2021 (USD Million)
Table 30 North America Market in Dermatology, By Type, 2014–2021 (USD Million)
Table 31 North America Market, By End User, 2014–2021 (USD Million)
Table 32 North America Market, By Country, 2014–2021 (USD Million)
Table 33 U.S. Market, By Type, 2014–2021 (USD Million)
Table 34 U.S. Market, By Source, 2014–2021 (USD Million)
Table 35 U.S. Market, By Application, 2014–2021 (USD Million)
Table 36 U.S. Market in Orthopedic, By Type, 2014–2021 (USD Million)
Table 37 U.S. Market in Dermatology, By Type, 2014–2021 (USD Million)
Table 38 U.S. Market, By End User, 2014–2021 (USD Million)
Table 39 Canada Market, By Type, 2014–2021 (USD Million)
Table 40 Canada Market, By Source, 2014–2021 (USD Million)
Table 41 Canada Market, By Application, 2014–2021 (USD Million)
Table 42 Canada Market in Orthopedic, By Type, 2014–2021 (USD Million)
Table 43 Canada Market in Dermatology, By Type, 2014–2021 (USD Million)
Table 44 Canada Market, By End User, 2014–2021 (USD Million)
Table 45 Europe Market, By Type, 2014–2021 (USD Million)
Table 46 Europe Market, By Source, 2014–2021 (USD Million)
Table 47 Europe Market, By Application, 2014–2021 (USD Million)
Table 48 Europe Market in Orthopedic, By Type, 2014–2021 (USD Million)
Table 49 Europe Market in Dermatology, By Type, 2014–2021 (USD Million)
Table 50 Europe Market, By End User, 2014–2021 (USD Million)
Table 51 Europe Market, By Country, 2014–2021 (USD Million)
Table 52 Germany Market, By Type, 2014–2021 (USD Million)
Table 53 Germany Market, By Source, 2014–2021 (USD Million)
Table 54 Germany Market, By Application, 2014–2021 (USD Million)
Table 55 Germany Market in Orthopedic, By Type, 2014–2021 (USD Million)
Table 56 Germany Market in Dermatology, By Type, 2014–2021 (USD Million)
Table 57 Germany Market, By End User, 2014–2021 (USD Million)
Table 58 U.K. Market, By Type, 2014–2021 (USD Million)
Table 59 U.K. Market, By Source, 2014–2021 (USD Million)
Table 60 U.K. Market, By Application, 2014–2021 (USD Million)
Table 61 U.K. Market in Orthopedic, By Type, 2014–2021 (USD Million)
Table 62 U.K. Market in Dermatology, By Type, 2014–2021 (USD Million)
Table 63 U.K. Market, By End User, 2014–2021 (USD Million)
Table 64 France Market, By Type, 2014–2021 (USD Million)
Table 65 France Market, By Source, 2014–2021 (USD Million)
Table 66 France Market, By Application, 2014–2021 (USD Million)
Table 67 France Market in Orthopedic, By Type, 2014–2021 (USD Million)
Table 68 France Market in Dermatology, By Type, 2014–2021 (USD Million)
Table 69 France Market, By End User, 2014–2021 (USD Million)
Table 70 Spain Market, By Type, 2014–2021 (USD Million)
Table 71 Spain Market, By Source, 2014–2021 (USD Million)
Table 72 Spain Market, By Application, 2014–2021 (USD Million)
Table 73 Spain Market in Orthopedic, By Type, 2014–2021 (USD Million)
Table 74 Spain Market in Dermatology, By Type, 2014–2021 (USD Million)
Table 75 Spain Market, By End User, 2014–2021 (USD Million)
Table 76 Italy Market, By Type, 2014–2021 (USD Million)
Table 77 Italy Market, By Source, 2014–2021 (USD Million)
Table 78 Italy Market, By Application, 2014–2021 (USD Million)
Table 79 Italy Market in Orthopedic, By Type, 2014–2021 (USD Million)
Table 80 Italy Market in Dermatology, By Type, 2014–2021 (USD Million)
Table 81 Italy Market, By End User, 2014–2021 (USD Million)
Table 82 Rest of Europe Market, By Type, 2014–2021 (USD Million)
Table 83 Rest of Europe Market, By Source, 2014–2021 (USD Million)
Table 84 Rest of Europe Market, By Application, 2014–2021 (USD Million)
Table 85 Rest of Europe Market in Orthopedic, By Type, 2014–2021 (USD Million)
Table 86 Rest of Europe Market in Dermatology, By Type, 2014–2021 (USD Million)
Table 87 Rest of Europe Market, By End User, 2014–2021 (USD Million)
Table 88 Asia-Pacific Market, By Type, 2014-2021 (USD Million)
Table 89 Asia-Pacific Market, By Source, 2014-2021 (USD Million)
Table 90 Asia-Pacific Market, By Application, 2014-2021 (USD Million)
Table 91 Asia-Pacific Market in Orthopedic, By Type, 2014-2021 (USD Million)
Table 92 Asia-Pacific Market in Dermatology, By Type, 2014-2021 (USD Million)
Table 93 Asia-Pacific Market, By End User, 2014-2021 (USD Million)
Table 94 Asia-Pacific Market, By Country, 2014-2021 (USD Million)
Table 95 Japan Market, By Type, 2014-2021 (USD Million)
Table 96 Japan: Market, By Source, 2014-2021 (USD Million)
Table 97 Japan Market, By Application, 2014-2021 (USD Million)
Table 98 Japan Market in Orthopedic, By Type, 2014-2021 (USD Million)
Table 99 Japan Market in Dermatology, By Type, 2014-2021 (USD Million)
Table 100 Japan Market, By End User, 2014-2021 (USD Million)
Table 101 China Market, By Type, 2014-2021 (USD Million)
Table 102 China Market, By Source, 2014-2021 (USD Million)
Table 103 China Market, By Application, 2014-2021 (USD Million)
Table 104 China Market in Orthopedic, By Type, 2014-2021 (USD Million)
Table 105 China Market in Dermatology, By Type, 2014-2021 (USD Million)
Table 106 China Market, By End User, 2014-2021 (USD Million)
Table 107 Australia Market, By Type, 2014–2021 (USD Million)
Table 108 Australia Market, By Source, 2014–2021 (USD Million)
Table 109 Australia Market, By Application, 2014–2021 (USD Million)
Table 110 Australia Market in Orthopedic, By Type, 2014–2021 (USD Million)
Table 111 Australia Market in Dermatology, By Type, 2014–2021 (USD Million)
Table 112 Australia Market, By End User, 2014–2021 (USD Million)
Table 113 India Market, By Type, 2014–2021 (USD Million)
Table 114 India Market, By Source, 2014–2021 (USD Million)
Table 115 India Market, By Application, 2014–2021 (USD Million)
Table 116 India Market in Orthopedic, By Type, 2014–2021 (USD Million)
Table 117 India Market in Dermatology, By Type, 2014–2021 (USD Million)
Table 118 India Market, By End User, 2014–2021 (USD Million)
Table 119 Republic of Korea Market, By Type, 2014–2021 (USD Million)
Table 120 Republic of Korea Market, By Source, 2014–2021 (USD Million)
Table 121 Republic of Korea Market, By Application, 2014–2021 (USD Million)
Table 122 Republic of Korea Market in Orthopedic, By Type, 2014–2021 (USD Million)
Table 123 Republic of Korea Market in Dermatology, By Type, 2014–2021 (USD Million)
Table 124 Republic of Korea Market, By End User, 2014–2021 (USD Million)
Table 125 Rest of Asia-Pacific Market, By Type, 2014–2021 (USD Million)
Table 126 Rest of Asia-Pacific Market, By Source, 2014–2021 (USD Million)
Table 127 Rest of Asia-Pacific Market, By Application, 2014–2021 (USD Million)
Table 128 Rest of Asia-Pacific Market in Orthopedic, By Type, 2014–2021 (USD Million)
Table 129 Rest of Asia-Pacific Market in Dermatology, 2014–2021 (USD Million)
Table 130 Rest of Asia-Pacific Market, By End User, 2014–2021 (USD Million)
Table 131 RoW Market, By Type, 2014–2021 (USD Million)
Table 132 RoW Market, By Source, 2014–2021 (USD Million)
Table 133 RoW Market, By Application, 2014–2021 (USD Million)
Table 134 RoW Market in Orthopedic, By Type, 2014–2021 (USD Million)
Table 135 RoW Market in Dermartology, By Type, 2014–2021 (USD Million)
Table 136 RoW Market, By End User, 2014–2021 (USD Million)
Table 137 Regulatory Approvals, 2014–2016
Table 138 Expansions, 2013-2016
Table 139 Agreements, 2013-2016
Table 140 New Product Launches, 2013-2014
Table 141 Acquisitions, 2013-2016
List of Figures (98 Figures)
Figure 1 Global Plasma Therapy Market
Figure 2 Research Design
Figure 3 Breakdown of Primary Interviews: By Company Type, Designation, & Region
Figure 4 Bottom-Up Approach
Figure 5 Top-Down Approach
Figure 6 Research Methodology: Data Triangulation
Figure 7 Leukocyte-Rich PRP Projected to Be the Fastest-Growing Segment in the Market
Figure 8 The Autologous Segment Estimated to Dominate the Plasma Therapy Market in 2016
Figure 9 Dermatology Estimated to Be the Fastest-Growing Application of the Plasma Therapy Market
Figure 10 The Hospitals & Clinics Segment Estimated to Account for the Largest Share in 2016
Figure 11 Europe Estimated to Grow at the Highest CAGR in the Plasma Therapy Market
Figure 12 Global Plasma Therapy Market to Witness Moderate Growth During the Forecast Period
Figure 13 The Pure PRP Segment Estimated to Lead the Global Plasma Therapy Market in 2016
Figure 14 The Plasma Therapy Market in Europe to Witness the Highest Growth During the Forecast Period
Figure 15 Increasing Use of PRP Therapy in Sports Injuries to Propel the Growth of the Plasma Therapy Market
Figure 16 Plasma Therapy Market Segmentation, By Type
Figure 17 Leukocyte-Rich PRP to Form the Largest Type Segment in 2016
Figure 18 North America to Dominate the Pure PRP Market in 2016
Figure 19 North America to Command the Largest Share of the Leukocyte-Rich PRP Market in 2016
Figure 20 North America to Command the Largest Share of Pure Platelet-Rich Fibrin Market in 2016
Figure 21 North America to Dominate the Leukocyte-Rich Fibrin Market in 2016
Figure 22 Market Segmentation, By Source
Figure 23 Allogenic Source to Be the Largest Segment in 2016
Figure 24 North America to Lead the Autologous Source Market in 2016
Figure 25 North America to Lead the Allogenic Source Market in 2016
Figure 26 Market Segmentation, By Application
Figure 27 Dermatology Segment to Dominate the Plasma Therapy Applications Market in 2016
Figure 28 Arthritis Treatment to Dominate the Market for Orthopedic in 2016
Figure 29 North America to Command the Largest Share of the Plasma Therapy Market for Orthopedic Application in 2016
Figure 30 North America to Dominate the Plasma Therapy Market for Dermatology Application in 2016
Figure 31 Androgenic Alopecia Application in 2016
Figure 32 Plastic Surgery in 2016
Figure 33 North America to Dominate the Plasma Therapy Market for Cardiac Muscle Injury Application in 2016
Figure 34 North America to Dominate the Plasma Therapy Market for Dental Application in 2016
Figure 35 North America to Dominate the Plasma Therapy Market for Nerve Injury Application in 2016
Figure 36 Plasma Therapy Market Segmentation, By End User
Figure 37 Plasma Therapy Market Size, By End User, 2016 & 2021 (USD Million)
Figure 38 Hospitals & Clinics Overview
Figure 39 North America to Dominate the Plasma Therapy Market for Hospitals & Clinics in 2016
Figure 40 North America to Dominate the Plasma Therapy Market for Research Institutes Between 2016 and 2021
Figure 41 Geographic Snapshot (2016-2021) – the Market in the U.K. Expected to Witness Highest Growth During the Forecast Period
Figure 42 The Leukocyte-Rich PRP Segment has High Growth Potential Across All Regions
Figure 43 North America Plasma Therapy Market Snapshot
Figure 44 North America Plasma Therapy Market, By Type, 2016 (USD Million)
Figure 45 North America Plasma Therapy Market, By Source, 2014-2021 (USD Million)
Figure 46 North America Plasma Therapy Market, By Application, 2016 & 2021 (USD Million)
Figure 47 North America Plasma Therapy Market in Orthopedic, By Type, 2016 & 2021 (USD Million)
Figure 48 North America Plasma Therapy Market in Dermatology, By Type, 2016 & 2021 (USD Million)
Figure 49 North America Plasma Therapy Market, By End-User, 2014-2021 (USD Million)
Figure 50 North America Plasma Therapy Market, By Country, 2016 & 2021 (USD Million)
Figure 51 U.S. Plasma Therapy Market Overview, 2016 & 2021
Figure 52 Canada Plasma Therapy Market Overview
Figure 53 Europe Plasma Therapy Market Snapshot – Germany is the Most Lucrative Market
Figure 54 Europe Plasma Therapy Market, By Type, 2016 (USD Million)
Figure 55 Europe Plasma Therapy Market, By Source, 2014-2021 (USD Million)
Figure 56 Europe Plasma Therapy Market, By Application, 2016 & 2021 (USD Million)
Figure 57 Europe Plasma Therapy Market in Orthopedic, By Type, 2016 & 2021 (USD Million)
Figure 58 Europe Plasma Therapy Market in Dermatology, By Type, 2016 & 2021 (USD Million)
Figure 59 Europe Plasma Therapy Market, By End User, 2014–2021 (USD Million)
Figure 60 Europe Plasma Therapy Market, By Country, 2016 & 2021 (USD Million)
Figure 61 Germany Plasma Therapy Market Overview, 2016 & 2021
Figure 62 U.K. Plasma Therapy Market Overview, 2016 & 2021
Figure 63 France Plasma Therapy Market Overview, 2016 & 2021
Figure 64 Spain Plasma Therapy Market Overview, 2016 & 2021
Figure 65 Italy Plasma Therapy Market Overview, 2016 & 2021
Figure 66 Rest of Europe Plasma Therapy Market Overview, 2016 & 2021
Figure 67 APAC Plasma Therapy Market Snapshot – China is the Most Lucrative Market
Figure 68 APAC Plasma Therapy Market , By Type, 2016 (USD Million)
Figure 69 APAC Plasma Therapy Market, By Source, 2014-2021 (USD Million)
Figure 70 APAC Plasma Therapy Market , By Application, 2016 & 2021 (USD Million)
Figure 71 APAC Plasma Therapy Market in Orthopedic, By Type, 2016 & 2021 (USD Million)
Figure 72 APAC Plasma Therapy Market in Dermatology, By Type, 2016 & 2021 (USD Million)
Figure 73 APAC Plasma Therapy Market , By End User, 2014-2021 (USD Million)
Figure 74 APAC Plasma Therapy Market , By Country, 2016 & 2021 (USD Million)
Figure 75 Japan Plasma Therapy Market Overview,2016 & 2021
Figure 76 China Plasma Therapy Market Overview,2016 & 2021
Figure 77 Australia Plasma Therapy Market Overview,2016 & 2021
Figure 78 India Plasma Therapy Market Overview,2016 & 2021
Figure 79 Republic of Korea Plasma Therapy Market Overview,2016 & 2021
Figure 80 Rest of Asia-Pacific Plasma Therapy Market Overview, 2016 & 2021
Figure 81 Pure PRP Estimated to Account for the Largest Share in the RoW Plasma Therapy Market in 2016
Figure 82 RoW Plasma Therapy Market Overview,2016
Figure 83 RoW Plasma Therapy Market ,By Source ,2014 to 2021 (USD Million)
Figure 84 RoW Plasma Therapy Market ,By Application , 2016 & 2021 (USD Million)
Figure 85 RoW Plasma Therapy Market in Orthopedic, By Type, 2016–2021 (USD Million)
Figure 86 RoW Plasma Therapy Market in Dermatology, By Type, 2016 & 2021 (USD Million)
Figure 87 RoW Plasma Therapy Market, By End User, 2014–2021 (USD Million)
Figure 88 Leading Market Players Adopted Organic and Inorganic Growth Strategies in the Past Four Years (2013–2016)
Figure 89 Global Plasma Therapy Market Share Analysis, By Key Player, 2015
Figure 90 Battle for Market Share: Acquisitions, Expansions, and Partnerships are Key Growth Strategies Adopted By Market Players
Figure 91 Baxalta Inc: Company Snapshot
Figure 92 Biotest: Company Snapshot
Figure 93 CSL Ltd.: Company Snapshot
Figure 94 Grifols International S.A.: Company Snapshot
Figure 95 Kedrion S.P.A.: Company Snapshot
Figure 96 LFB SA: Company Snapshot
Figure 97 China Biologic Products, Inc.: Company Snapshot
Figure 98 Octapharma: Company Snapshot

 Generating Response ...


Growth opportunities and latent adjacency in Plasma Therapy Market