
Polyurethane Adhesives Market

Polyurethane Adhesives Market by Type (Thermoset, Thermoplastic), Technology (Solvent-borne, 100% Solids, Dispersion, and Others), Application (Automotive, Building & Construction, Packaging, Leather & Footwear, General Industrial, Furniture & Decoration, and Others), and Region - Global Forecast to 2030


OVERVIEW

Source: Secondary Research, Interviews with Experts, MarketsandMarkets Analysis
The polyurethane adhesives market is projected to reach USD 12,086.6 million by 2030 from USD 9,196.6 million in 2025, at a CAGR of 5.62% from 2025 to 2030. Polyurethane adhesives are a class of synthetic adhesives developed by reacting polyols with isocyanates to form a polymer network. They are known for their high strength, toughness, durability, and resistance to weathering, moisture, chemicals, and temperature changes. The market is growing due to rising demand for lightweight, durable bonding solutions in automotive, construction, and electronics industries, driven by environmental regulations.
KEY TAKEAWAYS
-
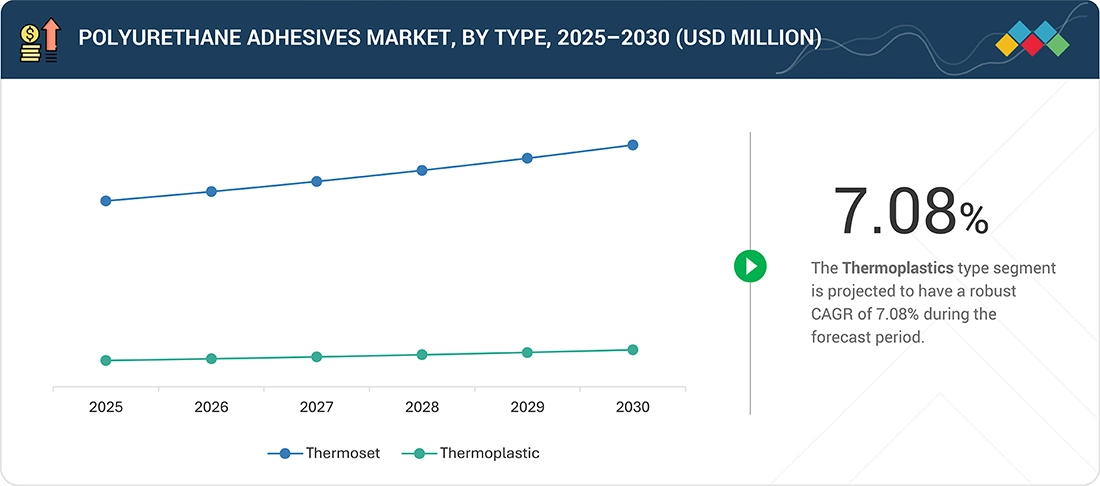
BY TYPEThermoplastic is projected to be the fastest-growing type in the polyurethane adhesives market due to better flexibility, recyclability, and faster processing. It also holds the largest market share. Its growing use in automotive and electronics drives this trend.
-
BY TECHNOLOGYYThe 100% solids technology holds the largest share in the polyurethane adhesives market due to its high efficiency, zero VOC emissions, and strong bonding performance. It is widely adopted in the automotive, construction, and furniture industries for durable and environmentally friendly applications.
-
BY APPLICATIONThe automotive industry holds the largest market share in the polyurethane adhesives market due to the increasing demand for lightweight, durable bonding solutions. PU adhesives are extensively used for interior and exterior component assembly, enhancing vehicle performance and fuel efficiency.
-
BY REGIONAsia Pacific dominates the global polyurethane adhesives market in both size and growth rate. Rapid industrialization, expanding automotive and electronics sectors, and increasing construction activities in countries like China and India are driving strong regional demand.
-
COMPETITIVE LANDSCAPEThe major market players have adopted both organic and inorganic strategies, including expansions, collaborations, and investments. For instance, Henkel expanded its production capabilities in Mexico by opening a new state-of-the-art plant for hot melt adhesives in Guadalupe, Nuevo Leon. The new site would produce adhesives for the efficient bonding of substrates under extreme conditions.
The polyurethane adhesives market is witnessing steady growth, driven by increasing demand across automotive, construction, electronics, and packaging industries. Key trends include the rising preference for environmentally friendly solutions, the shift towards thermoplastic adhesives for better flexibility and recyclability, and the widespread adoption of 100% solids technology for its efficiency and zero VOC emissions. The Asia Pacific region leads the market, fueled by rapid industrial development and growing manufacturing activities. These factors collectively contribute to the robust expansion of the market in the coming years.
TRENDS & DISRUPTIONS IMPACTING CUSTOMERS' CUSTOMERS
Megatrends such as digital transformation and renewable energy sources are poised to influence a company's revenue stream in the future. Emerging trends within the industry include water-borne technology, 100% solids technology, and dispersion technology.

Source: Secondary Research, Interviews with Experts, MarketsandMarkets Analysis
MARKET DYNAMICS
Level
-
Versatility of polyurethane adhesives

-
Increasing demand from automotive industry

Level
-
Stringent regulations in North America and Europe

-
Disruption in raw material value chain due to economic recession

Level
-
Increasing urbanization and growth in construction industry

-
Opportunities in Asia Pacific and Middle East

Level
-
External factors impacting applications

Source: Secondary Research, Interviews with Experts, MarketsandMarkets Analysis
Driver: Versatility of polyurethane adhesives
Polyurethane adhesives are highly valued for their versatility, which allows them to bond a wide range of substrates, including metals, plastics, wood, and composites. This adaptability makes them suitable for diverse applications across industries such as automotive, construction, and electronics. Their ability to perform under varying environmental conditions, from high humidity to temperature fluctuations, further enhances their appeal, making them a preferred choice for manufacturers seeking a reliable and multipurpose bonding solution.
Restraint: Stringent regulations in North America and Europe
The polyurethane adhesives market faces challenges due to stringent regulations in North America and Europe. These regions enforce strict standards related to chemical composition, emissions, and environmental impact, which can increase compliance costs for manufacturers. Regulatory scrutiny on volatile organic compounds (VOCs) and hazardous substances limits formulation flexibility, potentially slowing product innovation and market expansion. As a result, companies must invest in research and development to create eco-friendly and compliant adhesive solutions while navigating complex regulatory landscapes.
Opportunity: Increasing urbanization and growth in construction industry
Rapid urbanization and the expanding construction industry present significant growth opportunities for the polyurethane adhesives market. As cities develop and infrastructure projects multiply, the demand for strong, durable, and versatile bonding solutions rises, particularly for applications in flooring, panels, insulation, and structural assemblies. Polyurethane adhesives, known for their high strength and adaptability, are increasingly preferred in modern construction practices, enabling manufacturers to capitalize on the growing need for reliable and efficient building materials in both residential and commercial projects.
Challenge: External factors impacting applications
The polyurethane adhesives market faces challenges from various external factors that can impact its applications. Fluctuations in raw material prices, supply chain disruptions, and geopolitical uncertainties can affect production costs and availability. Additionally, environmental conditions such as extreme temperatures or humidity variations may limit the performance of certain adhesive formulations in specific applications. These factors require manufacturers and end users to carefully assess application environments and supply stability to ensure consistent product performance and reliability.
Polyurethane Adhesives Market: COMMERCIAL USE CASES ACROSS INDUSTRIES
| COMPANY | USE CASE DESCRIPTION | BENEFITS |
|---|---|---|
 |
Bonding footwear soles to uppers | Strong adhesion, flexibility, and resistance to wear and tear |
 |
Laminating flexible packaging films | Excellent multi-layer bonding, chemical resistance, and low VOC emissions |
 |
Assembling wooden furniture parts | High structural strength, durability, and gap-filling capability |
 |
Bonding automotive interior and exterior components | High mechanical strength, temperature & vibration resistance |
 |
Manufacturing industrial equipment components | High durability, chemical resistance, and thermal stability |
Logos and trademarks shown above are the property of their respective owners. Their use here is for informational and illustrative purposes only.
MARKET ECOSYSTEM
The polyurethane adhesives ecosystem is characterized by interconnected relationships among various stakeholders, including raw material suppliers, manufacturers, distributors, and end users. Raw material suppliers provide materials like polyols, isocyanates, glycols to polyurethane adhesive manufacturers. Distributors and suppliers establish contact between the manufacturing companies and end users to concentrate on the supply chain, increasing operational efficiency and profitability.
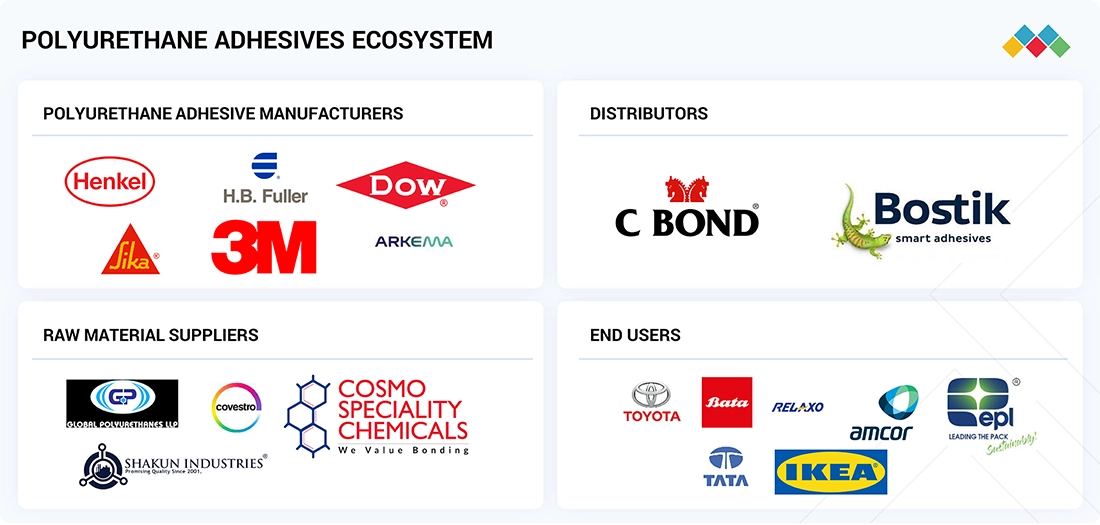
Logos and trademarks shown above are the property of their respective owners. Their use here is for informational and illustrative purposes only.
MARKET SEGMENTS
Source: Secondary Research, Interviews with Experts, MarketsandMarkets Analysis
Polyurethane Adhesives Market, By Type
The thermoplastic segment holds the largest share in the polyurethane adhesives market, driven by its ease of processing and excellent bonding capabilities across multiple substrates. Its ability to be reheated and reshaped without losing adhesive properties makes it highly attractive for industries seeking efficient assembly and repair solutions. This flexibility, combined with consistent performance in applications such as automotive components, packaging, and consumer goods, reinforces its dominant position within the market.
Polyurethane Adhesives Market, By Technology
The 100% solids technology segment dominates the polyurethane adhesives market, largely due to its high efficiency and minimal environmental impact. Unlike solvent-based systems, 100% solid adhesives eliminate the need for volatile organic compounds (VOCs), offering stronger bonds with reduced curing time. This technology is particularly favored in industries like automotive and construction, where high-performance and environmentally compliant adhesive solutions are increasingly in demand.
Polyurethane Adhesives Market, By Application
The automotive segment accounts for the largest application share in the polyurethane adhesives market, driven by the industry’s growing focus on lightweighting, safety, and durability. Polyurethane adhesives are extensively used in bonding structural components, interior parts, and exterior panels, providing strong, flexible, and vibration-resistant joints. Their ability to enhance vehicle performance and assembly efficiency makes them a preferred choice among automakers worldwide.
REGION
Asia Pacific to be fastest-growing region in global polyurethane adhesives market during forecast period
Asia Pacific holds the largest share in the polyurethane adhesives market, fueled by rapid industrialization, expanding automotive production, and a booming construction sector. Countries in the region are witnessing strong demand for high-performance adhesives that support manufacturing efficiency and product durability. Additionally, favorable government initiatives, growing urban infrastructure, and increasing consumer spending contribute to the region’s leading position in the global market.

Polyurethane Adhesives Market: COMPANY EVALUATION MATRIX
In the polyurethane adhesives market matrix, Henkel AG & Co. KGaA (Star) leads with a strong market presence and wide product portfolio, driving large-scale adoption across the industry. Huntsman Corporation (Emerging Leader) is gaining traction with sustainable polyurethane adhesives for bonding solutions. While Henkel AG & Co. AGaA dominates with scale, Huntsman Corporation shows strong growth potential to advance toward the leaders’ quadrant.

Source: Secondary Research, Interviews with Experts, MarketsandMarkets Analysis
KEY MARKET PLAYERS
MARKET SCOPE
| REPORT METRIC | DETAILS |
|---|---|
| Market Size Value in 2024 | USD 8,757.2 MN |
| Revenue Forecast in 2030 | USD 12,086.6 MN |
| Growth Rate | CAGR of 5.62% from 2025-2030 |
| Actual Data | 2020−2030 |
| Base Year | 2024 |
| Forecast Period | 2025−2030 |
| Units Considered | Value (USD Million), Volume (Kiloton) |
| Report Coverage | Revenue forecast, company ranking, competitive landscape, growth factors, and trends |
| Segments Covered |
|
| Regional Scope | North America, Asia Pacific, Europe, South America, and Middle East & Africa |
WHAT IS IN IT FOR YOU: Polyurethane Adhesives Market REPORT CONTENT GUIDE

DELIVERED CUSTOMIZATIONS
We have successfully delivered the following deep-dive customizations:
| CLIENT REQUEST | CUSTOMIZATION DELIVERED | VALUE ADDS |
|---|---|---|
| U.S.-based Polyurethane adhesives Manufacturer |
|
|
| Asia Pacific-based Polyurethane Adhesives Manufacturer |
|
|
RECENT DEVELOPMENTS
- December 2024 : Dow finalized the sale of its flexible packaging laminating adhesives business to Arkema for USD 150 million. This business was a leading global producer of adhesives for the flexible packaging market, with operations in North America and Europe and five production sites. The divestment allowed Dow to streamline its portfolio and focus on other core areas.
- October 2024 : Henkel announced an investment of USD 21 million to expand and modernize its adhesives plant in Bopfingen, Germany. This facility would produce adhesives for the packaging, wood, and furniture industries. The investment aimed to improve infrastructure, increase production capacity, and focus on advanced, sustainable formulations for hot melts and PU adhesives to meet growing industry demand.
- July 2024 : Henkel completed Phase III of its manufacturing facility in Kurkumbh, near Pune, India. The site includes a new Loctite plant and leverages Industry 4.0 technologies for optimized efficiency. This expansion supported local production of high-performance adhesives—including PU adhesives—for manufacturing, maintenance, repair, and automotive components.
- February 2023 : Sika acquired MBCC Group, a major player in construction chemicals, for USD 2.2 billion in net sales (2022). This acquisition significantly broadened Sika’s portfolio in construction systems and admixtures, including PU adhesives, and enhanced its innovative capabilities and global reach.
Table of Contents
 Exclusive indicates content/data unique to MarketsandMarkets and not available with any competitors.
Methodology
The study involved four major activities to estimate the size of the polyurethane adhesives market. Exhaustive secondary research was done to collect information on the market, the peer market, and the parent market. The next step was to validate these findings, assumptions, and sizing with industry experts across the value chain through primary research. In the third step, the top-down and bottom-up approaches were employed to estimate the complete market size. Lastly, the market breakdown and data triangulation procedures were used to estimate the market size of the segments and subsegments.
Secondary Research
Secondary sources used in this study included annual reports, press releases, and investor presentations of companies; white papers; certified publications; articles from recognized authors; and gold standard & silver standard websites, such as Factiva, ICIS, Bloomberg, and others. The findings of this study were verified through primary research by conducting extensive interviews with key officials such as CEOs, VPs, directors, and other executives.
Primary Research
The polyurethane adhesives market comprises several stakeholders in the supply chain. These include raw material suppliers, end-product manufacturers, and regulatory organizations. The demand side of this market is characterized by key opinion leaders in various applications for the polyurethane adhesives market. The supply side is characterized by advancements in technology and diverse application industries. Various primary sources from the supply and demand sides of the market were interviewed to obtain qualitative and quantitative information.
Given below is the breakdown of primary participants considered for this research study:

Tier 1, Tier 2, and Tier 3 companies are classified based on their market revenue in 2023/2024 as well as their product portfolios and geographical presence.
Others include consultants and sales, marketing, and procurement managers.
To know about the assumptions considered for the study, download the pdf brochure
| COMPANY NAME | DESIGNATION | |
|---|---|---|
| Henkel AG & CO. KGaA | Senior Manager | |
| H.B. Fuller | Innovation Manager | |
| Dow Inc. | Vice-President | |
| Sika AG | Production Supervisor | |
| 3M Company | Sales Manager | |
Market Size Estimation
Both top-down and bottom-up approaches were used to estimate and validate the total size of the polyurethane adhesives market. These methods were also used extensively to estimate the size of various subsegments in the market.
The research methodology used to estimate the market size included the following considerations:
- The key players in the industry have been identified through extensive secondary research.
- The industry’s supply chain has been determined through primary and secondary research.
- All percentage shares, splits, and breakdowns have been determined using secondary sources and verified through primary sources.
All possible parameters that affect the markets covered in this research study have been accounted for, viewed in extensive detail, verified through primary research, and analyzed to obtain the final quantitative and qualitative data.

Data Triangulation
After arriving at the overall market size, the market was split into several segments and subsegments, using the market size estimation processes explained above. Data triangulation and market breakdown procedures were employed to complete the overall market engineering process and arrive at the exact statistics of each market segment and subsegment, wherever applicable. The data was triangulated by studying various factors and trends from the demand and supply sides in the polyurethane adhesives industry.
Market Definition
Polyurethane (PU) adhesives are a class of synthetic adhesives made by reacting polyols with isocyanates to form a polymer network. They are known for their high strength, toughness, durability, and resistance to weathering, moisture, chemicals, and temperature changes. They can be modified to meet specific performance requirements by adding fillers, plasticizers, and other additives. The resulting adhesive can be formulated as a liquid, paste, or foam and is used in various industrial applications, including construction, automotive, furniture, and footwear.
Stakeholders
- Manufacturers, dealers, and suppliers of polyurethane adhesives and their raw materials
- Traders, distributors, and suppliers of polyurethane adhesives
- Regional manufacturers’ associations and polyurethane adhesive associations
- Government, regional agencies, and research organizations
Report Objectives
- To analyze and forecast the polyurethane adhesives market in terms of value and volume
- To provide detailed information about the key factors (drivers, restraints, opportunities, and challenges) influencing market growth
- To define, segment, and project the global polyurethane adhesives market size based on type, technology, and application
- To project the market size for the five main regions: North America, Europe, Asia Pacific, the Middle East & Africa, and South America
- To analyze the micromarkets1 in terms of individual growth trends, prospects, and their contribution to the overall market
- To analyze opportunities in the market for stakeholders and provide a competitive landscape of the market leaders
- To track and analyze R&D and competitive developments, such as expansions, product launches, collaborations, investments, partnerships, agreements, developments, collaborations, and mergers & acquisitions, in the polyurethane adhesives market
Key Questions Addressed by the Report
Who are the major players in the polyurethane adhesives market?
Henkel AG & Co. KGaA (Germany), H.B. Fuller (US), Sika AG (Switzerland), Dow Inc. (US), 3M Company (US), Huntsman Corporation (US), Arkema (France), Illinois Tool Works Inc. (US), Parker-Hannifin Corporation (US), Jowat SE (Germany)
What are the drivers and opportunities for the polyurethane adhesives market?
Major drivers: Growth in building & construction, urbanization, infrastructure, and booming furniture industry in Asia Pacific.
Which strategies are key players focusing on in the polyurethane adhesives market?
Product launches, partnerships, mergers & acquisitions, agreements, and global expansion initiatives.
What is the projected growth rate of the polyurethane adhesives market between 2025 and 2030?
The market is projected to grow at a CAGR of 5.62% from 2025 to 2030.
Which primary factors are expected to restrain the growth of the polyurethane adhesives market during the forecast period?
Volatile raw material prices and environmental concerns.
Need a Tailored Report?
Customize this report to your needs
Get 10% FREE Customization
Customize This ReportPersonalize This Research
- Triangulate with your Own Data
- Get Data as per your Format and Definition
- Gain a Deeper Dive on a Specific Application, Geography, Customer or Competitor
- Any level of Personalization
Let Us Help You
- What are the Known and Unknown Adjacencies Impacting the Polyurethane Adhesives Market
- What will your New Revenue Sources be?
- Who will be your Top Customer; what will make them switch?
- Defend your Market Share or Win Competitors
- Get a Scorecard for Target Partners

Custom Market Research Services
We Will Customise The Research For You, In Case The Report Listed Above Does Not Meet With Your Requirements
Get 10% Free Customisation


Growth opportunities and latent adjacency in Polyurethane Adhesives Market