Precious Metal Catalysts Market by Type (Platinum, Palladium, Rhodium, Iridium, Ruthenium) End-use Industry (Automobile, Pharmaceutical, Refinery), and Region - Global Forecast to 2022


The precious metal catalysts market size is estimated to grow from USD 14.37 billion in 2017 to USD 19.41 billion by 2022, at a CAGR of 6.19%. The base year considered for the study is 2016, and the market size is projected from 2017 to 2022. The report aims at estimating the market size and future growth potential of the precious metal catalysts market across different segments—type, end use, and region. The other objectives include providing detailed information regarding the main factors influencing the growth of the market (drivers, restraints, opportunities, and industry-specific challenges). It also aims to study the individual growth trends, prospects, and contribution of various segments to the total market. The study also analyzes opportunities in the market for stakeholders and details of the competitive landscape for the market leaders. The study strategically profiles key players and comprehensively analyzes their core competencies.
Market Dynamics
Drivers
- Growing demand from end-use sectors
- Environmental concern and their legal implications
Restraints
- Performance dependency on temperature & loss of activity through poising and thermal deactivation
- Emergence of nano-particle catalysts
Opportunities
- R&d activities to reduce costs and to improve the quality of catalysts
- Increasing investment in automobile sectors
Challenges
- Precious metals price volatility
- Rising demand of electronic vehicles (EVs) will reduce the usage of precious metals in automobile
- Less stringent emission regulation in APAC region
See how this study impacted revenues for other players in Precious Metal Catalysts Market
Client’s Problem Statement
Our client, a top metal catalyst and silver nitrate manufacturer in India, was keen to increase its market penetration in India. The senior management needed to take a host of crucial decisions – which product to focus on, which technologies to focus on, which application to focus on, and what offering/value proposition to build for target customers. 
MnM Approach
MnM assisted the client with an outside-in perspective on the market potential of palladium, platinum, rhodium, rhenium, ruthenium, silver, gold, and iridium. Further, we helped them by developing an in-depth study of the market as well as customer landscape for the target industry in India. Interviews with a host of potential customers in end-use industries were conducted to understand their unmet needs, pull for target products, and what they looked for in a product supplier. This helped our clients refine their value proposition to gain a market share quickly.
Revenue Impact (RI)
Our findings helped the client to understand the most promising industry in India and the degree of customer acceptance for new products and technology. The study also highlighted the next most potential applications in India, such as pharmaceuticals and automotive.
Rise in demand from end-use sectors along with growing environmental concern and their legal implications drives the demand for precious metal catalyst at a large scale
Precious metal catalysts are widely used in a range of industries such as petrochemicals (producers of petrochemical intermediates), pharmaceuticals for chemical synthesis (producers of bulk and specialty chemicals), automobile (emission reduction), and refining (refineries for the production of clean fuel) industries. The considerable growth of these industries in the last couple of years, along with the strict regulations on emission control and the need for cleaner fuels, heavy, and sour crudes are driving the need for precious metal catalysts.
In the last decade, emission control norms have been more stringent in many developing and developed countries, with developed regions such as North America and Europe becoming tougher with legal implications. The rise in stringent emission control regulations, which have been dominant in Europe and the U.S., is gradually gaining importance in the Asia-Pacific region. China has been the first country in the Asia-Pacific that has adopted these regulations to inhibit emissions. These regulations have been aimed at minimizing vehicle emissions, which have encouraged the growth of the global precious metal catalysts market.
The following are the major objectives of the study.
- To define, segment, and project the precious metal catalyst market on the basis of type, end-use sector, and region
- To project the size of the market and its sub segments in terms of value and volume, with respect to the five main regions (along with their respective key countries), namely, North America, Europe, Asia-Pacific, South America, and the Middle East & Africa
- To provide detailed information about the key factors influencing the growth of the market (drivers, restraints, opportunities, industry-specific challenges, and industry trends)
- To strategically analyze the micromarkets with respect to the individual growth trends, future prospects, and contribution to the total market
- To analyze the opportunities in the market for the stakeholders and provide a competitive landscape of the market leaders
- To analyze the competitive developments such as acquisitions, expansions, and new product launches in the precious metal catalyst market
- To strategically profile the key players and comprehensively analyze their core competencies
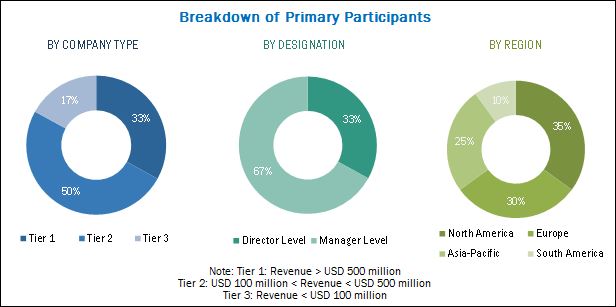
The research methodology used to estimate and forecast the precious metal catalysts market begins with capturing data on key vendor revenues through secondary research and associations such as International Organization of Motor Vehicle Manufacturers (OICA). The vendor offerings are also taken into consideration to determine the market segmentation. The bottom-up procedure was employed to arrive at the overall size of the global precious metal catalysts market from the revenues of the key players. After arriving at the overall market size, the total market was split into several segments and subsegments, which were then verified through primary research by conducting extensive interviews with key people such as CEOs, VPs, directors, and executives. These data triangulation and market breakdown procedures were employed to complete the overall market engineering process and arrive at the exact statistics for all segments and subsegments. The breakdown of profiles of primary participants is depicted in the figure below:
To know about the assumptions considered for the study, download the pdf brochure
The market ecosystem includes various stakeholders involved in the supply chain of the precious metal catalysts industry starting from raw material suppliers, research & development, and manufacturing. Post this, the marketing and sales of the products take place which is only possible if an efficient distribution channel is developed. Finally, the end products are made available to the consumers. The global market for precious metal catalysts is dominated by players such as BASF SE (Germany), Evonik Industries AG (Germany), Johnson Matthey Plc (U.K.), Heraeus Group (U.K.), Clariant International Ltd (Switzerland), Umicore SA (Belgium), Alfa Aesar (U.S.), and Vineeth Precious Catalysts Pvt. Ltd. (India).
Major Market Developments
- In March 2017, BASF Catalyst division has opened new mobile emissions catalysts manufacturing site which will replace existing BASF plant in Chennai and which will doubled the company’s catalyst manufacturing capacity in India.
- In January 2017, Johnson Matthey Fine Chemicals has launched new online catalyst store. The new store will provide customer with easy access to enquiry quantities of commercial grade ligands and catalysts, to accelerate development of efficient and economic processes to pharmaceuticals, agrochemicals, and other applications.
Target audience
- Precious metal catalyst unit producers
- Raw material producers and suppliers
- Precious metal producers and suppliers
- Precious metal catalyst distributors and traders
- End-use sectors
- Governments and R&D institutions
- Market research and consulting firms
- Associations and industry bodies
Scope of the Report
The research report segments the precious metal catalysts market into the following submarkets:
By Type
- Platinum
- Palladium
- Rhodium
- Iridium
- Ruthenium
By End Use
- Automobile
- Pharmaceutical
- Refinery
- Others
By Region:
- North America
- Europe
- Asia-Pacific
- Middle East & Africa
- South America
Available Customizations
With the given market data, MarketsandMarkets offers customizations according to client-specific needs. The following customization options are available for the report:
Product Analysis
- Product Matrix, which gives a detailed comparison of the product portfolio of each company
Geographic Analysis
- Further analysis of the precious metal catalysts market for additional countries
Company Information
- Detailed analysis and profiling of additional market players
MarketsandMarkets projects that the precious metal catalysts market size will grow from USD 14.37 billion in 2017 to USD 19.41 billion by 2022, at a CAGR of 6.19%. The precious metal catalysts market is witnessing considerable growth due to the rise in emission norms among developing and developed countries along with advancements in technology. The precious metal catalysts market has immense opportunities owing to increase in R&D activities by companies to reduce costs and improve the quality of catalysts and rise in investments in the automobile sector, which will drive the demand for emission control catalysts.
On the basis of types, precious metal catalysts considered for the study include platinum, palladium, rhodium, iridium, and ruthenium. The platinum segment is projected to grow at the highest CAGR from 2017 to 2022. The dominant market position of the platinum catalyst segment can be attributed to its stable electrical properties. It is also resistant to chemical reactions and does not oxidize even at high temperatures, and therefore, is extensively used as an ingredient for processing catalyst. Platinum is the most widely used precious metal as a catalytic converter for automobiles as it is highly resistant to corrosion, high temperature, and to sulfur poisoning that is found in gasoline and diesel engines.
In terms of value, the automobile sector, by end-use industry, is projected to grow at the highest rate during the forecast period. This growth is attributed to the rise in stringent emission standards and the growth in the automotive industry. The newly developed emission standards demand additional improvements in catalyst technologies to successfully remove toxic substances from car exhausts, which will, in turn, drive the precious metal catalysts market growth through the automobile sector.
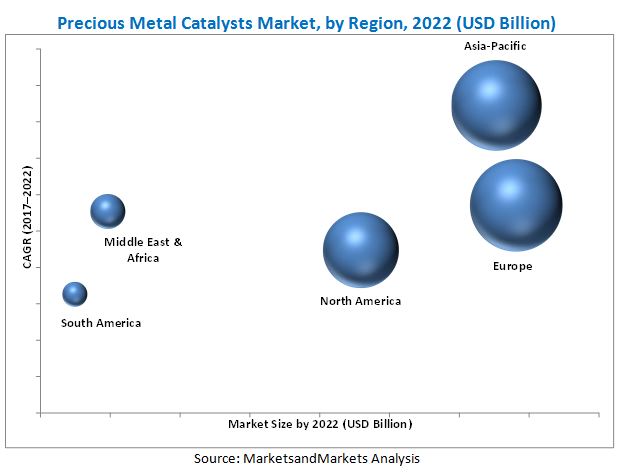
In 2016, the European region accounted for the largest share of the global precious metal catalysts market. However, as the precious metal catalysts market in developed countries is maturing, markets in developing countries such as China and India are projected to grow at the highest rates from 2017 to 2022. The Asia-Pacific region is projected to grow at the highest CAGR compared to those of other region-level markets, owing to the rise in concern regarding emission control and rapid expansion of end-use sectors such as automobiles, pharmaceuticals, refinary, and petrochemical. China and India have been adopting stringent emission control norms; for instance, India levied BSIV in 2017 and China follows Euro-6 equivalent norms, which is expected to drive the demand in the automotive and other industrial sectors in the region, and in turn, drive the precious metal catalysts market as well.
Catalysts’ factors such as performance dependency on temperature & loss of activity through poising and thermal deactivation along with the use of new nano-particle catalysts are restraining the growth of the precious metal catalysts market.
Precious metal catalysts, on the basis of end-use sector, are segmented into automobile, pharmaceutical, refinery, and others such as petrochemical and agriculture. The demand for precious metal catalysts is projected to grow substantially owing to stringent emission standards and the growing automotive & pharmaceutical industries. The rapid growth in car sales and stringent emission standards contribute to create a powerful source of new demand in the emerging markets. For instance, China is projected to record the highest-growth rate in the adoption of emission control standards equivalent to those used in Europe. China is the world’s fastest-growing automotive market and is expected to grow further; this will generate additional demand for precious metal catalysts for emission control.
The global precious metal catalysts market is dominated by players such The global market for precious metal catalyst is dominated by players such as as BASF SE (Germany), Evonik Industries AG (Germany), Johnson Matthey Plc (U.K), Heraeus Group (U.K.), Clariant International Ltd (Switzerland), Umicore SA (Belgium), Alfa Aesar (U.S.), and Vineeth Precious Catalysts Pvt. Ltd. (India) etc. These players adopted various strategies such as new product and technology launches, expansions & investments, agreements & contracts, joint ventures, and mergers & acquisitions to develop the precious metal catalysts market.
Critical questions the report answers:
- What is the environmental, economical, and technological scenario currently prevailing in different regions and their impact on the demand for precious metal catalyst?
- What are the upcoming economical substitutes of precious metal catalyst?
- What are the major industrial trends influencing the growth of precious metal catalyst market?
To speak to our analyst for a discussion on the above findings, click Speak to Analyst
 Exclusive indicates content/data unique to MarketsandMarkets and not available with any competitors.
Table of Contents
1 Introduction (Page No. - 16)
1.1 Objectives of the Study
1.2 Market Definition
1.3 Study Scope
1.3.1 Regional Scope
1.3.2 Periodization Considered for the Study
1.4 Currency
1.5 Units Considered
1.6 Stakeholders
2 Research Methodology (Page No. - 19)
2.1 Research Data
2.1.1 Secondary Data
2.1.1.1 Key Data From Secondary Sources
2.1.2 Primary Data
2.1.2.1 Key Data From Primary Sources
2.1.2.2 Breakdown of Primaries
2.2 Market Size Estimation
2.3 Data Triangulation
2.4 Research Assumptions
2.5 Limitations
3 Executive Summary (Page No. - 27)
4 Premium Insights (Page No. - 30)
4.1 Developing Economies to Witness Higher Demand for Precious Metal Catalysts
4.2 Precious Metal Catalysts, By Type
4.3 Precious Metal Catalysts Market, By End-Use Sector
4.4 Europe: Precious Metal Catalysts Market, By End-Use Sector and Key Country
4.5 Precious Metal Catalysts Market: Geographic Snapshot
5 Market Overview (Page No. - 34)
5.1 Introduction
5.2 Market Evolution
5.3 Market Dynamics
5.3.1 Drivers
5.3.1.1 Growing Demand From End-Use Sectors
5.3.1.2 Environmental Concerns and Their Legal Implications
5.3.2 Restraints
5.3.2.1 Performance Dependency on Temperature & Loss of Activity Through Poising and Thermal Deactivation
5.3.2.2 Emergence of Nano-Particle Catalysts
5.3.3 Opportunities
5.3.3.1 R&D Activity to Reduce Costs and Improve the Quality of Catalysts
5.3.3.2 Increasing Investment in Automobile Sector
5.3.4 Challenges
5.3.4.1 Price Volatility of Precious Metals
5.3.4.2 Rising Demand for Electric Vehicles
5.3.4.3 Less Stringent Emission Regulations in Asia-Pacific Region
6 Macroeconomic Overview (Page No. - 41)
6.1 Introduction
6.2 Trends and Forecast of GDP
6.3 Trends of the Automobile Industry
6.4 Global Precious Metal Production Trends
7 Precious Metal Catalysts Market, By Type (Page No. - 44)
7.1 Introduction
7.2 Platinum
7.3 Palladium
7.4 Rhodium
7.5 Ruthenium
7.6 Iridium
8 Precious Metal Catalysts Market, By End-Use Sector (Page No. - 48)
8.1 Introduction
8.2 Automobile
8.3 Pharmaceutical
8.4 Refinery
8.5 Others
9 Precious Metal Catalysts Market, By Region (Page No. - 52)
9.1 Introduction
9.2 North America
9.2.1 North America: Precious Metal Catalysts Market, By Country
9.2.2 North America: Precious Metal Catalysts Market, By Type
9.2.3 North America: Precious Metal Catalysts Market, By End-Use Sector
9.2.4 U.S.
9.2.4.1 By Type
9.2.4.2 By End-Use Sector
9.2.5 Canada
9.2.5.1 By Type
9.2.5.2 By End-Use Sector
9.2.6 Mexico
9.2.6.1 By Type
9.2.6.2 By End-Use Sector
9.3 Europe
9.3.1 Europe: Precious Metal Catalysts Market, By Country
9.3.2 Europe: Precious Metal Catalyst Market Size, By Type
9.3.3 Europe: Precious Metal Catalyst Market Size, By End-Use Sector
9.3.4 U.K.
9.3.4.1 By Type
9.3.4.2 By End-Use Sector
9.3.5 Germany
9.3.5.1 By Type
9.3.5.2 By End-Use Sector
9.3.6 Italy
9.3.6.1 By Type
9.3.6.2 By End-Use Sector
9.3.7 France
9.3.7.1 By Type
9.3.7.2 By End-Use Sector
9.3.8 Russia
9.3.8.1 By Type
9.3.8.2 By End-Use Sector
9.3.9 Spain
9.3.9.1 By Type
9.3.9.2 By End-Use Sector
9.3.10 Rest of Europe
9.3.10.1 By Type
9.3.10.2 By End-Use Sector
9.4 Asia-Pacific
9.4.1 Asia-Pacific: Precious Metal Catalysts Market, By Country
9.4.2 Asia-Pacific: Precious Metal Catalysts Market, By Type
9.4.3 Asia-Pacific: Precious Metal Catalysts Market, By End-Use Sector
9.4.4 China
9.4.4.1 By Type
9.4.4.2 By End-Use Sector
9.4.5 India
9.4.5.1 By Type
9.4.5.2 By End-Use Sector
9.4.6 Japan
9.4.6.1 By Type
9.4.6.2 By End-Use Sector
9.4.7 South Korea
9.4.7.1 By Type
9.4.7.2 By End-Use Sector
9.4.8 Australia
9.4.8.1 By Type
9.4.8.2 By End-Use Sector
9.4.9 Rest of Asia-Pacific
9.4.9.1 By Type
9.4.9.2 By End-Use Sector
9.5 Middle East & Africa
9.5.1 Middle East & Africa: Precious Metal Catalysts Market, By Country
9.5.2 Middle East & Africa: Precious Metal Catalysts Market, By Type
9.5.3 Middle East & Africa: Precious Metal Catalysts Market, By End-Use Sector
9.5.4 Turkey
9.5.4.1 By Type
9.5.4.2 By End Use-Sector
9.5.5 UAE
9.5.5.1 By Type
9.5.5.2 By End-Use Sector
9.5.6 South Africa
9.5.6.1 By Type
9.5.6.2 By End-Use Sector
9.5.7 Saudi Arabia
9.5.7.1 By Type
9.5.7.2 By End-Use Sector
9.5.8 Rest of the Middle East & Africa
9.5.8.1 By Type
9.5.8.2 By End-Use Sector
9.6 South America
9.6.1 South America: Precious Metal Catalysts Market, By Country
9.6.2 South America: Precious Metal Catalysts Market, By Type
9.6.3 South America: Precious Metal Catalysts Market, By End-Use Sector
9.6.4 Brazil
9.6.4.1 By Type
9.6.4.2 By End-Use Sector
9.6.5 Argentina
9.6.5.1 By Type
9.6.5.2 By End-Use Sector
9.6.6 Rest of South America
9.6.6.1 By Type
9.6.6.2 By End-Use Sector
10 Competitive Landscape (Page No. - 129)
10.1 Introduction
10.2 Competitive Leadership Mapping, 2016
10.2.1 Dynamic Differentiators
10.2.2 Innovators
10.2.3 Visionary Leaders
10.2.4 Emerging Companies
10.3 Competitive Benchmarking
10.3.1 Strength of Product Portfolio
10.3.2 Business Strategy Excellence
*Top 25 Companies Analyzed for This Study are - BASF SE, Evonik Industries AG, Johnson Matthey PLC, Heraeus Group, Clariant International Ltd, Xi’an Catalyst New Materials Co.,Ltd, Umicore Sa, Alfa Aesar, Shaanxi Kai Da Chemical Engineering Co., Ltd, Vineeth Precious Catalysts Pvt. Ltd., Chimet S.P.A., Sabin Metal Corporation, American Elements, Remetall Deutschland AG, ALS Limited, J&J Materials Inc, Kunming Sino- Platinum Metals Catalyst Co., Ltd, Catalytic Products International, Stanford Advanced Materials, Souvenier Chemicals, Arora Matthey Limited,DCL International Inc., Monarch Catalyst Pvt Ltd., Catalysts and Technologies, N.E. Chemcat Corporation
10.4 Market Share Analysis
10.4.1 Johnson Matthey PLC
10.4.2 BASF SE
10.4.3 Evonik Industries AG
10.4.4 Clariant International Ltd
10.4.5 Heraeus Group
11 Company Profiles (Page No. - 135)
(Business Overview, Products Offered, Product Offering Scorecard, Business Strategy Scorecard, Recent Developments, Key Relationships)*
11.1 BASF SE
11.2 Evonik Industries AG
11.3 Johnson Matthey PLC
11.4 Heraeus Group
11.5 Clariant International Ltd
11.6 Umicore Sa
11.7 Alfa Aesar
11.8 Shaanxi Kai Da Chemical Engineering Co.,Ltd
11.9 Xi'an Catalyst New Materials Co.,Ltd
11.10 Vineeth Precious Catalysts Pvt. Ltd.
11.11 Additional Companies
11.11.1 Chimet S.P.A.
11.11.2 Sabin Metal Corporation
11.11.3 American Elements
11.11.4 Remettal Deutschland AG
11.11.5 ALS Limited
11.11.6 J&J Materials Inc.
11.11.7 Kunming Sino- Platinum Metals Catalyst Co., Ltd.
11.11.8 Catalytic Products International
11.11.9 Stanford Advanced Materials
11.11.10 Souvenier Chemicals
11.11.11 Arora Matthey Limited
11.11.12DCL International Inc.
11.11.13 Monarch Catalyst Pvt. Ltd.
11.11.14 Catalysts and Technologies
11.11.15 N.E. Chemcat Corporation
*Details on Business Overview, Products Offered, Product Offering Scorecard, Business Strategy Scorecard, Recent Developments, Key Relationships Might Not Be Captured in Case of Unlisted Companies.
12 Appendix (Page No. - 171)
12.1 Discussion Guide
12.2 Knowledge Store: Marketsandmarkets’ Subscription Portal
12.3 Introducing RT: Real-Time Market Intelligence
12.4 Available Customizations
12.5 Related Reports
12.6 Author Details
List of Tables (133 Tables)
Table 1 GDP, By Country, 2014–2021 (USD Billion)
Table 2 Automobile Production, By Country, 2013-2016 (Thousand Units)
Table 3 Precious Metal Catalysts Market Size, By Type, 2017–2022 (USD Million)
Table 4 By Market Size, By Type, 2017–2022 (Kg)
Table 5 Precious Metal Catalysts Market Size, By End-Use Sector, 2017–2022 (USD Million)
Table 6 By Market Size, By End-Use Sector, 2017–2022 (Kg)
Table 7 By Market Size, By Region, 2015–2022 (USD Million)
Table 8 By Market Size, By Region, 2015–2022 (Kg)
Table 9 North America: By Market Size, By Country, 2015–2022 (USD Million)
Table 10 North America: Precious Metal Catalysts Market Size, By Country, 2015–2022 (Kg)
Table 11 North America: By Market Size, By Type, 2015–2022 (USD Million)
Table 12 North America: By Market Size, By Type, 2015–2022 (Kg)
Table 13 North America: By Market Size, By End-Use Sector, 2015–2022 (USD Million)
Table 14 North America: By Market Size, By End-Use Sector, 2015–2022 (Kg)
Table 15 U.S.: By Market Size, By Type, 2015–2022 (USD Million)
Table 16 U.S.: By Market Size, By Type, 2015–2022 (Kg)
Table 17 U.S.: By Market Size, By End-Use Sector, 2015–2022 (USD Million)
Table 18 U.S.: By Market Size, By End-Use Sector, 2015–2022 (Kg)
Table 19 Canada: By Market Size, By Type, 2015–2022 (USD Million)
Table 20 Canada: By Market Size, By Type , 2015–2022 (Kg)
Table 21 Canada: By Market Size, By End-Use Sector, 2015–2022 (USD Million)
Table 22 Canada: By Market Size, By End-Use Sector, 2015–2022 (Kg)
Table 23 Mexico: By Market Size, By Type, 2015–2022 (USD Million)
Table 24 Mexico: By Market Size, By Type, 2015–2022 (Kg)
Table 25 Mexico: By Market Size, By End-Use Sector, 2015–2022 (USD Million)
Table 26 Mexico: By Market Size, By End-Use Sector, 2015–2022 (Kg)
Table 27 Europe: By Market Size, By Country, 2015–2022 (USD Million)
Table 28 Europe: By Market Size, By Country, 2015–2022 (Kg)
Table 29 Europe: By Market Size, By Type, 2015–2022 (USD Million)
Table 30 Europe: Precious Metal Catalysts Market Size, By Type, 2015–2022 (Kg)
Table 31 Europe: By Market Size, By End-Use Sector, 2015–2022 (USD Million)
Table 32 Europe: Precious Metal Catalysts Market Size, By End-Use Sector, 2015–2022 (Kg)
Table 33 U.K.: By Market Size, By Type, 2015–2022 (USD Million)
Table 34 U.K.: By Market Size, By Type, 2015–2022 (Kg)
Table 35 U.K.: By Market Size, By End-Use Sector, 2015–2022 (USD Million)
Table 36 U.K.: By Market Size, By End-Use Sector, 2015–2022 (Kg)
Table 37 Germany: By Market Size, By Type, 2015–2022 (USD Million)
Table 38 Germany: By Market Size, By Type, 2015–2022 (Kg)
Table 39 Germany: By Market Size, By End-Use Sector, 2015–2022 (USD Million)
Table 40 Germany: By Market Size, By End-Use Sector, 2015–2022 (Kg)
Table 41 Italy: By Market Size, By Type, 2015–2022 (USD Million)
Table 42 Italy: By Market Size, By Type, 2015–2022 (Kg)
Table 43 Italy: By Market Size, By End-Use Sector, 2015–2022 (USD Million)
Table 44 Italy: By Market Size, By End-Use Sector, 2015–2022 (Kg)
Table 45 France: By Market Size, By Type, 2015–2022 (USD Million)
Table 46 France: By Market Size, By Type, 2015–2022 (Kg)
Table 47 France: By Market Size, By End-Use Sector, 2015–2022 (USD Million)
Table 48 France: By Market Size, By End-Use Sector, 2015–2022 (Kg)
Table 49 Russia: By Market Size, By Type, 2015–2022 (USD Million)
Table 50 Russia: By Market Size, By Type, 2015–2022 (Kg)
Table 51 Russia: By Market Size, By End-Use Sector, 2015–2022 (USD Million)
Table 52 Russia: By Market Size, By End-Use Sector, 2015–2022 (Kg)
Table 53 Spain: By Market Size, By Type, 2015–2022 (USD Million)
Table 54 Spain: By Market Size, By Type, 2015–2022 (Kg)
Table 55 Spain: By Market Size, By End-Use Sector, 2015–2022 (USD Million)
Table 56 Spain: By Market Size, By End-Use Sector, 2015–2022 (Kg)
Table 57 Rest of Europe: By Market Size, By Type, 2015–2022 (USD Million)
Table 58 Rest of Europe: By Market Size, By Type, 2015–2022 (Kg)
Table 59 Rest of Europe: By Market Size, By End-Use Sector, 2015–2022 (USD Million)
Table 60 Rest of Europe: By Market Size, By, 2015–2022 (Kg)
Table 61 Asia-Pacific: By Market Size, By Country, 2015–2022 (USD Million)
Table 62 Asia-Pacific: By Market Size, By Country, 2015–2022 (Kg)
Table 63 Asia-Pacific: By Market Size, By Type, 2015–2022 (USD Million)
Table 64 Asia-Pacific: By Market Size, By Type, 2015–2022 (Kg)
Table 65 Asia-Pacific: By Market Size, By End-Use Sector, 2015–2022 (USD Million)
Table 66 Asia-Pacific: By Market Size, By End-Use Sector, 2015–2022 (Kg)
Table 67 China: By Market Size, By Type, 2015–2022 (USD Million)
Table 68 China: By Market Size, By Type, 2015–2022 (Kg)
Table 69 China: By Market Size, By End-Use Sector, 2015–2022 (USD Million)
Table 70 China: By Market Size, By End-Use Sector, 2015–2022 (Kg)
Table 71 India: By Market Size, By Type, 2015–2022 (USD Million)
Table 72 India: By Market Size, By Type, 2015–2022 (Kg)
Table 73 India: By Market Size, By End-Use Sector, 2015–2022 (USD Million)
Table 74 India: By Market Size, By End-Use Sector, 2015–2022 (Kg)
Table 75 Japan: By Market Size, By Type, 2015–2022 (USD Million)
Table 76 Japan: By Market Size, By Type, 2015–2022 (Kg)
Table 77 Japan: By Market Size, By End-Use Sector, 2015–2022 (USD Million)
Table 78 Japan: By Market Size, By End-Use Sector, 2015–2022 (Kg)
Table 79 South Korea: By Market Size, By Type, 2015–2022 (USD Million)
Table 80 South Korea: By Market Size, By Type, 2015–2022 (Kg)
Table 81 South Korea: By Market Size, By End-Use Sector, 2015–2022 (USD Million)
Table 82 South Korea: By Market Size, By End-Use Sector, 2015–2022 (Kg)
Table 83 Australia: By Market Size, By Type, 2015–2022 (USD Million)
Table 84 Australia: By Market Size, By Type, 2015–2022 (Kg)
Table 85 Australia: By Market Size, By End-Use Sector, 2015–2022 (USD Million)
Table 86 Australia: By Market Size, By End-Use Sector, 2015–2022 (Kg)
Table 87 Rest of Asia-Pacific: By Market Size, By Type, 2015–2022 (USD Million)
Table 88 Rest of Asia-Pacific: By Market Size, By Type, 2015–2022 (Kg)
Table 89 Rest of Asia-Pacific: By Market Size, By End-Use Sector, 2015–2022 (USD Million)
Table 90 Rest of Asia-Pacific: By Market Size, By End-Use Sector, 2015–2022 (Kg)
Table 91 Middle East & Africa: By Market Size, By Country, 2015–2022 (USD Million)
Table 92 Middle East & Africa: By Market Size, By Country, 2015–2022 (Kg)
Table 93 Middle East & Africa: Precious Metal Catalysts Market Size, By Type, 2015–2022 (USD Million)
Table 94 Middle East & Africa: By Market Size, By Type, 2015–2022 (Kg)
Table 95 Middle East & Africa: By Market Size, By End-Use Sector, 2015–2022 (USD Million)
Table 96 Middle East & Africa: By Market Size, By End-Use Sector, 2015–2022 (Kg)
Table 97 Turkey: By Market Size, By Type, 2015–2022 (USD Million)
Table 98 Turkey: By Market Size, By Type, 2015–2022 (Kg)
Table 99 Turkey: By Market Size, By End-Use Sector, 2015–2022 (USD Million)
Table 100 Turkey: By Market Size, By End-Use Sector, 2015–2022 (Kg)
Table 101 UAE: By Market Size, By Type, 2015–2022 (USD Million)
Table 102 UAE: By Market Size, By Type, 2015–2022 (Kg)
Table 103 UAE: By Market Size, By End-Use Sector, 2015–2022 (USD Million)
Table 104 UAE: By Market Size, By End-Use Sector, 2015–2022 (Kg)
Table 105 South Africa: By Market Size, By Type, 2015–2022 (USD Million)
Table 106 South Africa: By Market Size, By End-Use Sector, 2015–2022 (USD Million)
Table 107 South Africa: By Market Size, By End-Use Sector, 2015–2022 (Kg)
Table 108 Saudi Arabia: By Market Size, By Type, 2015–2022 (USD Million)
Table 109 Saudi Arabia: By Market Size, By Type, 2015–2022 (Kg)
Table 110 Saudi Arabia: By Market Size, By End-Use Sector, 2015–2022 (USD Million)
Table 111 Saudi Arabia: By Market Size, By End-Use Sector, 2015–2022 (Kg)
Table 112 Rest of the Middle East & Africa: By Market Size, By Type, 2015–2022 (USD Million)
Table 113 Rest of the Middle East & Africa: By Market Size, By Type, 2015–2022 (Kg)
Table 114 Rest of the Middle East & Africa: By Market Size, By End-Use Sector, 2015–2022 (USD Million)
Table 115 Rest of the Middle East & Africa: By Market Size, By End-Use Sector, 2015–2022 (Kg)
Table 116 South America: By Market Size, By Country, 2015–2022 (USD Million)
Table 117 South America: By Market Size, By Country, 2015–2022 (Kg)
Table 118 South America: By Market Size, By Type, 2015–2022 (USD Million)
Table 119 South America: By Market Size, By Type, 2015–2022 (Kg)
Table 120 South America: By Market Size, By End-Use Sector, 2015–2022 (USD Million)
Table 121 South America: By Market Size, By End-Use Sector, 2015–2022 (Kg)
Table 122 Brazil: By Market Size, By Type, 2015–2022 (USD Million)
Table 123 Brazil: By Market Size, By Type, 2015–2022 (Kg)
Table 124 Brazil: By Market Size, By End-Use Sector, 2015–2022 (USD Million)
Table 125 Brazil: By Market Size, By End-Use Sector, 2015–2022 (Kg)
Table 126 Argentina: By Market Size, By Type, 2015–2022 (USD Million)
Table 127 Argentina: By Market Size, By Type, 2015–2022 (Kg)
Table 128 Argentina: By Market Size, By End-Use Sector, 2015–2022 (USD Million)
Table 129 Argentina: By Market Size, By End-Use Sector, 2015–2022 (Kg)
Table 130 Rest of South America: By Market Size, By Type, 2015–2022 (USD Million)
Table 131 Rest of South America: By Market Size, By Type, 2015–2022 (Kg)
Table 132 Rest of South America: By Market Size, By End-Use Sector, 2015–2022 (USD Million)
Table 133 Rest of South America: By Market Size, By End-Use Sector, 2015–2022 (Kg)
List of Figures (30 Figures)
Figure 1 Precious Metal Catalysts Market Segmentation
Figure 2 Precious Metal Catalyst Market, By Region
Figure 3 Precious Metal Catalysts Market: Research Design
Figure 4 Market Size Estimation Methodology: Bottom-Up Approach
Figure 5 Market Size Estimation Methodology: Top-Down Approach
Figure 6 Precious Metal Catalysts Market: Data Triangulation
Figure 7 Platinum Segment to Grow at the Highest Rate During the Forecast Period
Figure 8 Automobile Sector to Lead the Market for Precious Metal Catalysts Through 2022
Figure 9 Europe Dominated the Precious Metal Catalysts Market in 2016
Figure 10 Emerging Economies Offer Attractive Opportunities in the Precious Metal Catalysts Market
Figure 11 Palladium Segment to Account for the Largest Share in the Forecast Period Through 2022
Figure 12 Automobile Sector to Lead the Market Through 2022
Figure 13 Automobile Sector Captured the Largest Share in Europe in 2016
Figure 14 Market in China Projected to Grow at the Highest Rate From 2017 to 2022
Figure 15 Evolution of the Precious Metal Catalyst Market
Figure 16 Market Dynamics
Figure 17 Global Precious Metal Production Trends, 2010-2015 (Tons)
Figure 18 Platinum Segment is Projected to Record the Largest Demand for Precious Metal Catalysts From 2017 to 2022
Figure 19 Automobile Sector is Projected to Record the Largest Demand for Precious Metal Catalysts From 2017 to 2022
Figure 20 Geographic Snapshot (2017–2022): the Market in China is Projected to Grow at the Highest Rate
Figure 21 Europe Precious Metal Catalyst Market Snapshot: Germany Dominated the Market With the Largest Market Share in 2016
Figure 22 Competitive Leadership Mapping, 2016
Figure 23 Precious Metal Catalyst Market Share, By Key Player, 2016
Figure 24 BASF SE: Company Snapshot
Figure 25 Evonik Industries AG: Company Snapshot
Figure 26 Johnson Matthey: Company Snapshot
Figure 27 Heraeus Group: Company Snapshot
Figure 28 Clariant International Ltd: Company Snapshot
Figure 29 Umicore Sa: Company Snapshot
Figure 30 Alfa Aesar: Company Snapshot


Growth opportunities and latent adjacency in Precious Metal Catalysts Market