Reaction Monitoring Market by Technology (Spectroscopy (MS, IR, UV, NMR, Raman), Chromatography (GC, LC), Calorimetry, Titrimetry, XRD), Mode (Quantitative, Qualitative), End User (Research, Pharma-Biotech, Food & Beverages Co) - Global Forecasts to 2022


[165 Pages Report] The global reaction monitoring market is expected to reach USD 1.52 Billion by 2022 from USD 1.09 Billion in 2016 at a CAGR of 5.7% during the forecast period.
Years considered for the study are as follows:
- Base Year: 2016
- Forecast Period: 2017–2022
Objectives of the study are:
- To define, describe, and forecast the global reaction monitoring market on the basis of technology, reaction mode, end user, and region
- To provide detailed information regarding the major factors influencing the growth of the global market (drivers, restraints, opportunities, and industry-specific challenges)
- To analyze the micromarkets with respect to individual growth trends, prospects, and contributions to the total market
- To analyze the opportunities in the market for major stakeholders and provide details of the competitive landscape for top players in the global market for reaction monitoring
- To forecast the market value of the market for reaction monitoring with respect to four main regions, namely, North America, Europe, Asia Pacific, and the Rest of the World
- To profile key players in the global market and comprehensively analyze their market shares and core competencies
- To track and analyze competitive developments such as product launches; agreements, partnerships, and collaborations; geographic expansions; joint ventures; and mergers and acquisitions in the global market
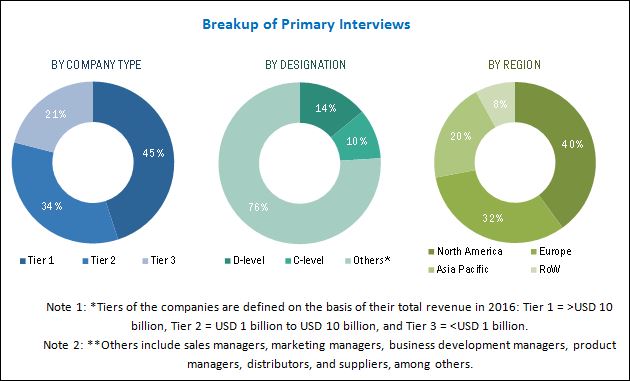
This research study involves the extensive usage of secondary sources, directories, and databases (such as Hoover’s, Bloomberg Business, Factiva, and Avention), in order to identify and collect information useful for this technical, market-oriented, and financial study of the reaction monitoring market. In-depth interviews were conducted with various primary respondents, including subject-matter experts (SMEs), C-level executives of key market players, and industry consultants to obtain and verify qualitative and quantitative information and to assess market prospects.
To know about the assumptions considered for the study, download the pdf brochure
As of 2016, Thermo Fisher Scientific (US), Waters (US), and Agilent Technologies (US) held the leading position in the market. These companies adopted product launches, agreements, and partnerships as their business strategies in the past three years to ensure market dominance.
Danaher (US), PerkinElmer (US), Shimadzu (Japan), Bio-Rad Laboratories (US), Bruker (US), Hitachi High-Technologies (Japan), and Merck (Germany) are some of the other major players in market.
Stakeholders
- Reaction monitoring instrument manufacturers, suppliers, and distributors
- Chemical and analytical instrument manufacturers
- Software developers and distributors
- Third-party product suppliers and channel partners
- Pharma & biotech companies
- Clinical research and contract research organizations
- Academic institutions and research laboratories
- Environmental testing laboratories
- Food and beverage product manufacturers
- Hospitals and diagnostic centers
- Custom service laboratories
- Government and non-government organizations
- National and international regulatory authorities
Scope of the Report
This report categorizes the global market into the following segments and subsegments:
Global Reaction Monitoring Market, by Technology
-
Spectroscopy
- Mass Spectroscopy
- Nuclear Magnetic Resonance
- Ultraviolet-visible Spectroscopy
- Infrared Spectroscopy
- Raman Spectroscopy
-
Chromatography
- Gas Chromatography
- Liquid Chromatography
- Other Chromatography
- Calorimetry
- Titrimetry
- X-Ray Diffraction
Global Reaction monitoring Market, by End User
- Pharmaceutical, Biopharmaceutical, and Biotechnology Companies
- Life Science and Genomic Research Facilities
- Food and Beverage Industry
- Pollution Monitoring and Control Industry
- Other End Users
Global Reaction monitoring Market, by Reaction Mode
- Quantitative Reaction Mode
- Qualitative Reaction Mode
Global Reaction monitoring Market, by Region
-
North America
- US
- Canada
-
Europe
- Germany
- France
- UK
- RoE
-
Asia Pacific
- Japan
- China
- India
- RoAPAC
- Rest of the World (RoW)
Available Customizations
With the given market data, MarketsandMarkets offers customizations as per the company’s specific needs. The following customization options are available for the report:
Company Information
- Detailed analysis and profiling of additional market players (up to 15)
The global reaction monitoring market is projected to reach USD 1.52 Billion by 2022 from USD 1.15 Billion in 2017, at a CAGR of 5.7%. Factors such as stringent regulatory guidelines in the pharmaceutical & biotechnology industry; expansion of the food and beverages industry; and increasing public-private investments in life science research are driving the market.
This report broadly segments the reaction monitoring market into technology, reaction mode, and end user. On the basis of technology, the market is categorized into spectroscopy, chromatography, X-ray diffraction, calorimetry, and titrimetry. In 2017, the spectroscopy segment is expected to account for the largest share of the market. The large share of this segment can be attributed to the widespread use of spectroscopic techniques, increasing drug development pipelines, and stringent regulatory compliance for drug manufacturing & food processing protocols.
Based on reaction mode, the market is segmented into qualitative reaction mode and quantitative reaction mode. The quantitative reaction mode segment is estimated to command the largest share of the global market in 2017. The large share of this segment is mainly due to factors such as ongoing technological advancements in the field of analytical techniques (such as real-time quantification, device miniaturization, and process automation) and ongoing expansion and modernization of the pharmaceutical & biotechnology and food processing industries.
On the basis of end user, the market is segmented pharmaceutical, biopharmaceutical, and biotechnology companies, life science and genomic research facilities, food and beverage industry, pollution monitoring and control industry, and other end users. The pharmaceutical, biopharmaceutical, and biotechnology companies segment is projected to register the fastest rate during the forecast period. This can be attributed to the stringent regulations for pharmaceutical drug development and manufacturing (such as cGMP, cGLP, and EXCiPACT certification) and increasing usage of analytical techniques during quality assessment during drug manufacturing.
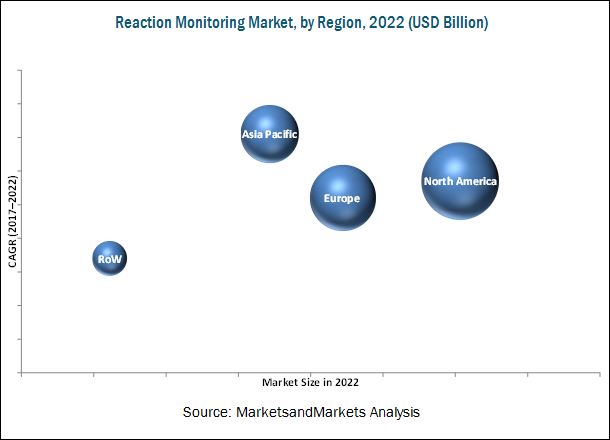
The report covers the reaction monitoring market across four major geographies, namely, North America, Europe, Asia Pacific, and the Rest of the World (RoW). North America is expected to command the largest share of the market in 2017 due to the availability of private-public funding & investments for life science research, stringent regulatory framework for drug development & commercialization, effective implementation & industrial compliance with food safety regulations, rising adoption of technologically advanced pollution monitoring & control products, and growing number of clinical researches in this region. However, Asia Pacific is expected to register the highest growth rate during the forecast period. Government investments to strengthen food processing & biomedical industry in China & India; rising public emphasis on effective pollution monitoring & control (especially air pollution, water pollution, and biohazard monitoring & control); and increasing public-private funding, investments, & grants for various research activities are some of the major factors driving the growth of the Asia Pacific market.
To speak to our analyst for a discussion on the above findings, click Speak to Analyst
 Exclusive indicates content/data unique to MarketsandMarkets and not available with any competitors.
Table of Contents
1 Introduction (Page No. - 14)
1.1 Objectives of the Study
1.2 Market Definition
1.3 Market Scope
1.3.1 Markets Covered
1.3.2 Geographic Scope
1.3.3 Years Considered for the Study
1.4 Currency Used
1.5 Research Limitations
1.6 Major Stakeholders
2 Research Methodology (Page No. - 18)
2.1 Research Data
2.1.1 Secondary Data
2.1.1.1 Key Data From Secondary Sources
2.1.2 Primary Data
2.1.2.1 Key Data From Primary Sources
2.2 Market Size Estimation Methodology
2.2.1 Bottom-Up Approach
2.2.2 Top-Down Approach
2.3 Market Data Validation and Triangulation
2.4 Research Assumptions
3 Executive Summary (Page No. - 27)
4 Premium Insights (Page No. - 30)
4.1 Market Overview (2017-2022)
4.2 Global Market for Spectroscopy, By Type (2017-2022)
4.3 Asia Pacific Market, By Technology and Country (2017)
4.4 Global Market, By Reaction Mode (2017 vs 2022)
4.5 Global Market, By End User (2017 vs 2022)
4.6 Geographic Snapshot of the Global Market (2017 vs 2022)
5 Market Overview (Page No. - 35)
5.1 Introduction
5.1.1 Market Drivers
5.1.1.1 Stringent Regulatory Guidelines in the Pharmaceutical & Biotechnology Industry
5.1.1.2 Expansion of the Food and Beverage Industry
5.1.1.3 Launch of Innovative Products
5.1.1.4 Increasing Public-Private Investments in Life Science Research
5.1.1.5 Increasing Government Support for Strengthening Pollution Monitoring and Control
5.1.2 Market Restraints
5.1.2.1 High Product Costs Associated With Analytical Instruments
5.1.2.2 Slow Implementation of Pollution Control Reforms in Developing Countries
5.1.2.3 Uncertain and Inconsistent Environmental Regulations and Funding Across Emerging Countries
5.1.3 Growth Opportunity
5.1.3.1 Emerging Markets
5.1.4 Market Challenge
5.1.4.1 Dearth of Skilled Professionals
6 Reaction Monitoring Market, By Technology (Page No. - 43)
6.1 Introduction
6.2 Spectroscopy
6.2.1 Mass Spectroscopy
6.2.2 Nuclear Magnetic Resonance (NMR) Spectroscopy
6.2.3 Ultraviolet-Visible (UV-VIS) Spectroscopy
6.2.4 Raman Spectroscopy
6.2.5 Infrared (IR) Spectroscopy
6.3 Chromatography
6.3.1 Gas Chromatography (GC)
6.3.2 Liquid Chromatography (LC)
6.3.3 Other Chromatography Techniques
6.4 Titration
6.5 X-Ray Diffraction
6.6 Calorimetry
7 Reaction Monitoring Market, By Reaction Mode (Page No. - 57)
7.1 Introduction
7.2 Quantitative Monitoring
7.3 Qualitative Monitoring
8 Reaction Monitoring Market, By End User (Page No. - 61)
8.1 Introduction
8.2 Pharmaceutical, Biopharmaceutical, and Biotechnology Companies
8.3 Life Science & Genomic Research Facilities
8.4 Food & Beverages Industry
8.5 Pollution Monitoring & Control Industry
8.6 Other End Users
9 Reaction Monitoring Market, By Region (Page No. - 69)
9.1 Introduction
9.2 North America
9.2.1 US
9.2.2 Canada
9.3 Europe
9.3.1 Germany
9.3.2 UK
9.3.3 France
9.3.4 Rest of Europe (RoE)
9.4 Asia Pacific
9.4.1 Japan
9.4.2 China
9.4.3 India
9.4.4 Rest of Asia Pacific (RoAPAC)
9.5 Rest of the World
10 Competitive Landscape (Page No. - 94)
10.1 Market Ranking Analysis
11 Company Profiles (Page No. - 95)
(Overview, Products Offered, Product Offering Scorecard, Business Strategy Scorecard, Recent Developments)*
11.1 Thermo Fisher Scientific
11.2 Agilent Technologies
11.3 Danaher
11.4 Perkinelmer
11.5 Shimadzu
11.6 Bio-Rad Laboratories
11.7 Waters
11.8 Hitachi High-Technologies
11.9 Merck
11.10 Bruker
11.11 Restek
11.12 ABB
11.13 Mettler-Toledo International
11.14 Horiba
11.15 Setaram Instrumentation
*Details on Marketsandmarkets View, Overview, Products Offered, Product Offering Scorecard, Business Strategy Scorecard, and Recent Developments Might Not Be Captured in Case of Unlisted Companies.
12 Appendix (Page No. - 155)
12.1 Discussion Guide
12.2 Knowledge Store: Marketsandmarkets’ Subscription Portal
12.3 Introducing RT: Real-Time Market Intelligence
12.4 Available Customizations
12.5 Related Reports
12.6 Author Details
List of Tables (62 Tables)
Table 1 Recent Air Pollution Monitoring Regulations (2010-2016)
Table 2 Global Reaction Monitoring Market, By Technology, 2015–2022 (USD Million)
Table 3 Market for Spectroscopy, By Type, 2015–2022 (USD Million)
Table 4 Market for Spectroscopy, By Region, 2015–2022 (USD Million)
Table 5 Recently Commercialized Ms Instruments (2014-2017)
Table 6 Market for Mass Spectroscopy , By Region, 2015–2022 (USD Million)
Table 7 Market for NMR Spectroscopy, By Region, 2015–2022 (USD Million)
Table 8 Reaction Monitoring Market for UV-VIS Spectroscopy , By Region, 2015–2022 (USD Million)
Table 9 Market for Raman Spectroscopy, By Region, 2015–2022 (USD Million)
Table 10 Market for Infrared Spectroscopy, By Region, 2015–2022 (USD Million)
Table 11 Market for Chromatography, By Type, 2015–2022 (USD Million)
Table 12 Market for Chromatography, By Region, 2015–2022 (USD Million)
Table 13 Reaction Monitoring Market for Gas Chromatography , By Region, 2015–2022 (USD Million)
Table 14 Market for Liquid Chromatography , By Region, 2015–2022 (USD Million)
Table 15 Market for Other Chromatography Techniques, By Region, 2015–2022 (USD Million)
Table 16 Market for Titration, By Region, 2015–2022 (USD Million)
Table 17 Market for X-Ray Diffraction, By Region, 2015–2022 (USD Million)
Table 18 Reaction Monitoring Market for Calorimetry, By Region, 2015–2022 (USD Million)
Table 19 Global Market, By Reaction Mode, 2015–2022 (USD Million)
Table 20 Quantitative Monitoring Market, By Region, 2015–2022 (USD Million)
Table 21 Qualitative Monitoring Market, By Region, 2015–2022 (USD Million)
Table 22 Global Reaction Monitoring Market, By End User, 2015–2022 (USD Million)
Table 23 Market for Pharmaceutical, Biopharmaceutical, and Biotechnology Companies, By Region, 2015–2022 (USD Million)
Table 24 Market for Life Science & Genomic Research Facilities, By Region, 2015–2022 (USD Million)
Table 25 Market for Food & Beverage Industry, By Region, 2015–2022 (USD Million)
Table 26 Market for Pollution Monitoring and Control Industry, By Region, 2015–2022 (USD Million)
Table 27 Reaction Monitoring Market for Other End Users, By Region, 2015–2022 (USD Million)
Table 28 Market, By Region, 2015–2022 (USD Million)
Table 29 North America: Reaction Monitoring Market, By Country, 2015–2022 (USD Million)
Table 30 North America: Market, By Technology, 2015–2022 (USD Million)
Table 31 North America: Market, By Spectroscopy Type, 2015–2022 (USD Million)
Table 32 North America: Market for Reaction Monitoring, By Chromatography Type , 2015–2022 (USD Million)
Table 33 North America: Market, By End User, 2015–2022 (USD Million)
Table 34 North America: Market for Reaction Monitoring, By Reaction Mode, 2015–2022 (USD Million)
Table 35 US: Reaction Monitoring Market, By Technology, 2015–2022 (USD Million)
Table 36 Canada: Market, By Technology, 2015–2022 (USD Million)
Table 37 Europe: Reaction Monitoring Market, By Country, 2015–2022 (USD Million)
Table 38 Europe: Market, By Technology, 2015–2022 (USD Million)
Table 39 Europe: Market, By Spectroscopy Type, 2015–2022 (USD Million)
Table 40 Europe: Market, By Chromatography Type, 2015–2022 (USD Million)
Table 41 Europe: Market, By End User, 2015–2022 (USD Million)
Table 42 Europe: Market , By Reaction Mode, 2015–2022 (USD Million)
Table 43 Germany: Reaction Monitoring Market, By Technology, 2015–2022 (USD Million)
Table 44 UK: Market for Reaction Monitoring, By Technology, 2015–2022 (USD Million)
Table 45 France: Market, By Technology, 2015–2022 (USD Million)
Table 46 RoE: Market for Reaction Monitoring, By Technology, 2015–2022 (USD Million)
Table 47 Asia Pacific: Market, By Country, 2015–2022 (USD Million)
Table 48 Asia Pacific: Market, By Technology, 2015–2022 (USD Million)
Table 49 Asia Pacific: Market, By Spectroscopy Type, 2015–2022 (USD Million)
Table 50 Asia Pacific: Market, By Chromatography Type, 2015–2022 (USD Million)
Table 51 Asia Pacific: Market, By End User, 2015–2022 (USD Million)
Table 52 Asia Pacific: Market, By Reaction Mode, 2015–2022 (USD Million)
Table 53 Japan: Reaction Monitoring Market, By Technology, 2015–2022 (USD Million)
Table 54 China: Market for Reaction Monitoring, By Technology, 2015–2022 (USD Million)
Table 55 India: Market, By Technology, 2015–2022 (USD Million)
Table 56 RoAPAC: Market for Reaction Monitoring, By Technology, 2015–2022 (USD Million)
Table 57 RoW: Reaction Monitoring Market, By Technology, 2015–2022 (USD Million)
Table 58 RoW: Market, By Spectroscopy Type, 2015–2022 (USD Million)
Table 59 RoW: Market, By Chromatography Type, 2015–2022 (USD Million)
Table 60 RoW: Market, By End User, 2015–2022 (USD Million)
Table 61 RoW: Market, By Reaction Mode, 2015–2022 (USD Million)
Table 62 Global Market for Reaction Monitoring: Ranking, By Key Player, 2016
List of Figures (36 Figures)
Figure 1 Global Reaction Monitoring Market: Research Methodology Steps
Figure 2 Research Design
Figure 3 Breakdown of Primaries: Market
Figure 4 Bottom-Up Approach: Market
Figure 5 Top-Down Approach: Market
Figure 6 Data Triangulation Methodology: Reaction Monitoring Market
Figure 7 Global Market, By Technology (2017)
Figure 8 Global Market, By Reaction Mode (2017)
Figure 9 Global Market for Reaction Monitoring, By End User (2017-2022)
Figure 10 North America to Account for the Largest Share in 2017
Figure 11 Increasing Public-Private Investments in Life Science Research to Drive the Market Growth During 2017-2022
Figure 12 Mass Spectroscopy Segment Will Continue to Dominate the Market Till 2022
Figure 13 Spectroscopy to Dominate the Asia Pacific Market in 2017
Figure 14 The Quantitative Segment to Dominate the Market During the Forecast Period
Figure 15 The Pharmaceutical, Biopharmaceutical, and Biotechnology Companies Segment to Dominate the Market During 2017-2022
Figure 16 Asia Pacific to Register the Highest CAGR During the Forecast Period
Figure 17 Reaction Monitoring Market: Drivers, Restraints, Opportunities, and Challenges
Figure 18 Spectroscopy Segment to Witness the Highest Growth in the Market During the Forecast Period
Figure 19 Quantitative Monitoring Segment to Witness the Highest Growth Rate During the Forecast Period
Figure 20 Pharmaceutical, Biopharmaceutical, and Biotechnology Companies Segment to Register the Highest Growth Rate in the Global Market During the Forecast Period
Figure 21 North America: Market Snapshot (2017–2022)
Figure 22 Europe: Market Snapshot (2017–2022)
Figure 23 Asia Pacific: Market Snapshot (2017–2022)
Figure 24 Thermo Fisher Scientific: Company Snapshot
Figure 25 Agilent Technologies: Company Snapshot
Figure 26 Danaher: Company Snapshot
Figure 27 Perkinelmer: Company Snapshot
Figure 28 Shimadzu: Company Snapshot
Figure 29 Bio-Rad Laboratories: Company Snapshot
Figure 30 Waters: Company Snapshot
Figure 31 Hitachi High-Technologies: Company Snapshot
Figure 32 Merck: Company Snapshot
Figure 33 Bruker: Company Snapshot
Figure 34 ABB: Company Snapshot
Figure 35 Mettler-Toledo International: Company Snapshot
Figure 36 Horiba: Company Snapshot

 Generating Response ...


Growth opportunities and latent adjacency in Reaction Monitoring Market