Rheometer and Viscometer Market by Product (Dynamic & Torque Rotation, Oscillatory, Capillary Rheometer, Rotation, Process, Capillary Viscometer), Sample (Resin, Coating, Suspension), End User (Petroleum, Pharma Co, Chemical, Academia) - Global Forecasts to 2023


The global rheometer and viscometer market is projected to reach USD 878.6 million by 2023, at a CAGR of 4.0%.
Years Considered for the Study
- Base Year: 2017
- Forecast Period: 2018–2023
Objectives of the Study
- To define, describe, and forecast the global viscometer market by product, sample type, end user, and region
- To provide detailed information about the major factors influencing market growth (key drivers, restraints, opportunities, and industry-specific challenges)
- To strategically analyze micromarkets with respect to individual growth trends, prospects, and their contributions to the global viscometer market
- To analyze market opportunities for stakeholders and provide details of the competitive landscape for key global players
- To forecast the size of the market segments with respect to four main regions, namely, North America (US and Canada), Europe [Germany, France, the UK, and Rest of Europe (RoE)], Asia Pacific [China, India, Japan, and Rest of Asia Pacific (RoAPAC)], and the Rest of the World (RoW)
- To profile the key players active in the global rheometers and viscometers industry and comprehensively analyze their global revenue shares and core competencies
- To track and analyze competitive market-specific developments such as product developments & commercialization, strategic mergers, market expansions, as well as agreements in the global rheometers and viscometers industry
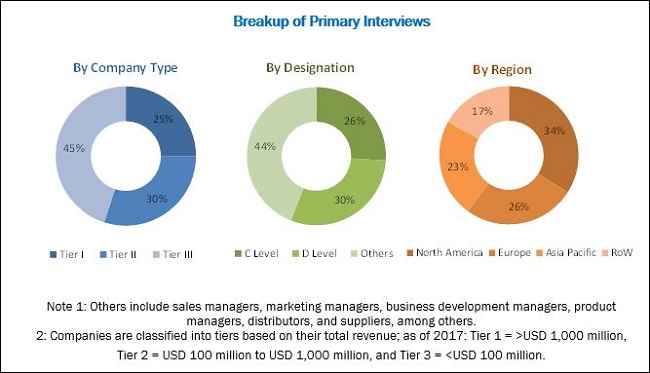
This research study involves the extensive usage of secondary sources, directories, and databases [such as World Health Organization (WHO), Organisation for Economic Co-operation and Development (OECD), World Bank, the European Chemical Industry Council, US Energy Information Administration, US Department of Energy, American Chemistry Council, US Census Bureau, Federal Ministry of Economic Affairs and Energy (Germany), Department of Petroleum Engineering and Applied Geophysics (Germany), Medicines & Healthcare Products Regulatory Agency (UK), and Food & Drink Sector Council (UK)], in order to identify and collect information useful for this technical, market-oriented, and financial study of the rheometer and viscometer market. In-depth interviews were conducted with various primary respondents, including subject-matter experts (SMEs), C-level executives of key market players, and industry consultants to obtain and verify qualitative and quantitative information and to assess market prospects.
To know about the assumptions considered for the study, download the pdf brochure
As of 2017, the global rheometers market was dominated by Anton Paar (Austria), Spectris (UK), and Waters Corporation (US), whereas, the global viscometers market was dominated by Brookfield Engineering Laboratories (US), Anton Paar (Austria), and Waters Corporation (US). In the past three years, these companies adopted product developments & commercialization, market expansions, mergers, and agreements as their key business strategies to ensure market dominance. Cannon Instruments Company (US), Thermo Fisher Scientific (US), Emerson (US), BARTEC (Germany), and GBC Scientific Equipment (Australia) are some of the other major players in this market.
Stakeholders
- Rheometer and viscometer manufacturing companies
- Pharmaceutical, biotechnology, and cosmeceutical companies
- Petroleum manufacturers and petrochemical refineries
- Food processing companies and beverage manufacturers
- Chemical and material manufacturers
- Environmental testing, food testing, and forensic analysis laboratories
- Product sales and distribution companies
- Research and development companies
- Research laboratories and academic institutes
- Clinical research organizations (CROs)
- Government and non-governmental regulatory authorities
- Independent national and international associations
- Diagnostic and forensic testing laboratories
- Market research and consulting firms
Rheometer and Viscometer Market Scope
This report categorizes the global rheometer and viscometer market into the following segments and subsegments:
By Product
-
Viscometers
- Rotational Viscometers
- Process Viscometers
- Capillary Viscometers
- Other Viscometers
-
Rheometers
- Torque Rotational Rheometers
- Dynamic Rotational Rheometers
- Capillary Rheometers
- Oscillatory Rheometers
- High-throughput Rheometers
- Other Rheometers
By Sample Type
- Resins and Coatings
- Suspensions and Slurries
- Pastes and Gels
- Other Samples
By End User
- Petroleum Product Manufacturers and Petrochemical Refineries
- Pharmaceutical, Cosmeceutical, and Biotechnology Companies
- Chemical and Material Manufacturers
- Food and Beverage Manufacturers
- Research Laboratories and Academic Institutes
- Other End Users
By Region
-
North America
- US
- Canada
-
Europe
- Germany
- France
- UK
- RoE
-
Asia Pacific
- Japan
- China
- India
- RoAPAC
- Rest of the World (RoW)
Available Customizations
With the given market data, MarketsandMarkets offers customizations as per the company’s specific needs. The following customization options are available for the global viscometer market report:
Product Analysis
- Product Matrix, which gives a detailed comparison of the product portfolios of the top five global players
Geographical Analysis
- Further breakdown of the Rest of Europe viscometer market into Italy, Spain, Greece, and other countries
- Further breakdown of the RoW viscometer market into the Middle East, Latin America, and Africa
Company Information
- Detailed analysis and profiling of additional global players (Up to 5 OEMs)
The global rheometer and viscometer market is projected to reach USD 878.6 million by 2023 from USD 721.5 million in 2018, at a CAGR of 4.0%. The demand for rheometers and viscometers across key markets is majorly driven by factors such as technology advancements; expansion of petrochemical and material manufacturing industries; growing stringency of the regulatory framework for product safety compliance in cosmeceutical, biotechnology, and pharmaceutical industries; rising public-private investments to support product innovation; and increasing burden of target diseases, globally.
This report broadly segments the rheometer and viscometer market into product, sample type, end user, and region. On the basis of product, the viscometer market is segmented into rheometers and viscometers. The viscometers segment is expected to account for the largest share of the global rheometer market in 2018. The large share of this segment is attributed to the increasing adoption of viscometers among lab technicians and researchers in pharmaceutical and petrochemical industries due to the procedural benefits offered by these instruments, such as the capability to analyze samples in varied environments, high accuracy, versatility for analyzing different samples, ease of handling, fast processing time, device portability, need of small sample volume, capability to analyze time-dependent fluids, and capability to perform shear-dependent analysis at various speeds.
Based on sample type, the market is categorized into resins & coatings, suspensions & slurries, pastes & gels, and other samples. The resins & coatings segment is expected to be the fastest-growing sample segment during the forecast period. The dominant market position of this segment is mainly due to the growing adoption of rheometers & viscometers by paint and coating manufacturers; the increasing production of paints, coatings, binders, solvents, pigments, fillers and additives; increasing usage of rheometers and viscometers among petrochemical manufacturers; and growing availability of innovative and affordable devices across emerging countries.
On the basis of end user, the viscometer market is segmented into petroleum product manufacturers & petrochemical refineries; pharmaceutical, cosmeceutical, and biotechnology companies; chemical and material manufacturers; food and beverage manufacturers; and research & academia, and other end users. The petroleum product manufacturers & petrochemical refineries segment is expected to account for the highest growth rate of the rheometer and viscometer market during the forecast period. The high growth can be attributed to the rising production output & capabilities of major product manufacturers.
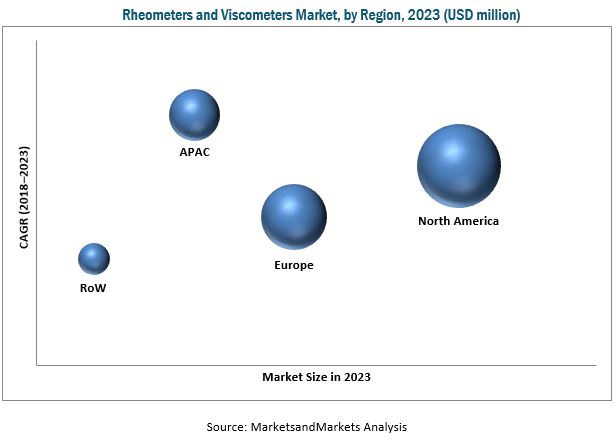
This report covers the market across four major regions, namely, North America, Europe, the Asia Pacific, and the RoW. North America is expected to command the largest share of the market in 2018. Dominant position of North America in the global viscometer market is attributed to the ongoing technological advancements in the field of rheometers and viscometers, growing number of disease diagnostic procedures based on viscosity/rheology analysis, strong presence of major device manufacturers, and the wide availability of rheometers and viscometers in the region (owing to the strong distribution networks of major product manufacturers in North America).
Factors such as high cost of rheometers & viscometers and lack of availability of well-skilled technicians to operate rheometers & viscometers are expected to restrain the growth of the market during the forecast period.
The major players in the market are Brookfield Engineering Laboratories (US), Anton Paar (Austria), Spectris (UK), Waters Corporation (US), and Cannon Instrument Company.
Frequently Asked Questions (FAQ):
How big is the Rheometer & Viscometer Market ?
Rheometer & Viscometer Market worth $3878.6 million by 2023.
What is the growth rate of Rheometer & Viscometer Market ?
Rheometer & Viscometer Market grows at a CAGR of 4.0% during the forecast period. .
To speak to our analyst for a discussion on the above findings, click Speak to Analyst
 Exclusive indicates content/data unique to MarketsandMarkets and not available with any competitors.
Table of Contents
1 Introduction (Page No. - 17)
1.1 Objectives of the Study
1.2 Market Definition
1.3 Market Scope
1.3.1 Markets Covered
1.3.2 Geographic Scope
1.3.3 Years Considered for the Study
1.4 Currency Used for the Study
1.5 Major Market Stakeholders
2 Research Methodology (Page No. - 21)
2.1 Research Data
2.1.1 Secondary Data
2.1.2 Primary Data
2.2 Market Estimation Methodology
2.2.1 End-User Based Market Estimation
2.2.2 Revenue Mapping-Based Market Estimation
2.2.3 Primary Research Validation
2.3 Market Breakdown and Data Triangulation
2.4 Research Assumptions
2.5 Research Limitations
3 Executive Summary (Page No. - 29)
4 Premium Insights (Page No. - 36)
4.1 Global Rheometer and Viscometer Market: Overview
4.2 Global Rheometer Market, By Type, 2018 vs 2023 (USD Million)
4.3 Global ViscometersMarket, By Type, 2018 vs 2023 (USD Million)
4.4 Global Rheometer and Viscometer Market, By Sample Type, 2018 vs 2023 (USD Million)
4.5 Global Rheometers and Viscometers Market, By End User, 2018
4.6 Global Viscometer Market, By Country, 2018
5 Market Overview (Page No. - 42)
5.1 Introduction
5.2 Market Dynamics
5.2.1 Major Drivers
5.2.1.1 Technological Advancements in Rheometers and Viscometers
5.2.1.2 Expansion of Petrochemical and Material Manufacturing Industries
5.2.1.3 Increasing Stringency of the Regulatory Framework for Product Safety Compliance in Cosmeceutical and Pharma-Biotech Industries
5.2.1.4 Growing Public-Private Investments to Support Product Innovation in End-Use Industries
5.2.1.5 Rising Global Burden of Target Diseases
5.2.2 Key Restraints
5.2.2.1 High Cost of Advanced Rheometer and Viscometer Platforms
5.2.3 Major Growth Opportunities
5.2.3.1 Growing Public Emphasis on the Implementation of Stringent Food Safety Regulations
5.2.3.2 Increasing Awareness About the Growing Industrial Applications of Viscometers and Rheometers Among End Users
5.2.3.3 Emerging Markets
5.2.4 Key Industry Challenge
5.2.4.1 Limited Availability of Well-Skilled Technicians for Instrument Operation
6 Viscometer Market, By Product (Page No. - 51)
6.1 Introduction
6.2 Viscometers
6.2.1 Rotational Viscometers
6.2.2 Process Viscometers
6.2.3 Capillary Viscometers
6.2.4 Other Viscometers
6.3 Rheometers
6.3.1 Torque Rotational Rheometers
6.3.2 Dynamic Rotational Rheometers
6.3.3 Capillary Rheometers
6.3.4 Oscillatory Rheometers
6.3.5 High-Throughput Rheometers
6.3.6 Other Rheometers
7 Viscometer Market, By Sample Type (Page No. - 79)
7.1 Introduction
7.2 Resins & Coatings
7.3 Suspensions & Slurries
7.4 Pastes & Gels
7.5 Other Samples
8 Viscometer Market, By End User (Page No. - 86)
8.1 Introduction
8.2 Petroleum Product Manufacturers and Petrochemical Refineries
8.3 Pharmaceutical, Cosmeceutical, and Biotechnology Companies
8.4 Chemical and Material Manufacturers
8.5 Food and Beverage Manufacturers
8.6 Research Laboratories and Academic Institutes
8.7 Other End Users
9 Viscometer Market, By Region (Page No. - 95)
9.1 Introduction
9.2 North America
9.2.1 US
9.2.2 Canada
9.3 Europe
9.3.1 Germany
9.3.2 UK
9.3.3 France
9.3.4 Rest of Europe
9.4 Asia Pacific
9.4.1 Japan
9.4.2 China
9.4.3 India
9.4.4 Rest of Asia Pacific
9.5 Rest of the World
10 Competitive Landscape (Page No. - 133)
10.1 Overview
10.2 Global Market Share Analysis (2017)
10.3 Global Competitive Scenario (2014-2018)
10.3.1 Key Product Launches and Enhancements (2014-2018)
10.3.2 Key Expansions (2014-2018)
10.3.3 Major Agreement (2014-2018)
10.3.4 Major Merger (2014-2018)
11 Company Profiles (Page No. - 137)
(Business Overview, Products Offered, Recent Developments, MnM View)*
11.1 Introduction
11.2 Anton Paar
11.3 Bartec Group
11.4 Brookfield Engineering Laboratories (A Subsidiary of Ametek Inc.)
11.5 Cannon Instrument Company
11.6 Dynisco
11.7 Emerson
11.8 GBC Scientific Equipment Pty Ltd
11.9 Goettfert
11.10 Hydramotion
11.11 Lamy Rheology Instruments
11.12 Petroleum Analyzer Company LP (PAC LP)
11.13 Shimadzu Corporation
11.14 Spectris
11.15 Thermo Fisher Scientific
11.16 Waters Corporation
*Business Overview, Products Offered, Recent Developments, MnM View Might Not Be Captured in Case of Unlisted Companies.
12 Appendix (Page No. - 161)
12.1 Discussion Guide
12.2 Knowledge Store: Marketsandmarkets’ Subscription Portal
12.3 Available Customizations
12.4 Related Reports
12.5 Author Details
List of Tables (104 Tables)
Table 1 Rheometer and Viscometer Market, By Product, 2016–2023 (USD Million)
Table 2 Viscometers Market, By Type, 2016–2023 (USD Million)
Table 3 Viscometers Market, By Region, 2016–2023 (USD Million)
Table 4 Viscometers Market, By Sample Type, 2016–2023 (USD Million)
Table 5 Viscometers Market, By End User, 2016–2023 (USD Million)
Table 6 Rotational Viscometers Market, By Region, 2016–2023 (USD Million)
Table 7 Rotational Viscometers Market, By Sample Type, 2016–2023 (USD Million)
Table 8 Rotational Viscometers Market, By End User, 2016–2023 (USD Million)
Table 9 Process Viscometers Market, By Region, 2016–2023 (USD Million)
Table 10 Process Viscometers Market, By Sample Type, 2016–2023 (USD Million)
Table 11 Process Viscometers Market, By End User, 2016–2023 (USD Million)
Table 12 Capillary Viscometers Market, By Region, 2016–2023 (USD Million)
Table 13 Capillary Viscometers Market, By Sample Type, 2016–2023 (USD Million)
Table 14 Capillary Viscometers Market, By End User, 2016–2023 (USD Million)
Table 15 Other Viscometers Market, By Region, 2016–2023 (USD Million)
Table 16 Other Viscometers Market, By Sample Type, 2016–2023 (USD Million)
Table 17 Other Viscometers Market, By End User, 2016–2023 (USD Million)
Table 18 Rheometers Market, By Type, 2016–2023 (USD Million)
Table 19 Rheometers Market, By Region, 2016–2023 (USD Million)
Table 20 Rheometers Market, By Sample Type, 2016–2023 (USD Million)
Table 21 Rheometers Market, By End User, 2016–2023 (USD Million)
Table 22 Torque Rotational Rheometers Market, By Region, 2016–2023 (USD Million)
Table 23 Torque Rotational Rheometers Market, By Sample Type, 2016–2023 (USD Million)
Table 24 Torque Rotational Rheometers Market, By End User, 2016–2023 (USD Million)
Table 25 Dynamic Rotational Rheometers Market, By Region, 2016–2023 (USD Million)
Table 26 Dynamic Rotational Rheometers Market, By Sample Type, 2016–2023 (USD Million)
Table 27 Dynamic Rotational Rheometers Market, By End User, 2016–2023 (USD Million)
Table 28 Capillary Rheometers Market, By Region, 2016–2023 (USD Million)
Table 29 Capillary Rheometers Market, By Sample Type, 2016–2023 (USD Million)
Table 30 Capillary Rheometers Market, By End User, 2016–2023 (USD Million)
Table 31 Oscillatory Rheometers Market, By Region, 2016–2023 (USD Million)
Table 32 Oscillatory Rheometers Market, By Sample Type, 2016–2023 (USD Million)
Table 33 Oscillatory Rheometers Market, By End User, 2016–2023 (USD Million)
Table 34 High-Throughput Rheometers Market, By Region, 2016–2023 (USD Million)
Table 35 High-Throughput Rheometers Market, By Sample Type, 2016–2023 (USD Million)
Table 36 High-Throughput Rheometers Market, By End User, 2016–2023 (USD Million)
Table 37 Other Rheometers Market, By Region, 2016–2023 (USD Million)
Table 38 Other Rheometers Market, By Sample Type, 2016–2023 (USD Million)
Table 39 Other Rheometers Market, By End User, 2016–2023 (USD Million)
Table 40 Rheometer and Viscometer Market, By Sample Type, 2016–2023 (USD Million)
Table 41 Viscometer Market for Resins & Coatings, By Region, 2016–2023 (USD Million)
Table 42 Rheometer and Viscometer Market for Suspensions & Slurries, By Region, 2016–2023 (USD Million)
Table 43 Viscometer Market for Pastes & Gels, By Region, 2016–2023 (USD Million)
Table 44 Market for Other Samples, By Region, 2016–2023 (USD Million)
Table 45 Market, By End User, 2016–2023 (USD Million)
Table 46 Market for Petroleum Product Manufacturers and Petroleum Refineries, By Region, 2016-2023 (USD Million)
Table 47 Market for Pharmaceutical, Cosmeceutical, and Biotechnology Companies, By Region, 2016-2023 (USD Million)
Table 48 Rheometer and Viscometer Market for Chemical and Material Manufacturers, By Region, 2016-2023 (USD Million)
Table 49 Viscometer Market for Food and Beverage Manufacturers, By Region, 2016-2023 (USD Million)
Table 50 Rheometer Market for Research Laboratories and Academic Institutes, By Region, 2016-2023 (USD Million)
Table 51 Rheometer and Viscometer Market for Other End Users, By Region, 2016-2023 (USD Million)
Table 52 Viscometer Market, By Region, 2016–2023 (USD Million)
Table 53 Rheometers and Viscometers Market, By Region, 2016–2023 (USD Million)
Table 54 Rheometers Market, By Region, 2016–2023 (USD Million)
Table 55 Viscometers Market, By Region, 2016–2023 (USD Million)
Table 56 North America: Rheometers and Viscometers Market, By Country, 2016–2023 (USD Million)
Table 57 North America: Rheometers Market, By Type, 2016–2023 (USD Million)
Table 58 North America: Viscometers Market, By Type, 2016–2023 (USD Million)
Table 59 North America: Rheometers and Viscometers Market, By Sample Type, 2016–2023 (USD Million)
Table 60 North America: Rheometer and Viscometer Market, By End User, 2016–2023 (USD Million)
Table 61 US: Viscometer Market, By Product, 2016–2023 (USD Million)
Table 62 US: Rheometers Market, By Type, 2016–2023 (USD Million)
Table 63 US: Viscometers Market, By Type, 2016–2023 (USD Million)
Table 64 Canada: Rheometer and Viscometer Market, By Product, 2016–2023 (USD Million)
Table 65 Canada: Rheometers Market, By Type, 2016–2023 (USD Million)
Table 66 Canada: Viscometers Market, By Type, 2016–2023 (USD Million)
Table 67 Europe: Viscometer Market, By Country, 2016–2023 (USD Million)
Table 68 Europe: Rheometers Market, By Type, 2016–2023 (USD Million)
Table 69 Europe: Viscometers Market, By Type, 2016–2023 (USD Million)
Table 70 Europe: Rheometers and Viscometers Market, By Sample Type, 2016–2023 (USD Million)
Table 71 Europe: Market, By End User, 2016–2023 (USD Million)
Table 72 Germany: Market, By Product, 2016–2023 (USD Million)
Table 73 Germany: Rheometers Market, By Type, 2016–2023 (USD Million)
Table 74 Germany: Viscometers Market, By Type, 2016–2023 (USD Million)
Table 75 UK: Rheometers and Viscometers Market, By Product, 2016–2023 (USD Million)
Table 76 UK: Rheometers Market, By Type, 2016–2023 (USD Million)
Table 77 UK: Viscometers Market, By Type, 2016–2023 (USD Million)
Table 78 France: Market, By Product, 2016–2023 (USD Million)
Table 79 France: Rheometers Market, By Type, 2016–2023 (USD Million)
Table 80 France: Viscometers Market, By Type, 2016–2023 (USD Million)
Table 81 RoE: Rheometer and Viscometer Market, By Product, 2016–2023 (USD Million)
Table 82 RoE: Rheometers Market, By Type, 2016–2023 (USD Million)
Table 83 RoE: Viscometers Market, By Type, 2016–2023 (USD Million)
Table 84 Asia Pacific: Rheometers and Viscometers Market, By Country, 2016–2023 (USD Million)
Table 85 Asia Pacific: Rheometers Market, By Type, 2016–2023 (USD Million)
Table 86 Asia Pacific: Viscometers Market, By Type, 2016–2023 (USD Million)
Table 87 Asia Pacific: Viscometer Market, By Sample Type, 2016–2023 (USD Million)
Table 88 Asia Pacific: Rheometers and Viscometers Market, By End User, 2016–2023 (USD Million)
Table 89 Japan: Rheometers and Viscometers Market, By Product, 2016–2023 (USD Million)
Table 90 Japan: Rheometers Market, By Type, 2016–2023 (USD Million)
Table 91 Japan: Viscometers Market, By Type, 2016–2023 (USD Million)
Table 92 China: Rheometer and Viscometer Market, By Product, 2016–2023 (USD Million)
Table 93 China: Rheometers Market, By Type, 2016–2023 (USD Million)
Table 94 China: Viscometers Market, By Type, 2016–2023 (USD Million)
Table 95 India: Viscometer Market, By Product, 2016–2023 (USD Million)
Table 96 India: Rheometers Market, By Type, 2016–2023 (USD Million)
Table 97 India: Viscometers Market, By Type, 2016–2023 (USD Million)
Table 98 RoAPAC: Rheometers and Viscometers Market, By Product, 2016–2023 (USD Million)
Table 99 RoAPAC: Rheometers Market, By Type, 2016–2023 (USD Million)
Table 100 RoAPAC: Viscometers Market, By Type, 2016–2023 (USD Million)
Table 101 RoW: Rheometers Market, By Type, 2016–2023 (USD Million)
Table 102 RoW: Viscometers Market, By Type, 2016–2023 (USD Million)
Table 103 RoW: Rheometer and Viscometer Market, By Sample Type, 2016–2023 (USD Million)
Table 104 RoW: Viscometer Market, By End User, 2016–2023 (USD Million)
List of Figures (36 Figures)
Figure 1 Research Design
Figure 2 Breakdown of Primaries: Global Rheometers and Viscometers Market
Figure 3 Market Size Estimation: Rheometer and Viscometer Market
Figure 4 Market Breakdown and Data Triangulation Methodology
Figure 5 Viscometers Segment to Account for the Larger Market Share Compared to Rheometers Till 2023
Figure 6 Rotational Viscometers Will Continue to Dominate the Global Viscometers Market Till 2023
Figure 7 Torque Rotational Rheometers Will Continue to Dominate the Global Rheometers Market Till 2023
Figure 8 Resins and Coatings Segment to Account for the Largest Share of the Market in 2018
Figure 9 Petroleum Product Manufacturers and Petrochemical Refineries Segment to Account for the Largest Share of the Market in 2018
Figure 10 Geographic Snapshot: Rheometers and Viscometers Market
Figure 11 Increasing Production of Petrochemicals and Pharmaceuticals to Drive the Demand for Rheometers and Viscometers Till 2023
Figure 12 Torque & Dynamic Rotational Rheometers to Dominate the Rheometers Market During the Forecast Period
Figure 13 Rotational Viscometers Segment to Dominate the Viscometers Market During the Forecast Period
Figure 14 Asia-Pacific to Drive Device Adoption Across All Sample Categories Globally
Figure 15 Petroleum Product Manufacturers & Petrochemical Refineries Will Dominate the Market in 2018
Figure 16 China and India is Estimated to Be the Fastest-Growing Market for Rheometers and Viscometers
Figure 17 Rheometers and Viscometers Market: Drivers, Restraints, Opportunities, and Challenges
Figure 18 Novartis Dominated the Global Pharma-Biotech Industry With the Highest Research Investments in 2016
Figure 19 Saudi Arabia and Russia Dominated Global Crude Oil Production as of 2016
Figure 20 Viscometers Will Continue to Dominate the Rheometers and Viscometers Market in 2023
Figure 21 Rotational Viscometers to Dominate the Viscometers Market During the Forecast Period
Figure 22 Torque Rotational Rheometers to Dominate the Rheometers Market in 2018
Figure 23 Resins & Coatings to Dominate the Global Rheometer and Viscometer Market as of 2018
Figure 24 Petroleum Product Manufacturers and Petrochemical Refineries; the Fastest-Growing End Users for Rheometers & Viscometers
Figure 25 North America: Viscometer Market Snapshot
Figure 26 Europe: Rheometers and Viscometers Market Snapshot
Figure 27 Asia Pacific: Rheometer and Viscometer Market Snapshot
Figure 28 RoW: Rheometers and Viscometers Market Snapshot
Figure 29 Key Developments in the Rheometer and Viscometer Market During 2014 to 2018
Figure 30 Brookfield Engineering Laboratories Lead the Global Viscometers Market as of 2017
Figure 31 Anton Paar to Lead the Global Rheometers Market as of 2017
Figure 32 Emerson: Company Snapshot (2017)
Figure 33 Shimadzu Corporation: Company Snapshot (2017)
Figure 34 Spectris: Company Snapshot (2017)
Figure 35 Thermo Fisher Scientific: Company Snapshot (2017)
Figure 36 Waters Corporation: Company Snapshot (2017)

 Generating Response ...


Growth opportunities and latent adjacency in Rheometer and Viscometer Market