Robotic Refueling System Market by Fuel Pumped (Gasoline, Natural Gas, Petrochemicals), Payload-carrying Capacity (Up to 50 kg, 50�100 kg, 100�150 kg), Vertical (Automotive, Mining, Oil & Gas, Aerospace,) and Geography - Global forecast 2030


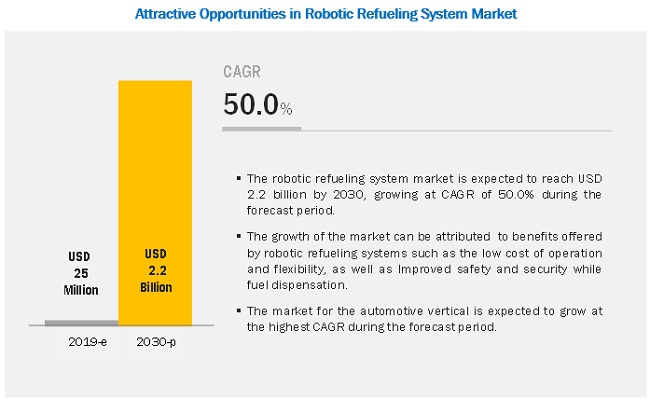
The robotic refueling system market is expected to grow from USD 25 million in 2019 to USD 2.2 billion by 2030, at a CAGR of 50.0% during forecast period.Growing requirement for low-cost operations in the mining vertical and the need for improved security and safety, while fuel dispensation are the key factors driving the growth of the market. One of the major restraints for the growth of the market is the legal and safety regulations. Increasing adoption of autonomous technology is the key opportunity for the growth of the robotic refueling system market. A major challenge faced by the key players in the market is the replacement of manual caps with automated fuel caps.
Market for robotic refueling systems pumping gasoline is expected to hold largest share in 2019
The market for robotic refueling systems used for pumping gasoline is expected to hold the largest share in 2019. The growing adoption of autonomous haulage trucks in the mining vertical, where gasoline is used as a primary fuel is expected to drive the market for robotic refueling systems during the forecast period
Market for robotic refueling systems with payload-carrying capacity of 100�150 kg to grow at highest CAGR during forecast period
Verticals such as mining, automotive, aerospace, military & defense, and warehouse & logistics require robotic refueling systems with a wide range of payload capacity depending upon the type of fuel being pumped and the application of these systems in each region. The growing demand for automation, electric/hybrid vehicles and the increasing adoption of cost-effective onsite refueling stations for mining haulage trucks worldwide are the key factors driving the growth of the market for robotic refueling systems with the payload-carrying capacity of 100�150 Kg.
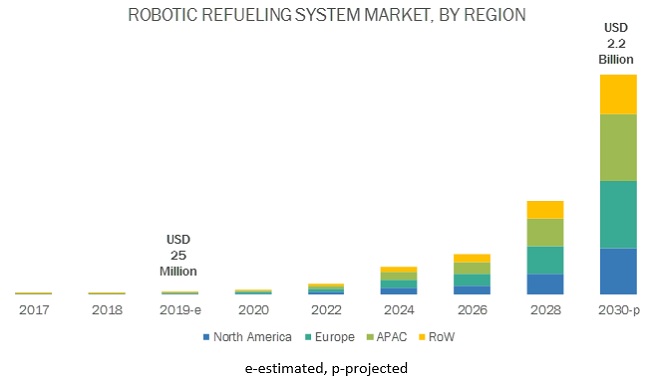
Market in APAC is expected to grow at significant rate during forecast period
APAC is expected to grow at the highest CAGR during the forecast period. Rapid technological developments and increased adoption of automation in the automotive industry are the key factors driving the growth of the market in APAC. Chinese industries and the government have recognized the continuous increase in the demand for automation. China is the world's largest automotive manufacturer and a leading producer of coal, as conventional coal-based power plants still meet most of the energy needs of the country, thereby providing a huge market opportunity for robotic refueling systems in the mining vertical in China.
Key Market Players
Scott Technology (Scott Technology Ltd(New Zealand)), Fuelmatics AB (Sweden), Rotec Engineering B.V (Netherlands), Neste Oyj (Finland), Shaw development LLC (Shaw Development (US)), PLUG POWER Inc. (Power and Plug (US)), Aerobotix (US), Airbus S.A.S(Netherlands), The Boeing Company (Boeing (US)), ABB Group (Switzerland), KUKA (Germany), Simon Group Holding (US), FANUC Corporation (JAPAN), AUTOFUEL AB (Sweden), TATSUNO Corporation (Japan), CZECH INNOVATION GROUP (Czech Republic), Mine Energy Group Pty Ltd. (Australia), Husky Corporation (US), GAZPROMNEFT-AERO (Russia) and Green Fueling Inc. (US) are a few of the major companies dominating the robotic refueling system market.
Scott Technology Ltd. (New Zealand) is one of the rapidly growing organizations. The company specializes in designing and manufacturing robotics and process machinery and providing automated production facilities globally. Scott Technology Ltd. has its manufacturing facilities in New Zealand, Australia, the USA, Germany, and China supplying equipment in over 75 countries. Scott Technology Ltd. is one of the rapidly growing organizations. It has adopted organic and inorganic growth strategies to become a global enterprise. In 2018, the company announced the acquisition of Alvey Group (Belgium) and Transrobotics Corporation (US). In April 2018, RobotWorx, a division of Scott Technology, expanded its business operations in the Australian robotic market.
Fuelmatics AB (Sweden) is one of the fastest growing organizations in the robotic refueling system market. The company mostly adopted organic growth strategies through the introduction of technologically advanced and innovative product lines. For instance, in June 2018, Fuelmatics received its first order for its Fuelmatics 5000 units from the US-based oil company with a network of fuel stations across various states of the US. The new Fuelmatics 5000 is an improved system with smartphone payment capability, compact design, and higher operating speed. The company has dedicated research and development facilities for designing and development of innovative technologies. The company has offices and operational facilities in Europe and North America.
ROTEC Engineering B.V. (Netherlands) is one of the pioneers in robotic refueling system manufacturing. It provides a few of the most advanced robotic refueling systems for the mining sector across the world. The company has mainly adopted business strategies such as greater geographic reach and increased industry coverage to expand its business worldwide. It has state-of-the-art innovation centers for the development and designing of technologically advanced and innovative products. The company offers its autonomous systems through ROTEC Special Projects B.V for the agriculture, automotive, and mining industries
Scope of the Report:
|
Report Metric |
Details |
|
Market size available for years |
2016�2030 |
|
Base year |
2018 |
|
Forecast period |
2019�2030 |
|
Units |
Value (USD) and volume (units) |
|
Segments covered |
by fuel pumped, payload-carrying capacity, vertical, and region |
|
Geographic regions covered |
North America, APAC, Europe, and RoW |
|
Companies covered |
Scott Technology (Scott Technology Ltd(New Zealand)), Fuelmatics AB (Sweden), Rotec Engineering B.V (Netherlands), Neste Oyj (Finland), Shaw development LLC (Shaw Development (US)), PLUG POWER Inc. (Power and Plug (US)), Aerobotix (US), Airbus S.A.S(Netherlands), The Boeing Company (Boeing (US)), ABB Group (Switzerland), KUKA (Germany), Simon Group Holding (US), FANUC Corporation (JAPAN), AUTOFUEL AB (Sweden), TATSUNO Corporation (Japan), CZECH INNOVATION GROUP (Czech Republic), Mine Energy Group Pty Ltd. (Australia), Husky Corporation (US), GAZPROMNEFT-AERO (Russia) and Green Fueling Inc. (US) |
This report categorizes the robotic refueling system market based on fuel pumped, payload-carrying capacity, Vertical, and region.
Robotic refueling system market, by Fuel Pumped:
- Gasoline
- Natural Gas
- Petrochemicals
- Others (Includes hydrogen fuel cells, lithium-ion batteries, methanol, biofuel, and biodiesels)
Robotic refueling system market, by Payload-carrying Capacity:
- Up to 50 kg
- 50.01�100.00 kg
- 100.01�150.00 kg
Robotic refueling system market, by Vertical:
- Mining
- Automobile
- Oil & Gas
- Aerospace
- Military & Defense
- Warehouse & Logistics
- Marine & Shipping
- Construction
- Others (includes nuclear power plants, space exploration, and research& development)
Robotic refueling system market, by Region:
- North America
- US
- Canada
- Mexico
- Europe
- Germany
- France
- UK
- Rest of Europe
- APAC
- China
- Japan
- South Korea
- Rest of APAC
- RoW
- The Middle East & Africa
- South America
Key Questions Addressed in this Report
- How huge is the opportunity for the robotic refueling system market? How does the rising adoption in mining vertical help to grasp this opportunity of USD 2.3 million?
- Which are the recent industry trends that can be implemented to generate additional revenue streams?
- Who are the major players operating in this market? Which companies are the front runners?
- With the rise in demand for robotic refueling system machines from various end-user verticals, what are the opportunities for players now and for those planning to enter multiple stages of the value chain?
- There is increasing adoption of robotic refueling system machines in the mining, automotive, and aerospace verticals, how will this impact the growth rate of the overall market?
Frequently Asked Questions (FAQ):
Which are the key strategies adopted by leading companies in the Robotic Refueling Systems Market ?
The robotic refueling system market is competitive due to the presence of various well-established global market players. This segment studies the growth strategies adopted by the market players from 2017 to 2019. Players in this market adopted various strategies to expand their global presence and increase their market shares. Product launches and developments is one of the major strategy adopted by these players to grow in this market.
What are the emerging trends prevalent in this market?
Increasing adoption of autonomous technology is expected to create new opportunities across end use industry for the robotic refueling systems market.The market is expected to grow at CAGR 50.0% from 2019 to 2030.
What are the different verticals that are expected to drive the demand for robotic refueling systems during the forecast period?
Robotic refueling systems are adopted in the mining and automotive verticals for cost-effective refueling operations and provide safety while refueling. The mining vertical has been increasingly using automation systems for improving safety, time efficiency, and cost-effective operation.
Which application are expected to drive the growth of the market in the next 5 years?
Growing demand for the low cost of operation for mining-related applications and improved security and safety while fuel dispensation are the key factors driving the growth of the market which, in turn, will fuel the growth of the robotic refueling systems market during the forecast period.
Who are the leading vendors operating in this market?
Scott Technology (ScottTechnology Ltd(New Zealand)), Fuelmatics AB (Sweden), Rotec Engineering B.V (Netherlands), Neste Oyj(Finland), PLUG POWER Inc. (Power and Plug (US)), and AUTOFUEL AB (Sweden) are some of the major vendors
To speak to our analyst for a discussion on the above findings, click Speak to Analyst
 Exclusive indicates content/data unique to MarketsandMarkets and not available with any competitors.
Table of Contents
1 Introduction (Page No. - 15)
1.1 Study Objectives
1.2 Definition
1.3 Study Scope
1.3.1 Years Considered
1.4 Currency
1.5 Limitations
1.6 Package Size
1.7 Stakeholders
2 Research Methodology (Page No. - 18)
2.1 Research Data
2.1.1 Secondary Data
2.1.1.1 Key Data From Secondary Sources
2.1.2 Primary Data
2.1.2.1 Key Data From Primary Sources
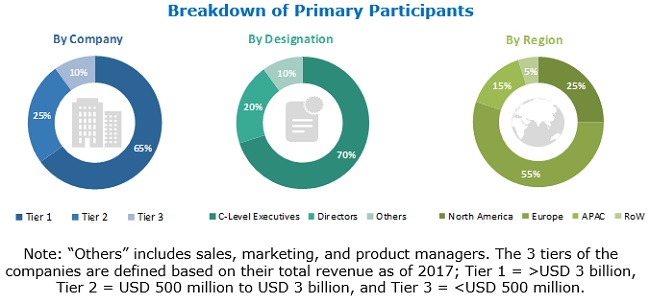
2.1.2.2 Breakdown of Primaries
2.1.3 Secondary and Primary Research
2.1.3.1 Key Industry Insights
2.2 Market Size Estimation
2.2.1 Bottom-Up Approach
2.2.2 Top-Down Approach
2.3 Market Breakdown and Data Triangulation
2.4 Research Assumptions
3 Executive Summary (Page No. - 26)
4 Premium Insights (Page No. - 29)
4.1 Attractive Market Opportunities in Robotic Refueling System Market
4.2 Robotic Refueling System Market, By Fuel Pumped
4.3 Robotic Refueling System Market, By Payload Capacity
4.4 Robotic Refueling System Market in APAC, Country vs Vertical
4.5 Robotic Refueling System Market, By Country
5 Market Overview (Page No. - 32)
5.1 Introduction
5.2 Market Dynamics
5.2.1 Drivers
5.2.1.1 Benefits Offered By Robotic Refueling Systems Such as Low Cost of Operation and Flexibility
5.2.1.2 Improved Security and Safety Offered By Robotic Refueling Systems While Fuel Dispensation
5.2.2 Restraints
5.2.2.1 Regulatory Policies to Ensure Data Safety
5.2.3 Opportunities
5.2.3.1 Increasing Adoption of Automation
5.2.4 Challenges
5.2.4.1 Replacement of Manual Fuel Caps With Automated Fuel Caps
5.3 Value Chain Analysis
5.4 use Cases: Robotic Refueling Systems Market
5.4.1 Refueling of Sea Vessels in Remote Locations
5.4.2 Refueling of Rotarty Wing Aircraft in Battlefields
5.4.3 Robotic Refueling of Satellites in Space
6 Robotic Refueling System Market, By Component (Page No. - 38)
6.1 Introduction
6.2 Hardware
6.2.1 Vehicle Positioning System
6.2.2 Control System
6.2.3 Robotic Arm
6.2.4 Fuel Dispensing System
6.2.5 Others
6.3 Software
7 Robotic Refueling System Market, By Fuel Pumped (Page No. - 41)
7.1 Introduction
7.2 Gasoline
7.2.1 Gasoline to Hold the Largest Share of the Market By Fuel Pumped During Forecast Period
7.3 Natural Gas
7.3.1 Increasing Demand of Natural Gas as Alternative Fuel to Drive the Market for Robotic Refueling System
7.4 Petrochemicals
7.4.1 Increasing Adoption of Robotic Refueling System in Oil & Gas Vertical to Support Market Growth
7.5 Others
7.5.1 Increasing Demand for Renewable Fuels to Drive the Market During Forecast Period
8 Robotic Refueling System Market, By Payload Carrying Capacity (Page No. - 47)
8.1 Introduction
8.2 Up to 50 kg
8.2.1 Up to 50 kg Payload Carrying CaPCIty to Hold Largest Share of the Market
8.3 50�100 kg
8.3.1 use of 50�100 kg Payload Carrying Capacity to Increase Across Industry Vertical
8.4 100�150 kg
8.4.1 Market for 100�150 kg to Grow at the Highest CAGR During Forecast Period
9 Robotic Refueling System Market, By Vertical (Page No. - 52)
9.1 Introduction
9.2 Mining
9.2.1 Mining to Hold the Largest Share of the Robotic Refueling System Market
9.3 Automotive
9.3.1 Market Forv Automotive Verticle to Grow at the Highest CAGR During Forecast Period
9.4 Oil & Gas
9.4.1 Increasing Demand for Petrochemicals to Drive the Market During Forecast Period
9.5 Aerospace
9.5.1 Robotic Refueling of Commercial Aircrafts to Address Safety and Security Concerns
9.6 Military & Defense
9.6.1 Deployment Robotic Refueling System in Battlefield to Enhance Safety During War
9.7 Warehouse and Logistics
9.7.1 Increasing use of Hybrid Fuelcell Vehicles in Logistics and Warehousing to Drive the Market
9.8 Marine and Shipping
9.8.1 Robotic Refueling of Sea Vessels in Remote Location Will Increase Adoption in Marine and Shipping Vertical
9.9 Construction
9.9.1 Adoption of Robotic Refueling System to Drive Cost Efficcency in Construction Vertical
9.10 Others
9.10.1 Refueling of Satellites Through Robotic System Will Drive the Market During Forecast Period
10 Geographic Analysis (Page No. - 76)
10.1 Introduction
10.2 North America
10.2.1 US
10.2.1.1 US to Hold the Largest Share of the Robotic Refueling System Market in 2018
10.2.2 Canada
10.2.2.1 Increasing Demand of Robotic Refueling System Due to Safety Concerns to Drive the Market in Canada
10.2.3 Mexico
10.2.3.1 Robotic Refueling System Market to Grow at a Significant Rate in Mexico
10.3 Europe
10.3.1 Germany
10.3.1.1 Growing Demand From Mining Vertical to Drive the Market in Germany
10.3.2 France
10.3.2.1 Growing Demand From Aerospace Vertical to Drive the Market in France
10.3.3 UK
10.3.3.1 Increasing Adoption of Robotic Technology, to Drive the Market in UK
10.3.4 Rest of Europe
10.3.4.1 Increasing Adoption of Robotic Refueling System, Due to Harsh Climatic Condition to Drive the Market in Rest of Europe
10.4 APAC
10.4.1 China
10.4.1.1 Increasing Adoption Autonomous Vehicles to Drive the Market in China
10.4.2 Japan
10.4.2.1 Growing Adoption of Electric/ Hybrid Vehicles to Drive the Market in Japan
10.4.3 South Korea
10.4.3.1 Increasing Robot Density to Drive the Market in South Korea
10.4.4 Rest of APAC
10.4.4.1 Increasing Adoption of Robotic Refueling in Mining Sites to Drive the Market in Rest of APAC
10.5 RoW
10.5.1 South America
10.5.1.1 Rapidly Growing Mining Sector to Drive the Demand for Robotic Refueling System
10.5.2 Middle East and Africa
10.5.2.1 Adoption of Robotic Refueling in Remotely Located Oil & Gas Field to Drive the Market in Middle-East & Africa
11 Competitive Landscape (Page No. - 86)
11.1 Introduction
11.2 Competitive Leadership Mapping, 2018
11.2.1 Visionary Leaders
11.2.2 Dynamic Differentiators
11.2.3 Innovators
11.2.4 Emerging Companies
11.3 Business Strategy Excellence (For All 25 Players)
11.4 Strength of Product Portfolio (For All 25 Players)
12 Company Profile (Page No. - 91)
12.1 Key Players
(Business Overview, Products Offered, SWOT Analysis, and MnM View)*
12.1.1 ABB Group
12.1.2 Scott Technology Ltd
12.1.3 KUKA
12.1.4 Rotec Engineering B.V.
12.1.5 Fuelmatics
12.1.6 Mine Energy Solution Pty
12.1.7 GAZPROMNEFT-AERO
12.1.8 Aerobotix
12.1.9 Shaw Development LLC
12.1.10 FANUC
12.2 Other Key Players
12.2.1 St�ubli International
12.2.2 Daihen
12.2.3 PLUG POWER Inc
12.2.4 Neste Oyj
12.2.5 Yaskawa
12.2.6 Aral
12.2.7 Royal Dutch Shell PLC
12.2.8 TATSUNO Corporation
12.2.9 Green Fueling Inc
12.2.10 Simon Group Holdings
*Details on Business Overview, Products Offered, SWOT Analysis, and MnM View Might Not be Captured in Case of Unlisted Companies.
13 Appendix (Page No. - 116)
13.1 Discussion Guide
13.2 Knowledge Store: Marketsandmarkets� Subscription Portal
13.3 Available Customizations
13.4 Related Reports
13.5 Author Details
List of Tables (61 Tables)
Table 1 Robotic Refueling System Market in Terms of Volume, 2016�2030 (No. of Units)
Table 2 Market, By Fuel Pumped, 2016�2030 (USD Million)
Table 3 Market for Robotic Refueling Systems Used for Pumping Gasoline, By Payload-Carrying Capacity, 2016�2030 (USD Million)
Table 4 Market for Robotic Refueling Systems Used for Pumping Natural Gas, By Payload-Carrying Capacity, 2016�2030 (USD Million)
Table 5 Market for Robotic Refueling Systems Used for Pumping Petrochemicals, By Payload-Carying Capacity, 2016�2030 (USD Million)
Table 6 Market for Robotic Refueling Systems Used for Pumping Other Fuel, By Payload-Carrying Capacity, 2016�2030 (USD Million)
Table 7 Market, By Payload Capacity, 2016�2030 (USD Million)
Table 8 Market for Payload Capacity of Up to 50.00 kg, By Vertical, 2016�2030 (USD Million)
Table 9 Market for Payload Capacity of 50�100 kg, By Vertical, 2016�2030 (USD Million)
Table 10 Robotic Refueling System Market for Payload Capacity of 100 kg�150 kg, By Vertical, 2016�2030 (USD Million)
Table 11 Market, By Vertical, 2016�2030 (USD Million)
Table 12 Market for Mining, By Region, 2016�2030 (USD Thousand )
Table 13 Market for Mining in North America, By Country, 2016�2030 (USD Thousand)
Table 14 Market for Mining in Europe, By Country, 2016�2030 (USD Thousand)
Table 15 Market for Mining in APAC, By Country/Region, 2016�2030 (USD Thousand)
Table 16 Market for Mining in RoW, By Region, 2016�2030 (USD Thousand)
Table 17 Market for Automotive Vertical, By Region, 2016�2030 (USD Thousand)
Table 18 Market for Automotive Vertical in North America, By Country, 2016�2030 (USD Thousand)
Table 19 Market for Automotive Vertical in Europe, By Country/Region, 2016�2030 (USD Thousand)
Table 20 Market for Automotive Vertical in APAC, By Country/Region, 2016�2030 (USD Thousand)
Table 21 Market for Automotive Vertical in RoW, By Region, 2016�2030 (USD Thousand)
Table 22 Robotic Refueling System Market for Oil & Gas Vertical, By Region, 2016�2030 (USD Thousand)
Table 23 Market for Oil & Gas Vertical in North America, By Country, 2016�2030 (USD Thousand)
Table 24 Market for Oil & Gas Vertical in Europe, By Country/Region, 2016�2030 (USD Thousand)
Table 25 Market for Oil & Gas Vertical in APAC, By Country/Region, 2016�2030 (USD Thousand)
Table 26 Market for Oil & Gas Vertical in RoW, By Region, 2016�2030 (USD Thousand)
Table 27 Market for Aerospace Vertical, By Region, 2016�2030 (USD Thousand)
Table 28 Market for Aerospace Vertical in North America, By Country, 2016�2030 (USD Thousand)
Table 29 Market for Aerospace Vertical in Europe, By Country/Region, 2016�2030 (USD Thousand)
Table 30 Market for Aerospace Vertical in APAC, By Country/Region, 2016�2030 (USD Thousand)
Table 31 Market for Aerospace Vertical in RoW, By Region, 2016�2030 (USD Thousand)
Table 32 Market for Military & Defense Vertical, By Region, 2016�2030 (USD Thousand)
Table 33 Robotic Refueling System Market for Military & Defense Vertical in North America, By Country, 2016�2030 (USD Thousand)
Table 34 Market for Military & Defense Vertical in Europe, By Country/Region, 2016�2030 (USD Thousand)
Table 35 Market for Miltary & Defense Vertical in APAC, By Country/Region, 2016�2030 (USD Thousand)
Table 36 Market for Miltary & Defense Vertical in RoW, By Region, 2016�2030 (USD Thousand)
Table 37 Market for Warehouse & Logistics Vertical, By Region, 2016�2030 (USD Thousand)
Table 38 Robotic Refueling System Market for Warehouse & Logistics Vertical in North America, By Country, 2016�2030 (USD Thousand)
Table 39 Market for Warehouse & Logistics Vertical in Europe, By Country/Region, 2016�2030 (USD Thousand)
Table 40 Market for Warehouse & Logistics Vertical in APAC, By Country/Region, 2016�2030 (USD Thousand)
Table 41 Market for Warehouse & Logistics Vertical in RoW, By Region, 2016�2030 (USD Thousand)
Table 42 Market for Marine & Shipping Vertical, By Region, 2016�2023 (USD Thousand)
Table 43 Market for Marine & Shipping Vertical in North America, By Country, 2016�2030 (USD Thousand)
Table 44 Market for Marine & Shipping Vertical in Europe, By Country/Region, 2016�2030 (USD Thousand)
Table 45 Market for Marine & Shipping Vertical in APAC, By Country/Region, 2016�2030 (USD Thousand)
Table 46 Market for Marine & Shipping Vertical in RoW, By Region, 2016�2030 (USD Thousand)
Table 47 Market for Construction Vertical, By Region, 2016�2030 (USD Thousand)
Table 48 Market for Construction Vertical in North America, By Country, 2016�2030 (USD Thousand)
Table 49 Market for Construction Vertical in Europe, By Country/Region, 2016�2030 (USD Thousand)
Table 50 Market for Construction Vertical in APAC, By Country/Region, 2016�2030 (USD Thousand)
Table 51 Robotic Refueling System Market for Construction Vertical in RoW, By Region, 2016�2030 (USD Thousand)
Table 52 Market for Other Verticals, By Region, 2016�2030 (USD Thousand)
Table 53 Market for Other Verticals in North America, By Country, 2016�2030 (USD Thousand)
Table 54 Robotic Refueling System Market for Other Verticals in Europe, By Country/Region, 2016�2030 (USD Thousand)
Table 55 Robotic Refueling System Market for Other Verticals in APAC, By Country/Region, 2016�2030 (USD Thousand)
Table 56 Robotic Refueling System Market for Other Verticals in RoW, By Region, 2016�2030 (USD Thousand)
Table 57 Market, By Region, 2016�2030 (USD Million)
Table 58 Market in North America, By Country, 2016�2030 (USD Thousand)
Table 59 Market in Europe, By Country, 2016�2030 (USD Thousand)
Table 60 Market in APAC, By Country, 2016�2030 (USD Thousand)
Table 61 Market in RoW, By Region, 2016�2030 (USD Thousand)
List of Figures (37 Figures)
Figure 1 Segmentation of Robotic Refueling System Market
Figure 2 Market: Research Design
Figure 3 Robotic Refueling System Market: Bottom-Up Approach
Figure 4 Market: Top-Down Approach
Figure 5 Data Triangulation
Figure 6 Gasoline to Hold Larest Share of Market, By Fuel Pumped, During Forecast Period
Figure 7 Market for Robotic Refueling Systems With Payload Capacity of 100�150 kg to Grow at Highest CAGR During Forecast Period
Figure 8 Mining Vertical Held Largest Market Size of Market in 2018
Figure 9 Europe Held Largest Share of Robotic Refueling Sysyetm Market in 2018
Figure 10 Higher Adoption in Mining Vertical to Drive Growth of Market During Forecast Period
Figure 11 Robotic Refueling System Market for Other Fuel Pumped to Grow at Highest CAGR During Forecast Period
Figure 12 Market for Robotic Refueing Systems With Payload-Carrying Capacity of Up to 50.0 kg to Hold Largest Share During Forecast Period
Figure 13 China to Hold Largest Share of Market in APAC By 2019
Figure 14 US to Hold Largest Share of Market in 2018
Figure 15 Robotic Refueling Systems Market: Drivers, Restraints, Opportunities, and Challenges
Figure 16 Value Chain Analysis of Robotic Refueling System Ecosystem: R&D and Manufacturing Phases Contribute Maximum Value
Figure 17 Process Flow Chart for Robotic Refueling System
Figure 18 Market for Robotic Refueling Systems Used for Pumping Gasoline to Hold Largest Market Size During Forecast Period
Figure 19 Robotic Refueling Systems With Payload Capacity of Up to 50 kg Used for Pumping Gasoline to Hold Largest Share of Market By 2030
Figure 20 Market for Robotic Refueling Systems Used for Pumping PetrochEMCals With the Payload Capacity in the Range of 100-150 kg to Grow at Highest CAGR During Forecast Period
Figure 21 Market for Robotic Refueling Systems With Payload-Carrying Capacity of 100�150 kg to Grow at Highest CAGR During Forecast Period
Figure 22 Automotive Vertical to Grow at Highest CAGR for Market During Forecast Period
Figure 23 Europe to Register Largest Share of Market for Automotive Vertical By 2030
Figure 24 Europe to Register Largest Share of Market for Aerospace Vertical
Figure 25 Europe to Register Largest Share of Market for Warehouse and Logistics Vertical By 2030
Figure 26 APAC to Register Highest Growth of Market for Other Vertical During Forecast Period
Figure 27 Market in APAC to Grow at Highest CAGR During Forecast Period
Figure 28 North America: Market Snapshot
Figure 29 Europe: Robotic Refueling System Market Snapshot
Figure 30 APAC: Robotic Refueling System Market Snapshot
Figure 31 Market in South America to Grow at Higher CAGR During Forecast Period
Figure 32 Market Ranking, 2018
Figure 33 Market (Global) Competitive Leadership Mapping, 2018
Figure 34 Company Snapshot: ABB
Figure 35 Company Snapshot: Scott Technology Ltd
Figure 36 KUKA: Company Snapshot
Figure 37 FANUC: Company Snapshot
The study involved 4 major activities in estimating the current size of the robotic refueling system market. Exhaustive secondary research has been conducted to collect information about the market, the peer market, and the parent market. Validating findings, assumptions, and sizing with industry experts across the value chain through primary research has been the next step. Both top-down and bottom-up approaches have been employed to estimate the complete market size. After that, market breakdown and data triangulation methods have been used to estimate the market size of segments and subsegments.
Secondary Research
In the secondary research process, various secondary sources have been referred to for identifying and collecting information pertinent to this study. The secondary sources include annual reports; press releases; investor presentations; white papers; journals & certified publications; and articles from recognized authors, directories, and databases. The secondary research has been conducted to obtain key information about the industry�s supply chain, market�s value chain, the total pool of key players, market segmentation according to the industry trends (to the bottommost level), geographic markets, and key developments from both market- and technology-oriented perspectives
Primary Research
Extensive primary research has been conducted after gaining knowledge about the robotic refueling system market scenario through secondary research. Several primary interviews have been conducted with market experts from both demand (commercial application providers) and supply (equipment manufacturers and distributors) sides across 4 major regions: North America, Europe, APAC, and RoW. Approximately 20% and 80% primary interviews have been conducted with parties from the demand side and supply side, respectively. The primary data has been collected through questionnaires, emails, and telephonic interviews.
To know about the assumptions considered for the study, download the pdf brochure
Market Size Estimation
In the complete engineering process, both top-down and bottom-up approaches, along with several data triangulation methods, have been used to estimate and validate the size of the robotic refueling system market and other dependent submarkets. The key players in the market have been determined through primary and secondary research. This entire research methodology involves the study of the annual and financial reports of the top market players and extensive interviews with industry experts, such as CEOs, VPs, directors, and marketing executives for key insights (both qualitative and quantitative) about the robotic refueling system market.
Data Triangulation
After arriving at the overall market size from the estimation process explained above, the total market has been split into several segments and subsegments. To complete the overall market engineering process and arrive at the exact statistics for all the segments and subsegments, the data triangulation and market breakdown procedures have been employed wherever applicable. The data have been triangulated by studying various factors and trends from both the demand and supply sides. The market has also been validated using both top-down and bottom-up approaches.
Report Objectives
- To describe and forecast the robotic refueling system market, by fuel pumped, payload-carrying capacity, vertical, and region in terms of value
- To forecast the global robotic refueling system market, in terms of volume
- To forecast the market size for various segments with regard to 4 main regions: North America, Europe, APAC, and RoW
- To provide detailed information regarding the major factors (drivers, restraints, opportunities, and challenges) influencing the growth of the robotic refueling system market
- To provide a comprehensive overview of the robotic refueling system value chain and industry trends and standards in the said market
- To strategically analyze the micromarkets with respect to the individual growth trends, future prospects, and contribution to the total market
- To analyze the opportunities in the market for various stakeholders by identifying the high-growth segments of the robotic refueling system market
- To strategically profile the key players and comprehensively analyze their market position in terms of ranking and core competencies, along with detailing the competitive landscape for the market leaders
Available Customizations
With the given market data, MarketsandMarkets offers customizations according to the company�s specific needs. The following customization options are available for the report:
Product Analysis
- Product matrix that gives a detailed comparison of the product portfolios of each company
Company Information
- Detailed analysis and profiling of additional market players (up to 5).


Growth opportunities and latent adjacency in Robotic Refueling System Market