Scratch-Resistant Glass Market by Product Type (Chemically-Strengthened Glass, Sapphire Glass), Application (Smartphones & Tablets, Automotive, Interior Architecture, Electronics), and Region (North America, Europe, APAC) - Global Forecast to 2022


Scratch-Resistant Glass Market Size And Forecast
[120 Pages Report] scratch-resistant glass market is estimated to grow from USD 1.69 Billion in 2016 to USD 2.85 Billion by 2022, at a CAGR of 9.1% during the forecast period. The base year considered for the study is 2016, and the market size is projected between 2017 and 2022. The increase in the use of scratch-resistant glass in the construction & infrastructure and automotive end-use industries is expected to drive the market in the coming years.
Objectives of the Study
The report analyzes the global scratch-resistant glass market, in terms of volume (kilotons) and value (USD million). The report also estimates the size and growth potential of the scratch-resistant glass market across different segments, such as product type, application, and region. It forecasts the market size for five regions, namely Asia Pacific, North America, Europe, Middle East & Africa, and Latin America. The study also covers market opportunities and competitive landscape for stakeholders and market leaders.
The research methodology used to estimate and forecast the scratch-resistant glass market begins with gathering data on key company revenues and raw material costs through secondary sources, such as Factiva, D&B Hoovers, Manta, and others. Product offerings are also taken into consideration to determine the market segmentation. The bottom-up approach was used to arrive at the overall size of the scratch-resistant glass market from the revenue of key players. After arriving at the total market size, the overall market was split into several segments and subsegments, which were then verified through primary research by conducting extensive interviews with CEOs, VPs, directors, and key executives from related industries. Data triangulation and market breakdown procedures were used to complete the overall market engineering process and arrive at the exact statistics for all segments and subsegments of the scratch-resistant glass market. The breakdown of profiles of primary interviewees is shown in the figure below:
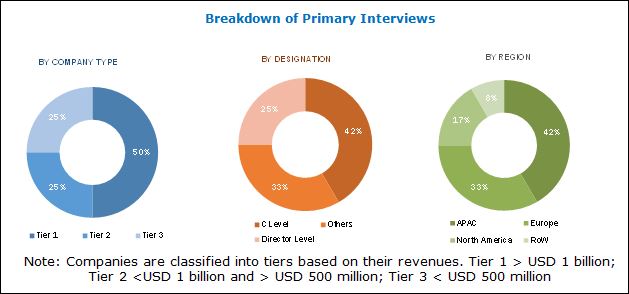
To know about the assumptions considered for the study, download the pdf brochure
Key manufacturers of scratch-resistant glass include Corning Incorporated (US), Asahi Glass (Japan), Nippon Electric Glass (Japan), Guardian Industries (US), Schott AG (Germany), and Monocrystal (Russia).
Target audience
- Scratch-resistant Glass Manufacturers
- Raw Material Suppliers
- Distributors & Suppliers
- Industry Associations
“This study answers several questions for stakeholders, primarily which market segments to focus on in the next two to five years to prioritize efforts and investments.”
Scope of the Report
The research report segments the scratch-resistant glass market into the following submarkets:
By Product Type
- Chemically-strengthened Glass
- Sapphire Glass
By Application:
- Smartphones & Tablets
- Automotive
- Interior Architecture
- Electronics
-
Others
- Marine
- Consumer Goods
By Region
- North America
- Europe
- Asia Pacific
- Middle East & Africa
- Latin America
Available Customizations
Along with the market data, MarketsandMarkets offers customizations according to a company’s specific needs. The following customization options are available for this report:
Product Analysis
- Product matrix, which gives a detailed comparison of the product portfolio of each company
Regional Analysis
- Further breakdown of the North American scratch-resistant glass market
- Further breakdown of the European scratch-resistant glass market
- Further breakdown of the Asia Pacific scratch-resistant glass market
- Further breakdown of the Middle East & African scratch-resistant glass market
- Further breakdown of the Latin American scratch-resistant glass market
- Detailed analysis and profiling of additional market players
The scratch-resistant glass market is estimated to be USD 1.85 Billion in 2017 and is projected to reach USD 2.85 Billion by 2022, at a CAGR of 9.1% during the forecast period. The growth of the market can be attributed to the high demand for scratch-resistant glass from the smartphones & tablets and electronics applications. The market has witnessed significant growth over the last few years, due to the increased demand for scratch-resistant glass from emerging economies such as China, India, Brazil, and Thailand.
The scratch-resistant glass market is segmented on the basis of product type, application, and region. Based on product type, the market is segmented into chemically-strengthened glass and sapphire glass. Chemically-strengthened glass is projected to be the largest and fastest-growing segment of the market during the forecast period, owing to its large-scale application in smartphones & tablets. The sapphire glass product type is estimated to be the second-largest product type in the scratch-resistant glass market in 2017 owing to the increasing application of sapphire glass in smartwatches and optical windows.
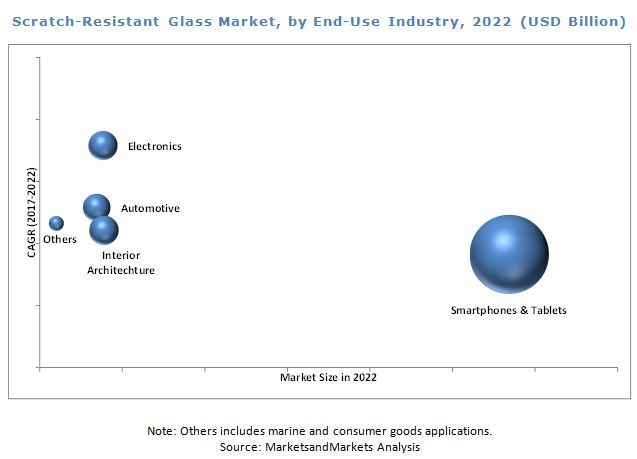
Based on application, the scratch-resistant glass market is segmented into smartphones & tablets, automotive, interior architecture, electronics, and others. Smartphones & tablets is estimated to be the largest segment of the scratch-resistant glass market in 2017, owing to the growing demand for scratch-resistant glass from smartphones & tablet applications and the growing penetration of scratch-resistant glass in electronics and automotive applications.
Asia Pacific is estimated to be the largest market for scratch-resistant glass in 2017. India and China are major markets for scratch-resistant glass due to the rising demand for scratch-resistant glass from the smartphones & tablets application in these countries. Also, these countries have shown a rapid increase in smartphone users in the recent past that is expected to continue over the forecast period.
Corning Incorporated (US), Asahi Glass (Japan), Nippon Electric Glass (Japan), Guardian Industries (US), Schott AG (Germany), and Monocrystal (Russia) are some of the leading players in the scratch-resistant glass market. Corning Incorporated (US) has been focusing on maintaining its position in the market by tapping various global markets. The company has entered into strategic alliances with local distribution centers and various end-use industries to increase its market share and customer base. The company has adopted new product developments as its major growth strategy in recent years.
To speak to our analyst for a discussion on the above findings, click Speak to Analyst
 Exclusive indicates content/data unique to MarketsandMarkets and not available with any competitors.
Table of Contents
1 Introduction (Page No. - 15)
1.1 Objectives of the Study
1.2 Market Definition
1.3 Market Scope
1.3.1 Years Considered for the Study
1.4 Currency
1.5 Unit Considered
1.6 Limitations
1.7 Stakeholders
2 Research Methodology (Page No. - 18)
2.1 Research Data
2.1.1 Secondary Data
2.1.1.1 Key Data From Secondary Sources
2.1.2 Primary Data
2.1.2.1 Key Data From Primary Sources
2.1.2.2 Key Industry Insights
2.1.2.3 Breakdown of Primary Interviews
2.2 Market Size Estimation
2.2.1 Bottom-Up Approach
2.2.2 Top-Down Approach
2.3 Data Triangulation
2.4 Assumptions
3 Executive Summary (Page No. - 26)
4 Premium Insights (Page No. - 30)
4.1 Attractive Growth Opportunities in Scratch-Resistant Glass Market
4.2 Market of Scratch-Resistant Glass, By Product Type
4.3 Market of Scratch-Resistant Glass, By Application, and Region
4.4 Market of Scratch-Resistant Glass, By Country
5 Market Overview (Page No. - 33)
5.1 Introduction
5.2 Market Dynamics
5.2.1 Drivers
5.2.1.1 Rising Demand in Smartphones & Tablets Application
5.2.1.2 High Penetration of Smartphone Users in the Developing Regions
5.2.2 Restraints
5.2.2.1 Very Expensive for Use in Other Applications
5.2.2.2 Use of Film Lamination & Coatings is Restraining the Market
5.2.3 Opportunities
5.2.3.1 Growing Demand From Developing Economies
5.2.3.2 Demand for Delicate Products on the Rise
5.2.4 Challenges
5.2.4.1 to Overcome the Constant Need for Advancement
5.3 Porter’s Five Forces Analysis
5.3.1 Threat of New Entrants
5.3.2 Threat of Substitutes
5.3.3 Bargaining Power of Suppliers
5.3.4 Bargaining Power of Buyers
5.3.5 Intensity of Competitive Rivalry
6 Macroeconomic Indicators (Page No. - 38)
6.1 Introduction
6.2 Trends and Forecast of GDP
6.3 Trends in Automotive Industry
7 Scratch-Resistant Glass Market, By Product Type (Page No. - 40)
7.1 Introduction
7.1.1 Chemically-Strengthened Glass
7.1.2 Sapphire Glass
8 Scratch-Resistant Glass Market, By Application (Page No. - 46)
8.1 Introduction
8.2 Smartphones & Tablets
8.3 Automotive
8.4 Interior Architecture
8.5 Electronics
8.6 Others
9 Scratch-Resistant Glass Market, By Region (Page No. - 57)
9.1 Introduction
9.2 North America
9.2.1 US
9.2.2 Canada
9.3 Europe
9.3.1 Germany
9.3.2 UK
9.3.3 France
9.3.4 Spain
9.3.5 Italy
9.3.6 Russia
9.4 APAC
9.4.1 China
9.4.2 Japan
9.4.3 Taiwan
9.4.4 India
9.4.5 South Korea
9.5 Middle East & Africa
9.5.1 UAE
9.5.2 Saudi Arabia
9.5.3 South Africa
9.6 Latin America
9.6.1 Brazil
9.6.2 Mexico
10 Competitive Landscape (Page No. - 91)
10.1 Introduction
10.2 Market Ranking Analysis
10.3 Competitive Situations and Trends
10.3.1 New Products Launches
10.3.2 Agreements & Joint Ventures
10.3.3 Investments & Expansions
11 Company Profiles (Page No. - 95)
(Overview, Financial*, Products & Services, Strategy, and Developments)
11.1 Corning Incorporated
11.2 Asahi Glass
11.3 Nippon Electric Glass
11.4 Guardian Industries
11.5 Monocrystal
11.6 Rubicon Technology
11.7 Kyocera Group
11.8 Crystalwise Technology
11.9 Edmund Optics
11.10 Schott AG
11.11 Other Key Players
11.11.1 Saint-Gobain
11.11.2 Crystal Applied Technology
11.11.3 Swiss Jewel Company
11.11.4 Thorlabs
11.11.5 Precision Sapphire Technologies
*Details Might Not Be Captured in Case of Unlisted Companies
12 Appendix (Page No. - 113)
12.1 Insights From Industry Experts
12.2 Discussion Guide
12.3 Knowledge Store: Marketsandmarkets Subscription Portal
12.4 Introducing RT: Real-Time Market Intelligence
12.5 Available Customizations
12.6 Related Reports
12.7 Author Details
List of Tables (82 Tables)
Table 1 Trends and Forecast of GDP, 2016–2022 (USD Billion)
Table 2 Automotive Production, By Country, 2011–2016 (Million Units)
Table 3 Market Size, By Product Type, 2015–2022 (Kiloton)
Table 4 Market Size, By Product Type, 2015–2022 (USD Million)
Table 5 Chemically-Strengthened Market Size, By Region, 2015–2022 (Kiloton)
Table 6 Chemically-Strengthened Market Size, By Region, 2015–2022 (USD Million)
Table 7 Sapphire Market Size, By Region, 2015–2022 (Kiloton)
Table 8 Sapphire Market Size, By Region, 2015–2022 (USD Million)
Table 9 Market Size, By Application, 2015–2022 (Kiloton)
Table 10 Market Size, By Application, 2015–2022 (USD Million)
Table 11 Market Size in Smartphones & Tablets Application, By Region, 2015–2022 (Kiloton)
Table 12 Market Size in Smartphones & Tablets Application, By Region, 2015–2022 (USD Million)
Table 13 Market Size in Automotive Application, By Region, 2015–2022 (Kiloton)
Table 14 Market Size in Automotive Application, By Region, 2015–2022 (USD Million)
Table 15 Market Size in Interior Architecture Application, By Region, 2015–2022 (Kiloton)
Table 16 Market Size in Interior Architecture Application, By Region, 2015–2022 (USD Million)
Table 17 Market Size in Electronics Application, By Region, 2015–2022 (Kiloton)
Table 18 Market Size in Electronics Application, By Region, 2015–2022 (USD Million)
Table 19 Market Size in Other Applications, By Region, 2015–2022 (Kiloton)
Table 20 Market Size in Other Applications, By Region, 2015–2022 (USD Million)
Table 21 Market Size, By Region, 2015–2022 (Kiloton)
Table 22 Market Size, By Region, 2015–2022 (USD Million)
Table 23 North America: Market Size, By Country, 2015–2022 (Kiloton)
Table 24 North America: Market Size, By Country, 2015–2022 (USD Million)
Table 25 North America: Market Size, By Application, 2015–2022 (Kiloton)
Table 26 North America: Market Size, By Application, 2015–2022 (USD Million)
Table 27 US: Market Size, By Application, 2015–2022 (Kiloton)
Table 28 US: Market Size, By Application, 2015–2022 (USD Million)
Table 29 Canada: Market Size, By Application, 2015–2022 (Kiloton)
Table 30 Canada: Market Size, By Application, 2015–2022 (USD Million)
Table 31 Europe: Market Size, By Country, 2015–2022 (Kiloton)
Table 32 Europe: Market Size, By Country, 2015–2022 (USD Million)
Table 33 Europe: Market Size, By Application, 2015–2022 (Kiloton)
Table 34 Europe: Market Size, By Application, 2015–2022 (USD Million)
Table 35 Germany: Market Size, By Application, 2015–2022 (Kiloton)
Table 36 Germany: Market Size, By Application, 2015–2022 (USD Million)
Table 37 UK: Market Size, By Application, 2015–2022 (Kiloton)
Table 38 UK: Market Size, By Application, 2015–2022 (USD Million)
Table 39 France: Market Size, By Application, 2015–2022 (Kiloton)
Table 40 France: Market Size, By Application, 2015–2022 (USD Million)
Table 41 Spain: Market Size, By Application, 2015–2022 (Kiloton)
Table 42 Spain: Market Size, By Application, 2015–2022 (USD Million)
Table 43 Italy: Market Size, By Application, 2015–2022 (Kiloton)
Table 44 Italy: Market Size, By Application, 2015–2022 (USD Million)
Table 45 Russia: Market Size, By Application, 2015–2022 (Kiloton)
Table 46 Russia: Market Size, By Application, 2015–2022 (USD Million)
Table 47 APAC: Market Size, By Country, 2015–2022 (Kiloton)
Table 48 APAC: Market Size, By Country, 2015–2022 (USD Million)
Table 49 APAC: Market Size, By Application, 2015–2022 (Kiloton)
Table 50 APAC: Market Size, By Application, 2015–2022 (USD Million)
Table 51 China: Market Size, By Application, 2015–2022 (Kiloton)
Table 52 China: Market Size, By Application, 2015–2022 (USD Million)
Table 53 Japan: Market Size, By Application, 2015–2022 (Kiloton)
Table 54 Japan: Market Size, By Application, 2015–2022 (USD Million)
Table 55 Taiwan: Market Size, By Application, 2015–2022 (Kiloton)
Table 56 Taiwan: Market Size, By Application, 2015–2022 (USD Million)
Table 57 India: Market Size, By Application, 2015–2022 (Kiloton)
Table 58 India: Market Size, By Application, 2015–2022 (USD Million)
Table 59 South Korea: Market Size, By Application, 2015–2022 (Kiloton)
Table 60 South Korea: Market Size, By Application, 2015–2022 (USD Million)
Table 61 Middle East & Africa: Market Size, By Country, 2015–2022 (Kiloton)
Table 62 Middle East & Africa: Market Size, By Country, 2015–2022 (USD Million)
Table 63 Middle East & Africa: Market Size, By Application, 2015–2022 (Kiloton)
Table 64 Middle East & Africa: Market Size, By Application, 2015–2022 (USD Million)
Table 65 UAE: Market Size, By Application, 2015–2022 (Kiloton)
Table 66 UAE: Market Size, By Application, 2015–2022 (USD Million)
Table 67 Saudi Arabia: Market Size, By Application, 2015–2022 (Kiloton)
Table 68 Saudi Arabia: Market Size, By Application, 2015–2022 (USD Million)
Table 69 South Africa: Market Size, By Application, 2015–2022 (Kiloton)
Table 70 South Africa: Market Size, By Application, 2015–2022 (USD Million)
Table 71 Latin America: Market Size, By Country, 2015–2022 (Kiloton)
Table 72 Latin America: Market Size, By Country, 2015–2022 (USD Million)
Table 73 Latin America: Market Size, By Application, 2015–2022 (Kiloton)
Table 74 Latin America: Market Size, By Application, 2015–2022 (USD Million)
Table 75 Brazil: Market Size, By Application, 2015–2022 (Kiloton)
Table 76 Brazil: Market Size, By Application, 2015–2022 (USD Million)
Table 77 Mexico: Market Size, By Application, 2015–2022 (Kiloton)
Table 78 Mexico: Market Size, By Application, 2015–2022 (USD Million)
Table 79 Market Ranking of Key Players, 2016
Table 80 New Product Launches, 2012–2017
Table 81 Agreements & Joint Ventures, 2012–2017
Table 82 Investments & Expansions, 2012–2017
List of Figures (32 Figures)
Figure 1 Scratch-Resistant Glass: Market Research Design
Figure 2 Market Size Estimation: Bottom-Up Approach
Figure 3 Market Size Estimation: Top-Down Approach
Figure 4 Scratch-Resistant Glass: Market Data Triangulation
Figure 5 Chemically-Strengthened Glass to Dominate the Market, 2017–2022
Figure 6 Electronics to Be the Fastest-Growing Market of Scratch-Resistant Glass, 2017–2022
Figure 7 APAC Dominated the Market of Scratch-Resistant Glass in 2016
Figure 8 Rising Demand for Smartphones & Tablets to Drive Market of Scratch-Resistant Glass, 2017–2022
Figure 9 Sapphire Glass to Be the Fastest-Growing Product Type Between 2017 and 2022
Figure 10 Smartphones & Tablets Application Dominated the Market of Scratch-Resistant Glass in 2016
Figure 11 China to Be the Fastest-Growing Market During the Forecast Period
Figure 12 Drivers, Restraints, Opportunities, and Challenges in the Scratch-Resistant Glass Market
Figure 13 Porter’s Five Forces Analysis
Figure 14 Chemically-Strengthened Glass to Dominate the Market During the Forecast Period
Figure 15 APAC to Be the Largest Chemically-Strengthened Market of Scratch-Resistant Glass Between 2017 and 2022
Figure 16 Europe to Be the Second-Largest Sapphire Market of Scratch-Resistant Glass Between 2017 and 2022
Figure 17 Smartphones & Tablets to Be the Largest Application During the Forecast Period
Figure 18 APAC to Lead the Market in the Smartphones & Tablets Application During the Forecast Period
Figure 19 APAC to Lead the Market in the Automotive Application During the Forecast Period
Figure 20 APAC to Lead the Market in the Interior Architecture Application During the Forecast Period
Figure 21 APAC to Lead the Market in Electronics Application During the Forecast Period
Figure 22 APAC to Lead the Market in Other Applications During the Forecast Period
Figure 23 China and India to Register High Growth During the Forecast Period
Figure 24 North America: Market Snapshot
Figure 25 Europe: Market Snapshot
Figure 26 APAC: Market Snapshot
Figure 27 Companies Adopted Agreements & Joint Ventures as the Key Growth Strategy Between 2012 and 2017
Figure 28 Corning Incorporated: Company Snapshot
Figure 29 Asahi Glass: Company Snapshot
Figure 30 Nippon Electric Glass: Company Snapshot
Figure 31 Rubicon Technology: Company Snapshot
Figure 32 Kyocera Group: Company Snapshot


Growth opportunities and latent adjacency in Scratch-Resistant Glass Market