This research study involved extensive secondary sources, directories, and paid databases to identify and collect information useful for this technical, market-oriented, and commercial study of the service integration and management market. In-depth interviews were conducted with various primary respondents, including key industry participants, subject matter experts, C-level executives of key market players, and industry consultants, to obtain and verify critical qualitative and quantitative information and assess the market prospects. The following figure highlights the market research methodology in developing this report on the service integration and management market.
Secondary Research
The market size of companies offering service integration and management solutions and services was determined based on secondary data available through paid and unpaid sources. It was also arrived at by analyzing the product portfolios of major companies and rating the companies based on their performance and quality.
In the secondary research process, various sources were referred to for identifying and collecting information for this study. Secondary sources included annual reports, press releases, and investor presentations of companies; white papers, journals, and certified publications; and articles from recognized authors, directories, and databases. The data was also collected from other secondary sources, such as journals, government websites, blogs, and vendors' websites. Additionally, the spending of various countries on service integration and management was extracted from the respective sources. Secondary research was mainly used to obtain the key information related to the industry’s value chain and supply chain to identify the key players based on solutions, services, market classification, and segmentation according to offerings of the major players, industry trends related to solutions, services, verticals, and regions, and the key developments from both market- and technology-oriented perspectives.
Primary Research
In the primary research process, various sources from both the supply and demand sides were interviewed to obtain qualitative and quantitative information for the report. The primary sources from the supply side included industry experts, such as Chief Executive Officers (CEOs), Vice Presidents (VPs), marketing directors, technology and innovation directors, and related key executives from major companies and organizations operating in the service integration and management market.
After the complete market engineering (including calculations for market statistics, market breakups, market size estimations, market forecasting, and data triangulation), extensive primary research was conducted to gather information and verify and validate the critical numbers arrived at. Primary research was also undertaken to identify the segmentation types, industry trends, the competitive landscape of the service integration and management market players, and key market dynamics such as drivers, restraints, opportunities, challenges, industry trends, and key strategies.
The Breakup of Primary Profiles:

To know about the assumptions considered for the study, download the pdf brochure
Market Size Estimation
Both top-down and bottom-up approaches were used to estimate and forecast the service integration and management market and other dependent submarkets. The bottom-up procedure was deployed to arrive at the overall market size using the revenues and offerings of the key companies in the market. With data triangulation methods and validation through primary interviews, this study determined and confirmed the exact value of the overall parent market size. The overall market size was then used in the top-down procedure to estimate the size of other individual markets via percentage splits of the market segments.
Top Down and Bottom Up Approach of service integration and management market

To know about the assumptions considered for the study, Request for Free Sample Report
The top-down and bottom-up approaches were used to estimate and validate the service integration and management market size and various other dependent subsegments. The research methodology used to estimate the market size included the following:
Key players in the market were identified through secondary research, and their revenue contributions in respective countries were determined through primary and secondary research.
This entire procedure included the study of the annual and financial reports of top market players and extensive interviews for key insights from industry leaders, such as Chief Executive Officers (CEOs), VPs, directors, and marketing executives.
All percentage splits and breakups were determined using secondary sources and verified through primary sources.
Top Down Approach of service integration and management market.

Data Triangulation
After arriving at the overall market size, the market was split into several segments and subsegments—using the market size estimation processes as explained above. Where applicable, data triangulation and market breakdown procedures were employed to complete the overall market engineering process and determine each market segment's and subsegment's exact statistics. The data was triangulated by studying various factors and trends from government agencies’ demand and supply sides.
Market Definition
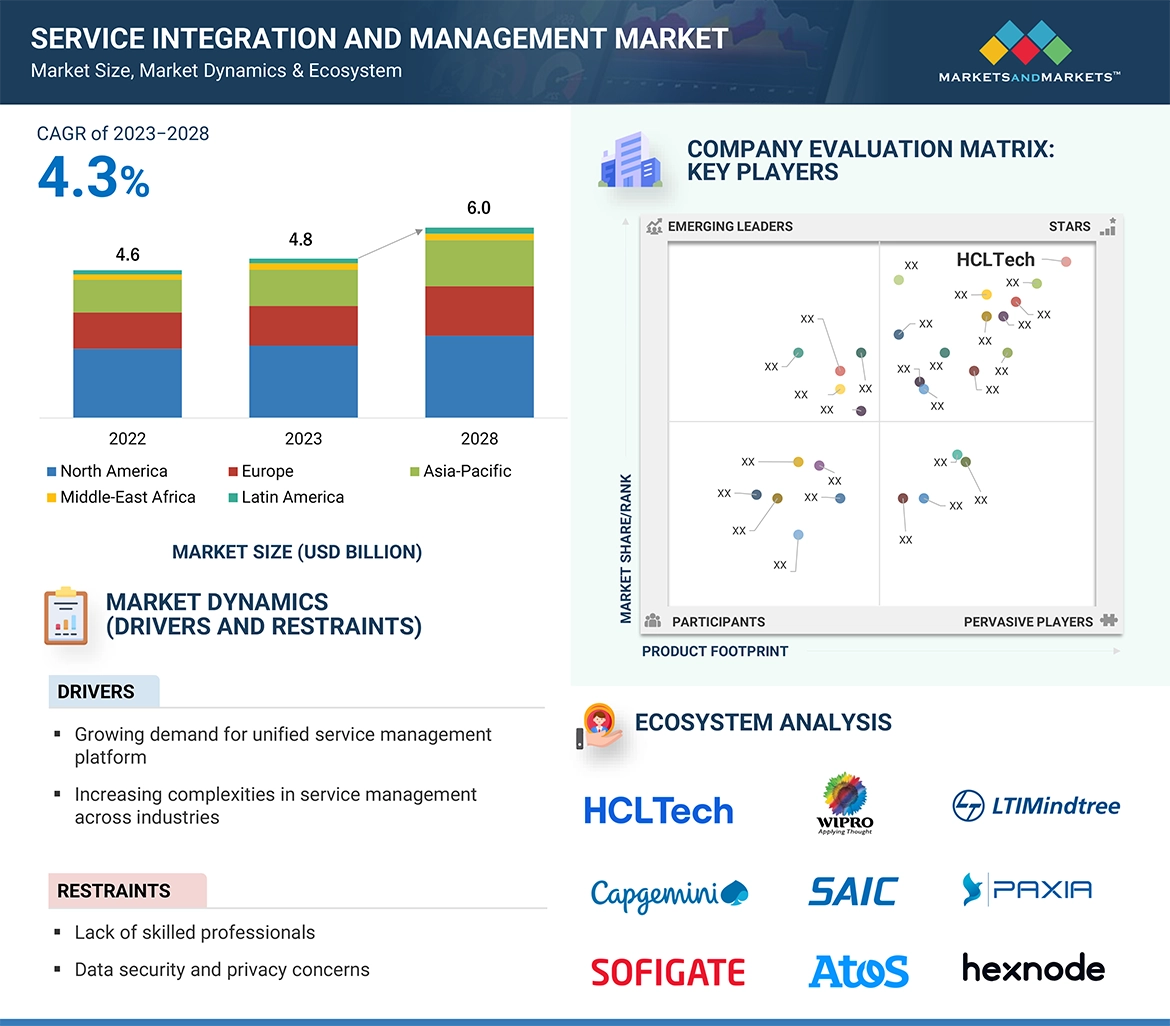
Service integration and management (SIAM) is a comprehensive approach that organizations adopt to manage and integrate services from multiple internal and external providers. It involves coordinating these diverse services to deliver a seamless end-to-end user experience. SIAM provides a structured framework with crucial components such as governance, service management, service integration, and business and technical integration. The goal is to streamline operations, enhance efficiency, and ensure cohesive service delivery. By fostering collaboration among various service providers, SIAM enables organizations to navigate the complexities of modern business landscapes, adapt to changing requirements, and ultimately deliver a more integrated and efficient service experience for their customers.
Key Stakeholders
-
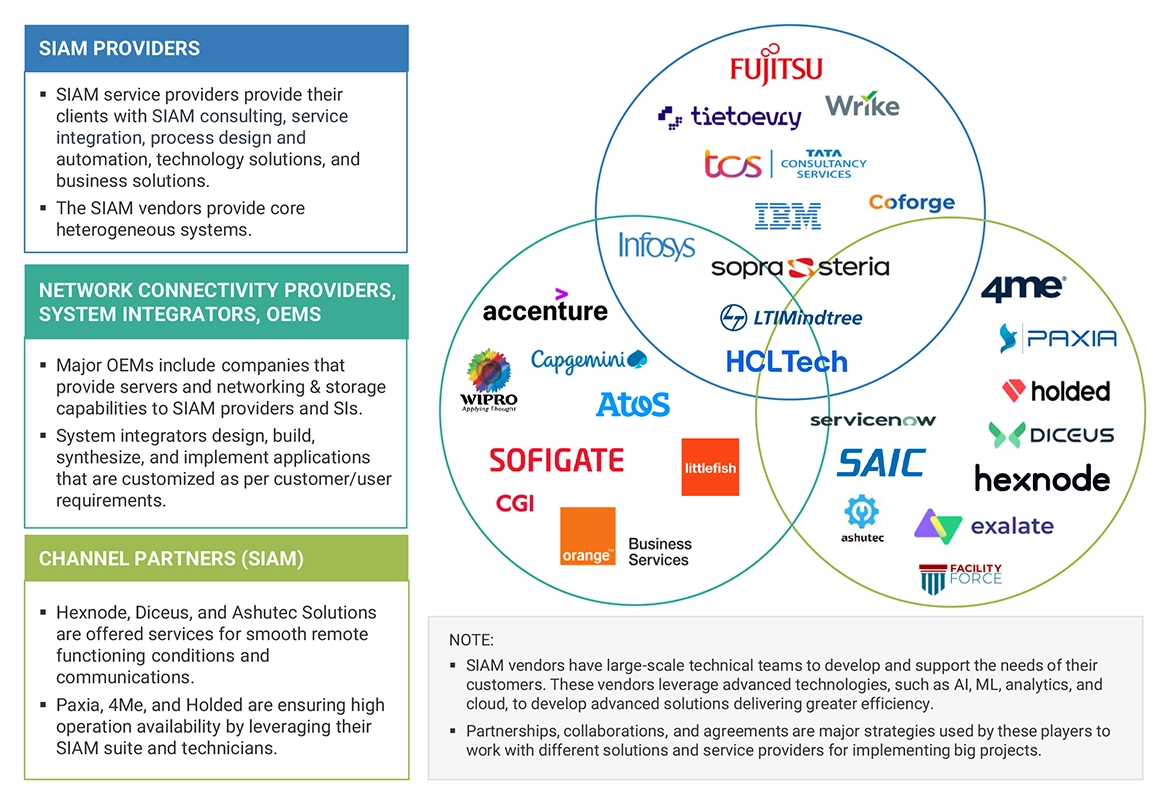
SIAM providers
-
IT Service Management (ITSM) consultants
-
Governments
-
Consultancy firms and advisory firms
-
Regulatory agencies
-
Technology consultants
-
Application developers and aggregators
-
IT service providers
-
Software providers
-
System integrators
-
Network service providers
-
Consulting service providers
-
Professional service providers
-
Distributors and resellers
-
Cloud providers
-
Colocation providers
-
Enterprises
-
Government and standardization bodies
-
Telecom operators
-
Healthcare organizations
-
Financial organizations
-
Datacenter vendors
Report Objectives
-
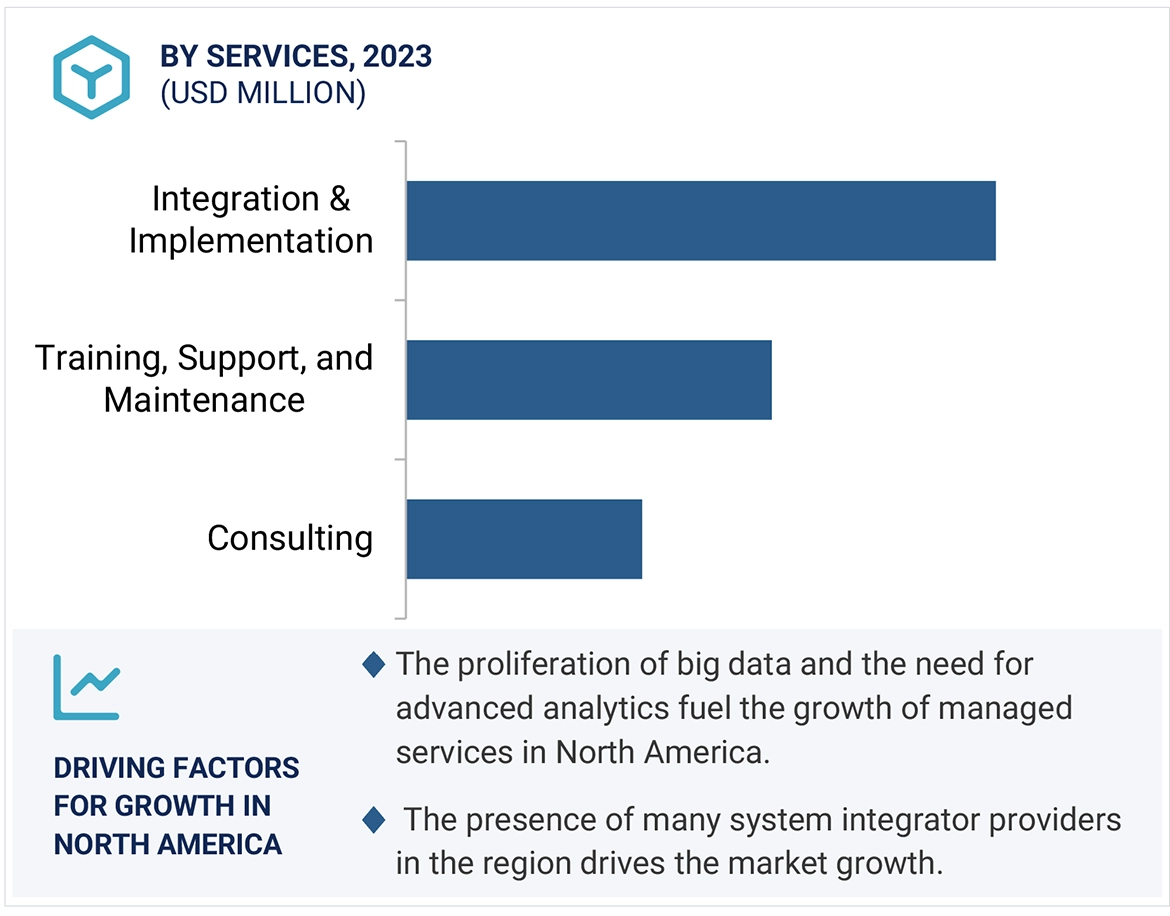
To define, describe, and forecast the service integration and management market by component (solutions and services), business solution, technology solution, organization size, vertical, and region
-
To provide detailed information about the major factors (drivers, restraints, opportunities, and industry-specific challenges) influencing the market growth
-
To analyze the opportunities in the market and provide details of the competitive landscape for stakeholders and market leaders
-
To forecast the market size of the segments for five main regions, namely, North America, Europe, Asia Pacific (APAC), Middle East & Africa (MEA), and Latin America
-
To profile the key players and comprehensively analyze their market rankings and core competencies
-
To analyze the competitive developments, such as mergers and acquisitions, new partnerships, new contracts, and new product developments, in the service integration and management market
Available Customizations
With the given market data, MarketsandMarkets offers customizations per the company’s specific needs. The following customization options are available for the report:
Product Analysis
-
The product matrix provides a detailed comparison of the product portfolio of each company.
Geographic Analysis
-
Further breakup of the service integration and management market
Company Information
-
Detailed analysis and profiling of five additional market players


Growth opportunities and latent adjacency in Service Integration and Management Market