Smart Grid Networking Market by Hardware (Cables, Controllers, Routers, Smart Meter Com Module, Switches), by Software (Network Management: Performance, IP, Device, Security, Configuration), by Services, & by Regions - Global Forecast & Analysis (2014 - 2019)


[174 Pages Report] The global smart grid networking market to grow from $7.12 billion in 2014 to $11.61 billion by 2019, at a Compound Annual Growth Rate (CAGR) of 10.3%. The utility transmission and distribution networks have evolved since their inception to become more interactive and intelligent such as, advance metering solutions to provide utility usage pattern as well as utility measurement and quality control. The consumer demand for utilities is ever growing and the demand growth rate is not proportional to the supply rate coupled with the aging infrastructure that is not able to meet the current demand of the consumers especially during peak hours and has lots of non-technical losses.
Smart grid networking provide two way communications between different components of a utility grid enabling better network management by interactions among the network components to provide data from the different phases such as generation, transmission and distribution. Installing communication networks on utility grids provides integrated communications leading to substation automation, demand response, distribution automation, supervisory control and data acquisition, energy management, real-time control, information and data exchange, asset utilization and increased reliability and security. The smart grid network operates by communicating with different grid components. These components interact with each other via routers, gateways and bridges that are further connected to each other forming a mesh network.
The world is now looking forward to increase the share of renewable energy in the total electricity consumption and the traditional grids are unable to handle the electricity generated from the renewable sources. This has led to installation of smart grids and thus, increases deployment of smart grid networking.
Smart grids are increasingly being adopted by utility operators around the world. Countries located in different regions have already deployed smart grid networks, such as Denmark, Singapore, Puerto Rico, and U.S. The major players in the smart grid networking space are ABB, Cisco, Mitsubishi Electric, Fujitsu, GE, Huawei, Schneider Electric, and Siemens AG.
This report segments the smart grid networking market into four different categories, namely hardware, software, services, and regions. The market by hardware is segmented into cables, controllers, routers, smart meter communication modules, switches and other hardware. The market by software is categorized into network performance monitoring management, IP address management, network traffic management, network device management, network configuration management, network security management and other software. The market by services is divided into consulting, network planning, design and integration, network risk and security assessment, network maintenance and support services and other services. By region, the market can be segmented into North America (NA), Europe, Asia-Pacific (APAC), Middle East and Africa (MEA), and Latin America (LA).
The utility operators are facing problems in their existing utility grids due to aging of the grid, peak hour outages and increasing non-technical losses in the grid. The rising dependencies on utility grids for daily activities by homes, offices and industries are furthermore adding concerns for them. This in turn is driving the utility operators to transform their traditional utility grids to smart grids enabled with smart grid networking to gain maximum efficiency during transmission and distribution and to avoid non-technical losses.
Smart grid networking is an effective way to build intelligent utility grids, enabling two way communications between different components involved in generation, transmission and distribution. Smart grid networks comprises of networking hardware such as, routers, switches and controllers and network management software such as, performance monitoring, IP address management and network device management. These hardware and software work together to form mesh network enabling the utility grid with intelligent features such as, substation automation, distribution automation, energy-management, real-time control, self-healing and increased reliability and security. Smart grid networking provides real-time utility usage pattern providing data analytics aiding in decision making and better scheduling of utility storage and distribution.
In this report, MarketsandMarkets provides an in-depth study of the market trends, market sizing, competitive mapping, and market dynamics of the smart grid networking market. The trends, drivers, and the opportunities in the market distinctly indicate noteworthy growth in the coming years. The market is segmented by hardware, that is, cables, controllers, routers, smart meter communication modules, switches and other hardware; by software, that is, network performance monitoring management, IP address management, network traffic management, network device management, network configuration management, network security management and other software; by services, that is, consulting, network planning and design, network risk and security assessment, network maintenance and support service and other services; by geographical region, that is, North America, Europe, Asia-Pacific, Middle East and Africa, and Latin America.
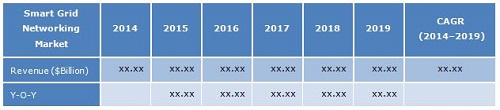
MarketsandMarkets forecasts the global smart grid networking market to grow from $7.12 billion in 2014 to $11.61 billion by 2019, at a Compound Annual Growth Rate (CAGR) of 10.3%. The table given below highlights the overall market size and Year-Over-Year (Y-O-Y) growth during the forecast period of 2014-2019.
Source: MarketsandMarkets Analysis
 Exclusive indicates content/data unique to MarketsandMarkets and not available with any competitors.
Table of Contents
1 Introduction (Page No.- 15)
1.1 Objectives of the Study
1.2 Report Description
1.3 Markets Covered
1.4 Stakeholders
1.5 Market Scope
2 Research Methodology (Page No.- 21)
2.1 Market Size Estimation
2.2 Market Share Estimation
2.2.1 Key Data Points Taken From Secondary Sources
2.2.2 Key Data Points From Primary Sources
2.2.2.1 Key Industry Insights
2.2.3 Assumptions
3 Executive Summary (Page No.- 28)
4 Premium Insights (Page No.- 33)
4.1 Attractive Market Opportunities
4.2 Market, By Components
4.3 Market in North America Region
4.4 Market Potential
4.5 Life Cycle Analysis, By Geography
5 Smart Grid Networking Market Overview (Page No.- 38)
5.1 Introduction
5.2 Evolution
5.3 Market Segmentation
5.3.1 Market By Hardware
5.3.2 Market By Software
5.3.3 Market By Services
5.4 Market Dynamics
5.4.1 Drivers
5.4.1.1 Growing Peak Hours Demand of Electricity
5.4.1.2 Increasing Share of Renewable Energy in Electricity
5.4.1.3 Limitations in Capacity Expansion
5.4.1.4 Environmental Concerns
5.4.2 Restraints
5.4.2.1 Regulatory Framework
5.4.3 Opportunities
5.4.3.1 Advanced Control and Analysis
5.4.3.2 Transport Application
5.4.4 Challenges
5.4.4.1 High Cost
5.4.4.2 Cyber Security
6 Smart Grid Networking Industry Trends (Page No.- 47)
6.1 Introduction
6.2 Value Chain Analysis
6.3 Need for Smart Grid Networks
6.4 Smart Grid Network Technologies
6.4.1 Introduction
6.4.2 Fiber Optics/Sdh/Ethernet
6.4.3 Broadband Power Line Carrier
6.4.4 Wimax
6.4.5 Wireless Mesh
6.4.6 Public Cellular Networks
6.5 Porter�s Five forces Analysis
6.5.1 Threat From New Entrants
6.5.2 Threat From Substitutes
6.5.3 Bargaining Power of Suppliers
6.5.4 Bargaining Power of Buyers
6.5.5 Intensity of Competitive Rivalry
6.6 Use Cases
7 Smart Grid Networking Market, By Hardware (Page No.- 54)
7.1 Introduction
7.2 Cables
7.3 Controllers
7.4 Routers
7.5 Smart Meter Communication Modules
7.6 Switches
7.7 Others
8 Smart Grid Networking Market, By Software (Page No.- 68)
8.1 Introduction
8.2 Network Performance Monitoring Management
8.3 IP Address Management
8.4 Network Traffic Management
8.5 Network Device Management
8.6 Network Configuration Management
8.7 Network Security Management
8.8 Others
9 Smart Grid Networking Market, By Services (Page No.- 83)
9.1 Introduction
9.2 Consulting
9.3 Network Planning, Design and Integration
9.4 Network Risk and Security Assessment
9.5 Network Maintenance and Support
9.6 Others
10 Smart Grid Networking Market, By Region (Page No.- 94)
10.1 Introduction
10.2 North America
10.3 Europe
10.4 Asia Pacific
10.5 Middle East and Africa
10.6 Latin America
11 Competitive Landscape (Page No.- 119)
11.1 Overview
11.2 Competitive Situation and Trends
11.2.1 New Product Launches
11.3 Agreements, Partnerships, Collaborations, & Joint Ventures
11.4 Merger and Acquisitions
12 Company Profiles (Page No.- 126)
12.1 Introduction
12.2 ABB
12.2.1 Business Overview
12.2.2 Products and Services
12.2.3 Key Strategy
12.2.4 Recent Developments
12.2.5 SWOT Analysis
12.2.6 MNM View
12.3 CISCO
12.3.1 Business Overview
12.3.2 Products and Services
12.3.3 Key Strategy
12.3.4 Recent Developments
12.3.5 SWOT Analysis
12.3.6 MNM View
12.4 Mitsubishi Electric
12.4.1 Business Overview
12.4.2 Products and Services
12.4.3 Key Strategy
12.4.4 Recent Developments
12.4.5 MNM View
12.5 Fujitsu
12.5.1 Business Overview
12.5.2 Products and Services
12.5.3 Key Strategy
12.5.4 Recent Developments
12.5.5 MNM View
12.6 General Electric
12.6.1 Business Overview
12.6.2 Products and Services
12.6.3 Key Strategy
12.6.4 Recent Developments
12.6.5 SWOT Analysis
12.6.6 MNM View
12.7 Huawei
12.7.1 Business Overview
12.7.2 Product and Services
12.7.3 Key Strategy
12.7.4 Recent Developments
12.7.5 MNM View
12.8 Itron
12.8.1 Business Overview
12.8.2 Products and Services
12.8.3 Key Strategy
12.8.4 Recent Developments
12.8.5 MNM View
12.9 Schneider Electric
12.9.1 Business Overview
12.9.2 Products and Services
12.9.3 Key Strategy
12.9.4 Recent Developments
12.9.5 SWOT Analysis
12.9.6 MNM View
12.10 Siemens AG
12.10.1 Business Overview
12.10.2 Products and Services
12.10.3 Key Strategy
12.10.4 Recent Developments
12.10.5 SWOT Analysis
12.10.6 MNM View
12.11 Silver Spring Networks
12.11.1 Business Overview
12.11.2 Products and Services
12.11.3 Key Strategy
12.11.4 Recent Developments
12.11.5 MNM View
13 Appendix (Page No.- 169)
13.1 Introducing RT: Real-Time Market Intelligence
13.2 Available Customizations
13.3 Related Reports
List of Tables (93 Tables)
Table 1 Global Smart Grid Networking Market: Assumptions
Table 2 Global Smart Grid Networking Market, 2014-2019 ($Million, Y-O-Y %)
Table 3 Growing Electricity Demand and Environmental Concerns Are Driving the Market
Table 4 Regulatory Framework is Restraining the Market Growth
Table 5 Smart Grid Network Presents A Bright Opportunity for Electric Vehicels
Table 6 Cyber Security and High Costs Are Major Challenges in the Market
Table 7 Smart Grid Networking Market , By Hardware, 2014�2019 ($Million)
Table 8 Smart Grid Networking Market, By Type, 2015-2019 (Y-O-Y %)
Table 9 Cables Market, By Region, 2014�2019 ($Million)
Table 10 Cables Market, By Region, 2015-2019 (Y-O-Y %)
Table 11 Controllers Market, By Region, 2014-2019 ($Million)
Table 12 Controllers, By Region, 2015-2019 (Y-O-Y %)
Table 13 Routers Market, By Region, 2014-2019 ($Million)
Table 14 Routers Market, By Region, 2015-2019 (Y-O-Y %)
Table 15 Smart Meter Communication Modules Market, By Region, 2014-2019 ($Million)
Table 16 Smart Meter Communication Modules Market, By Region, 2015-2019 (Y-O-Y %)
Table 17 Switches Market, By Region, 2014-2019 ($Million)
Table 18 Switches Market, By Region, 2015-2019 (Y-O-Y %)
Table 19 Others Market, By Region, 2014-2019 ($Million)
Table 20 Others Market, By Region, 2015-2019 (Y-O-Y %)
Table 21 Smart Grid Networking Market, By Software, 2014-2019 ($Million)
Table 22 Smart Grid Networking Market, By Software 2015-2019 (Y-O-Y %)
Table 23 Network Performance Monitoring Management Market, By Region, 2014-2019 ($Million)
Table 24 Network Performance Monitoring Management Market, By Region, 2015-2019 (Y-O-Y %)
Table 25 IP Address Management Market, By Region, 2014-2019 (Y-O-Y %)
Table 26 IP Address Management, By Region 2015-2019 (Y-O-Y %)
Table 27 Network Traffic Management Market, By Region, 2014-2019 ($Million)
Table 28 Network Traffic Management Market, By Region, 2015-2019 (Y-O-Y %)
Table 29 Network Device Management Market, By Region, 2014-2019 ($Million)
Table 30 Network Device Management Market, By Region, 2015-2019 (Y-O-Y %)
Table 31 Network Configuration Management Market, By Region, 2014-2019 ($Million)
Table 32 Network Configuration Management Market, By Region, 2015-2019 (Y-O-Y %)
Table 33 Network Security Management Market, By Region, 2014-2019 ($Million)
Table 34 Network Security Management Market, By Region, 2015-2019 (Y-O-Y %)
Table 35 Others Market, By Region, 2014-2019 ($Million)
Table 36 Others Market, By Region, 2015-2019 (Y-O-Y %)
Table 37 Smart Grid Networking: Market, By Service, 2014-2019 ($Million)
Table 38 Smart Grid Networking Market, By Service, 2015-2019 (Y-O-Y %)
Table 39 Consulting Market, By Region, 2014-2019 ($Million)
Table 40 Consulting Market, By Region, 2015-2019 (Y-O-Y %)
Table 41 Network Planning, Design and Integration Market, By Region, 2014-2019 ($Million)
Table 42 Network Planning, Design and Integration Market, By Region, 2015-2019 (Y-O-Y %)
Table 43 Network Risk and Security Assessment Market, By Region, 2014-2019 ($Million)
Table 44 Network Risk and Security Assessment Market, By Region, 2015-2019 (Y-O-Y %)
Table 45 Network Maintenance and Support Market, By Region, 2014-2019 ($Million)
Table 46 Network Maintenance and Support Market, By Region, 2015-2019 (Y-O-Y %)
Table 47 Others Market, By Region, 2014-2019 ($Million)
Table 48 Others Market, By Region, 2015-2019 (Y-O-Y %)
Table 49 Smart Grid Networking: Market, By Region, 2014-2019 ($Million)
Table 50 Smart Grid Networking Market, By Region, 2015-2019 (Y-O-Y %)
Table 51 North America Market, 2014-2019 ($Million)
Table 52 North America Market, 2015-2019 (Y-O-Y %)
Table 53 North America Market, By Hardware, 2014-2019 ($Million)
Table 54 North America Market, By Hardware, 2015-2019 (Y-O-Y %)
Table 55 North America Market, By Software, 2014-2019 ($Million)
Table 56 North America Market, By Software, 2015-2019 (Y-O-Y %)
Table 57 North America Market, By Service, 2014-2019 ($Million)
Table 58 North America Market, By Service, 2015-2019 (Y-O-Y %)
Table 59 Europe Market, 2014-2019 ($Million)
Table 60 Europe Market, 2015-2019 (Y-O-Y %)
Table 61 Europe Market, By Hardware, 2014-2019 ($Million)
Table 62 Europe Market, By Hardware, 2015-2019 (Y-O-Y %)
Table 63 Europe Market, By Software, 2014-2019 ($Million)
Table 64 Europe Market, By Software, 2015-2019 (Y-O-Y %)
Table 65 Europe Market, By Service, 2014-2019 ($Million)
Table 66 Europe Market, By Service, 2015-2019 (Y-O-Y %)
Table 67 APAC Market, 2014-2019 ($Million)
Table 68 APAC Market, 2015-2019 (Y-O-Y %)
Table 69 APAC Market, By Hardware, 2014-2019 ($Million)
Table 70 APAC Market, By Hardware, 2015-2019 (Y-O-Y %)
Table 71 APAC Market, By Software, 2014-2019 ($Million)
Table 72 APAC Market, By Software, 2015-2019 (Y-O-Y %)
Table 73 APAC Market, By Service, 2014-2019 ($Million)
Table 74 APAC Market, By Service, 2015-2019 (Y-O-Y %)
Table 75 MEA Market, 2014-2019 ($Million)
Table 76 MEA Market, 2015-2019 (Y-O-Y %)
Table 77 MEA Market, By Hardware, 2014-2019 ($Million)
Table 78 MEA Market, By Hardware, 2015-2019 (Y-O-Y %)
Table 79 MEA Market, By Software, 2014-2019 ($Million)
Table 80 MEA Market, By Software, 2015-2019 (Y-O-Y %)
Table 81 MEA Market, By Service, 2014-2019 ($Million)
Table 82 MEA Market, By Service, 2015-2019 (Y-O-Y %)
Table 83 Latin America Market, 2014-2019 ($Million)
Table 84 Latin America Market, 2015-2019 (Y-O-Y %)
Table 85 Latin America Market, By Hardware, 2014-2019 ($Million)
Table 86 Latin America Market, By Hardware, 2015-2019 (Y-O-Y %)
Table 87 Latin America Market, By Software, 2014-2019 ($Million)
Table 88 Latin America Market, By Software, 2015-2019 (Y-O-Y %)
Table 89 Latin America Market, By Service, 2014-2019 ($Million)
Table 90 Latin America Market, By Service, 2015-2019 (Y-O-Y %)
Table 91 New Product Launches, 2011-2014
Table 92 Agreements, Partnerships, Collaborations, & Joint Venture, 2011-2014
Table 93 Merger and Acquisitions, 2011-2014
List of Figures (72 Figures)
Figure 1 Stakeholders
Figure 2 Research Methodology
Figure 3 Smart Grid Networking Market Size Estimation Methodology: Bottom-Up Approach
Figure 4 Smart Grid Networking Market Size Estimation Methodology: Top-Down Approach
Figure 5 Break Down of Primary Interviews: By Company Type, Designation, & Region
Figure 6 Global Market Size, By Component (2014 Vs 2019)
Figure 7 Global Smart Grid Networking Hardware Market Size, By Type(2014 Vs 2019)
Figure 8 Global Smart Grid Networking Software Market, By Type (2014 Vs 2019)
Figure 9 Global Smart Grid Networking Services Market, By Type (2014 Vs 2019)
Figure 10 Global Market, By Hardware, 2014
Figure 11 Global Smart Grid Networking Market Size Share, 2014
Figure 12 Attractive Market Opportunities
Figure 13 Smart Grid Network Services Market to Grow At Fastest Rate Among the Components of Smart Grid Network
Figure 14 North America Holds the Maximum Share in the Market (2014)
Figure 15 Middle East & Africa Market to Grow Faster Than Other Regional Markets and North America to Remain the Biggest Market During the forecasted Period
Figure 16 Latin American Market Soon to Enter Exponential Growth Phase in Coming Years
Figure 17 Evolution of Smart Grids
Figure 18 Smart Grid Networking Market Segmentation: By Hardware
Figure 19 Market Segmentation: By Software
Figure 20 Market Segmentation: By Services
Figure 21 Smart Grid Networking Paves Way for Smart Cities and Connected Communities
Figure 22 Market: Drivers and Restraints
Figure 23 Value Chain Analysis (2014): Services Providers Play A Major Role
Figure 24 Need for Smart Grid Network
Figure 25 Porter's Five forces Analysis (2014)
Figure 26 Almost 90% of the Market Will Be Dominated By Smart Meter Communication Modules
Figure 27 Latin America Will Be the Lucrative Region for Cables Market Throughout the forecasted Period
Figure 28 North America Dominates Throughout the forecasted Period
Figure 29 Asia Pacific Will Be the Hottest Market for Router Deployments Among All the Regions
Figure 30 Smart Meter Communication Module Market to See Highest Growth Rate in Asia Pacific
Figure 31 Strong Focus towards Developing Network Infrastructure in APAC is Boosting Switches Market
Figure 32 Others in Middle East and Africa is Expected to Be Double By 2019
Figure 33 Network Configuration Management and Network Traffic Management Software Will Dominate the Market
Figure 34 Middle East & Africa Presents the Highest Growth Market for Network Performance Monitoring Management Software Figure 35 North America Lead the IP Address Management Software Market
Figure 36 Network Traffic Management Software to Witness High Growth in Middle East and Africa
Figure 37 Network Device Management Software is Expected to Experience Highest Growth in Middle East & Africa
Figure 38 Network Configuration Management Software to Witness Double-Digit Growth Across Latin America and Middle East & Africa
Figure 39 North America Dominates Throughout the forecasted Period
Figure 40 Network Bandwidth Management and Network Quality Management Software Are Expected to Experience Highest Growth in Middle East & Africa
Figure 41 Network Planning, Design & integration Dominates the Global Smart Grid Networking Services Market
Figure 42 Huge It Infrastructure Investments in Middle East & Africa is Fueling the Growth of Consulting Service Market
Figure 43 Network Planning, Design and Integration Service in Middle East & Africa is Expected to Double By 2019 Due to the Fuelled Domestic Demand
Figure 44 Network Risk and Security Assessment Service to Witness Double-Digit Growth Across Middle East & Africa
Figure 45 Network Maintenance and Support Service Market to Witness Double-Digit Growth Across All Geographies From 2014 to 2019
Figure 46 NA Has the Major Share of Other Service Segment
Figure 47 North America Will Lead the Market
Figure 48 Geographic Snapshot: Middle East & Africa is Emerging As A New Hotspot
Figure 49 Middle East & Africa: An Attractive Destination for Smart Grid Networking Hardware and Software
Figure 50 Smart Grid Networking Hardware Will Dominate the North America Market
Figure 51 Smart Grid Networking Hardware Market Will Overshadow the Smart Grid Networking Services Market in Europe
Figure 52 Asia Pacific Presents Huge Growth Opportunities for Smart Grid Networking Hardware Market
Figure 53 Emerging Markets of Middle East and Africa Presents High Growth Opportunities for Smart Grid Networking Providers
Figure 54 Latin America Smart Grid Networking Hardware Market is Expected to Become More Than Double of Smart Grid Networking Services Market By 2019
Figure 55 Companies Have Adopted Organic As Well As Inorganic Growth Strategies
Figure 56 ABB and Schneider Electric Grew At the Fastest Rate Between 2009 - 2013
Figure 57 Smart Grid Networking Market Evolution Framework-New Product Launches Has Fueled Growth and Innovation in 2013 and 2014
Figure 58 Battle for Market Share: New Product Launches Was the Key Strategy
Figure 59 Geographic Revenue Mix of top 5 Market Players
Figure 60 ABB: Business Overview
Figure 61 SWOT Analysis
Figure 62 CISCO: Business Overview
Figure 63 SWOT Analysis
Figure 64 Mitsubishi Electric: Business Overview
Figure 65 Fujitsu: Business Overview
Figure 66 General Electric: Business Overview
Figure 67 SWOT Analysis
Figure 68 Huawei: Business Overview
Figure 69 Itron: Business Overview
Figure 70 Schneider Electric: Business Overview
Figure 71 Siemens AG: Business Overview
Figure 72 Silver Spring Networks: Business Overview


Growth opportunities and latent adjacency in Smart Grid Networking Market