Smart Motors Market by Component (VSD, MCC, Motor), by Application (Industrial, Commercial, Automotive, Consumer Electronics, and Aerospace & Defense) and Geography - Analysis & Forecast to 2020


The global smart motors market is expected to reach USD 1.38 Billion by 2020 at a CAGR of 6.19% between 2015 and 2020.
The report aims at estimating the market size and future growth potential of the smart motors market based on different components and applications across regions. The base year considered for the study is 2014 and the market is forecast from 2015 to 2020. The market on the basis of component has been classified into variable speed drive, motor control center, and motors. Based on applications, the market has been segmented into industrial, commercial, automotive, consumer electronics, and aerospace & defense sectors. The market on the basis of geography has been segmented into the Americas, Europe, APAC, and RoW. Considering the increasing demand for smart motors in the industrial and commercial sectors, the growth of this market is estimated to be high. Also considering the technical benefits achieved using variable speed drives and intelligent motor controllers, the installation rate of smart motors is projected to increase by 2020.
The global smart motors market is expected to grow from USD 989.0 Million in 2014 to USD 1.38 Billion by 2020 at a CAGR of 6.19% between 2015 and 2020. The market is expected to grow substantially due to factors such as requirement of less on-site and wiring space, and cost reduction, while increasing the overall effectiveness of the equipment.
Industrial, commercial, automotive, consumer electronics, and aerospace & defense sectors are applications areas of smart motors. The application in the industrial sector accounted for a large share, followed by consumer electronics and commercial sectors in 2014. The industrial sector is expected to provide the highest growth potential for smart motors, followed by the commercial sector, during the forecast period. In commercial applications such as packaged and unitary air-conditioner systems and air distribution fans, the demand for variable speed fan control is likely to increase, thus offering huge growth potential for smart motor-equipped control systems. Smart motors find a large application across chilled water system compressors because of low energy consumption.
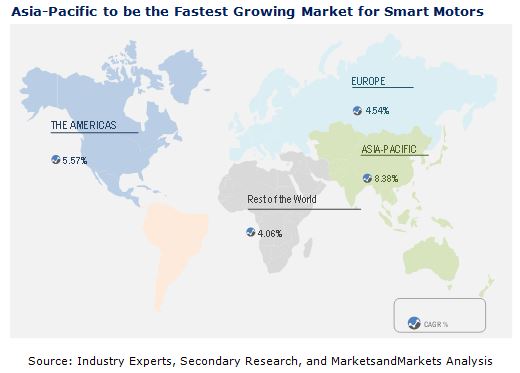
The Americas accounted for the largest share of the smart motors market in 2014, followed by Asia-Pacific and Europe. The North American region is expected to dominate the market in the Americas. The industrial sector is expected to be the fastest-growing market for smart motors, during the forecast period. Smart motors and related components such as variable speed drives and control ICs are used in several industrial applications such as automated machinery, industrial sewing machines, and stage lighting among others. This proves to be a driving factor for the market to grow in the industrial sector.
However many organizations still lack information about measures that reduce energy usage, installation of energy-efficient solutions, information on various energy-efficiency opportunities, and the technologies for improving the performance of the utilized energy. This acts as a restraint in the market growth, resulting in a low rate of implementation of smart motors. This report describes drivers, restraints, opportunities, and challenges pertaining to the smart motor market. Furthermore, it analyzes the current market scenario and forecasts the market till 2020, including the market segmentation based on components, applications, and geography.
Some of the major companies included in the report are Rockwell Automation, Inc. (U.S.), Moog, Inc. (U.S.), Fuji Electric Co. Ltd. (Japan), ABB Ltd. (Switzerland), General Electric (U.S.), Siemens AG (Germany), Schneider Electric SE (France), Technosoft SA (Switzerland), RobotShop, Inc. (Quebec), and Robeteq, Inc. (U.S.).
To speak to our analyst for a discussion on the above findings, click Speak to Analyst
 Exclusive indicates content/data unique to MarketsandMarkets and not available with any competitors.
Table of Contents
1 Introduction
1.1 Objectives of the Study
1.2 Market Definition
1.3 Market Scope
1.3.1 Markets Covered
1.4 Currency
1.5 Limitation
1.6 Stakeholders
2 Research Design
2.1 Market Size Estimation
2.1.1 Bottom-Up Approach
2.1.2 Top-Down Approach
2.2 Market Breakdown and Data Trangulation
2.3 Market Share Estimation
2.3.1 Key Data From Secondary Sources
2.3.2 Key Data From Primary Sources
2.4 Assumptions
3 Executive Summary
4 Premium Insights
4.1 Opportunities in the Smart Motors Market
4.2 Market—Top Application Segments
4.3 Market Based on Geography
4.4 APAC Dominated the Market
4.5 Global Market Size Based on Component (2014, 2015, and 2020)
5 Market Overview
5.1 Introduction
5.2 Market Segmentation
5.3 Market Dynamics
5.3.1 Drivers
5.3.1.1 Requirement of Less Onsite and Wiring Space
5.3.1.2 Cost Reduction While Increasing the Effectiveness of the Equipment
5.3.2 Restraints
5.3.2.1 Low Rate of Implementation
5.3.2.2 Additional Considerations for Variable Frequency Drives (VFD)
5.3.3 Opportunities
5.3.3.1 Increasing Scope in the Industrial Sector
5.3.3.2 Increasing Application Areas of Smart Motors
5.3.4 Challenges
5.3.4.1 Tedious Fault Detection Techniques
6 Industry Trends
6.1 Introduction
6.2 Value Chain Analysis
6.3 Porter’s Analysis
6.3.1 Threat of New Entrants
6.3.2 Threat of Substitutes
6.3.3 Bargaining Power of Suppliers
6.3.4 Bargaining Power of Buyers
6.3.5 Degree of Competition
7 Market, By Component
7.1 Introduction
7.2 Variable Speed Drive
7.3 Intelligent Motor Control Center
7.4 Motor
8 Market, By Application
8.1 Introduction
8.2 Industrial
8.3 Commercial
8.4 Automotive
8.5 Consumer Electronics
8.6 Aerospace & Defense
9 Market, By Geography
9.1 Introduction
9.2 The Americas
9.2.1 North America
9.2.2 South America
9.3 Europe
9.3.1 U.K.
9.3.2 Germany
9.3.3 France
9.3.4 Rest of Europe (RoE)
9.4 APAC
9.4.1 China
9.4.2 Japan
9.4.3 India
9.4.4 RoAPAC
9.5 Rest of the World (RoW)
9.5.1 Middle East
9.5.2 Africa
10 Competitive Landscape
10.1 Overview
10.2 Market Share Analysis, Smart Motors Market
10.3 Competitive Situations and Trends
10.3.1 New Product Launches
11 Company Profiles
11.1 Rockwell Automation, Inc
11.1.1 Business Overview
11.1.2 Products Offered
11.1.3 Recent Developments
11.1.3.1 MnM View
11.1.3.1.1 SWOT Analysis
11.2 Moog Animatics
11.2.1 Business Overview
11.2.2 Products Offered
11.2.2.1 MnM View
11.2.2.1.1 SWOT Analysis
11.3 Siemens AG
11.3.1 Business Overview
11.3.2 Products Offered
11.3.2.1 MnM View
11.3.2.1.1 SWOT Analysis
11.4 Robotshop, Inc.
11.4.1 Business Overview
11.4.2 Products Offered
11.5 General Electric Co.34
11.5.1 Business Overview
11.5.2 Products Offered
11.5.3 Recent Developments
11.5.3.1 MnM View
11.5.3.1.1 SWOT Analysis
11.6 Roboteq, Inc.
11.6.1 Business Overview
11.6.2 Products Offered
11.6.3 Recent Developments
11.7 ABB Ltd.
11.7.1 Business Overview
11.7.2 Products Offered
11.7.3 Recent Developments
11.7.3.1 MnM View
11.7.3.1.1 SWOT Analysis
11.8 FUJI Electric Co. Ltd.
11.8.1 Business Overview
11.8.2 Products Offered
11.9 Technosoft Sa
11.9.1 Business Overview
11.9.2 Products Offered
11.9.3 Recent Developments
11.10 Schneider Electric SE
11.10.1 Business Overview
11.10.2 Products Offered
12 Appendix
12.1 Insights of Industry Experts
12.2 Discussion Guide
12.3 Introducing RT: Real Time Market Intelligence
12.4 Available Customizations
12.5 Related Reports
List of Tables (69 Tables)
Table 1 Global Smart Motors Market Size, By Component, 2013–2020 (USD Million)
Table 2 Americas:Smart Motors Market Size, By Application, 2013–2020 (USD Million)
Table 3 Driver Analysis
Table 4 Restraint Analysis
Table 5 Market, By Component, 2013–2020 (USD Million)
Table 6 VSD: Smart Motors Market , By Geography, 2013–2020 (USD Million)
Table 7 VSD: Market in the Americas, By Region, 2013–2020 (USD Million)
Table 8 VSD: Market in Europe, By Geography, 2013–2020 (USD Million)
Table 9 VSD: Market in APAC, By Geography, 2013–2020 (USD Million)
Table 10 VSD: Market in RoW, By Region, 2013–2020 (USD Million)
Table 11 MCC: Smart Motors Market, By Region, 2013–2020 (USD Million)
Table 12 MCC: Market in the Americas , By Region, 2013–2020 (USD Million)
Table 13 MCC: Market in Europe, By Geography, 2013–2020 (USD Million)
Table 14 MCC: Market in APAC , By Geography, 2013–2020 (USD Million)
Table 15 MCC: Market in RoW , By Region, 2013–2020 (USD Million)
Table 16 Motor: Smart Motors Market , By Region, 2013–2020 (USD Million)
Table 17 Motor: Market in the Americas , By Region, 2013–2020 (USD Million)
Table 18 Motor: Market in Europe, By Geography, 2013–2020 (USD Million)
Table 19 Motor: Market in APAC, By Geography, 2013–2020 (USD Million)
Table 20 Motor: Market in RoW, By Region, 2013–2020 (USD Million)
Table 21 Market Size, By Application, 2013-2020 (USD Million)
Table 22 Industrial Market Size, By Geography, 2013–2020 (USD Million)
Table 23 Americas: Smart Motors Market Size for Industrial Application, By Region, 2013–2020 (USD Million)
Table 24 Europe: Smart Motors Market Size for the Industrial Application, By Geography, 2013–2020 (USD Million)
Table 25 APAC: Market Size for the Industrial Application, By Geography, 2013–2020 (USD Million)
Table 26 RoW: Market Size for the Industrial Application, By Region, 2013–2020 (USD Million)
Table 27 Market Size for the Commercial Application, By Region, 2013–2020 (USD Million)
Table 28 Americas: Smart Motors Market Size for the Commercial Application, By Region, 2013-2020 (USD Million)
Table 29 Europe: Market Size for the Commercial Application, By Geography, 2013–2020 (USD Million)
Table 30 APAC: Smart Motors Market Size for the Commercial Application, By Geography, 2013–2020 (USD Million)
Table 31 RoW: Smart Motors Market Size for the Commercial Application, By Region, 2013–2020 (USD Million)
Table 32 Market Size for the Automotive Application, By Region, 2013–2020 (USD Million)
Table 33 Americas: Smart Motors Market Size for the Automotive Application, By Region, 2013–2020 (USD Million)
Table 34 Europe: Market Size for the Automotive Application, By Geography, 2013–2020 (USD Million)
Table 35 APAC: Smart Motors Market Size for the Automotive Application, By Geography, 2013–2020 (USD Million)
Table 36 RoW: Smart Motors Market Size for the Automotive Application, By Region, 2013–2020 (USD Million)
Table 37 Market Size for the Consumer Electronics Application, By Region, 2013–2020 (USD Million)
Table 38 Americas: Market Size for the Consumer Electronics Application, By Region, 2013–2020 (USD Million)
Table 39 Europe: Smart Motors Market Size for the Consumer Electronics Application, By Geography, 2013–2020 (USD Million)
Table 40 APAC: SmarMarket Size for the Consumer Electronics Application, By Geography, 2013–2020 (USD Million)
Table 41 RoW: Smart Motors Market Size for the Consumer Electronics Application, By Region, 2013–2020 (USD Million)
Table 42 Market Size for the Aerospace & Defense Application, By Region, 2013–2020 (USD Million)
Table 43 Americas: Market Size for the Aerospace & Defense Application, By Region, 2013–2020 (USD Million)
Table 44 Europe: Smart Motors Market Size for the Aerospace & Defense Application, By Geography, 2013–2020 (USD Million)
Table 45 APAC: Smart Motors Market Size for the Aerospace & Defense Application, By Region, 2013–2020 (USD Million)
Table 46 RoW: Market Size for the Aerospace & Defense Application, By Geography, 2013–2020 (USD Million)
Table 47 Market Size, By Region, 2013–2020 (USD Million)
Table 48 Americas: Smart Motors Market Size, By Region, 2013–2020 (USD Million)
Table 49 Americas: Market Size, By Application, 2013–2020 (USD Million)
Table 50 North America: Smart Motors Market Size, By Application, 2013–2020 (USD Million)
Table 51 South America: Market Size, By Application, 2013–2020 (USD Million)
Table 52 Europe: Smart Motors Market Size, By Geography, 2013–2020 (USD Million)
Table 53 Europe: Market Size, By Application, 2013–2020 (USD Million)
Table 54 U.K: Smart Motors Market Size, By Application, 2013–2020 (USD Million)
Table 55 Germany: Smart Motors Market Size, By Application, 2013–2020 (USD Million)
Table 56 France: Market Size, By Application, 2013–2020 (USD Million)
Table 57 RoE: Smart Motors Market Size, By Application, 2013–2020 (USD Million)
Table 58 APAC: Market Size, By Geography, 2013–2020 (USD Million)
Table 59 APAC: Smart Motors Market Size, By Application, 2013–2020 (USD Million)
Table 60 China: Market Size, By Application, 2013–2020 (USD Million)
Table 61 Japan: Smart Motors Market Size, By Application, 2013–2020 (USD Million)
Table 62 India: Smart Motormarket Size, By Application, 2013–2020 (USD Million)
Table 63 RoAPAC: Smart Motors Market Size, By Application, 2013–2020 (USD Million)
Table 64 RoW: Market Size, By Region, 2013–2020 (USD Million)
Table 65 RoW: Market Size, By Application, 2013–2020 (USD Million)
Table 66 Middle East: Smart Motors Market Size, By Application, 2013–2020 (USD Million)
Table 67 Africa: Market Size, By Application, 2013–2020 (USD Million)
Table 68 Global Market Ranking, By Key Player, 2014
Table 69 New Product Launches, 2013-2015
List of Figures (44 Figures)
Figure 1 Markets Covered
Figure 2 Market Segments
Figure 3 Years Considered for the Study
Figure 4 Smart Motors Market: Research Design
Figure 5 Market Size Estimation Methodology: Bottom-Up Approach
Figure 6 Market Size Estimation Methodology: Top-Down Approach
Figure 7 Market: Data Triangulation Model
Figure 8 Market,By Application, Snapshot (2013–2020): the Industrial Application Expected to Witness A High Growth
Figure 9 Market, By Geography, Snapshot (2013 vs 2020): APAC to Witness the Highest Growth During the Forecast Period
Figure 10 Attractive Market Opportunities for the Market (2015–2020)
Figure 11 Industrial Application Expected to Hold the Largest Market Share During the Forecast Period
Figure 12 North America Held the Largest Share in the Market
Figure 13 India and China Expected to Grow at the Highest Rate By 2020
Figure 14 Motors Held the Largest Share in the Global Market on the Basis of Component
Figure 15 Drivers, Restraints, Opportunities, and Challenges for the Smart Motor Market
Figure 16 Value Chain Analysis
Figure 17 Porter’s Analysis
Figure 18 Porter’s Analysis: Smart Motors Market
Figure 19 Threat of New Entrants
Figure 20 Threat of Substitutes
Figure 21 Bargaining Power of Suppliers
Figure 22 Bargaining Power of Buyers
Figure 23 Degree of Competition
Figure 24 Smart Motor Market, By Application (USD Million)
Figure 25 Geographic Snapshot of the Smart Motors Market (2015–2020)
Figure 26 Americas: Smart Motors Market Snapshot
Figure 27 U.K. Held the Largest Share of the European Smart Motors Market
Figure 28 APAC: Market Snapshot—China is the Most Lucrative Market
Figure 29 Companies Adopted New Product Launches and Partnerships as the Key Growth Strategies Between 2013 and 2015
Figure 30 Rockwell Automation, Inc.: Company Snapshot
Figure 31 Rockwell Automation, Inc: SWOT Analysis
Figure 32 Moog, Inc.: Company Snapshot
Figure 33 Moog Animatics: SWOT Analysis
Figure 34 Siemens AG: Company Snapshot
Figure 35 Siemens AG: SWOT Analyis
Figure 36 Robotshop, Inc.: Company Snapshot
Figure 37 General Electric Company: Company Snapshot
Figure 38 General Electric Company: SWOT Analysis
Figure 39 Roboteq, Inc.: Company Snapshot
Figure 40 ABB Ltd.: Company Snapshot
Figure 41 ABB Ltd.: SWOT Analysis
Figure 42 FUJI Electric Co. Ltd.: Company Snapshot
Figure 43 Technosoft Sa: Company Snapshot
Figure 44 Schneider Electric SE: Company Snapshot
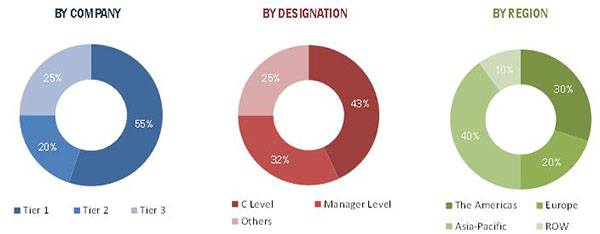
The research methodology used to estimate and forecast the smart motors market began with capturing data on key vendor revenue through the secondary research. The vendor offerings have also been taken into consideration to determine the market segmentation. The bottom-up procedure has been employed to arrive at the overall size of the global market from the revenue of key players in the market. After arriving at the overall market size, the total market has been split into several segments and sub-segments which have then been verified through the primary research by conducting extensive interviews with key people such as CEOs, VPs, directors, and executives. The market breakdown and data triangulation procedure has been employed to complete the overall market engineering process and arrive at the exact statistics for all segments and sub-segments. The breakdown of profiles of primary is depicted in the below figure:
To know about the assumptions considered for the study, download the pdf brochure
The smart motor ecosystem includes component manufacturers and suppliers, motor manufacturers/integrators, smart motor suppliers, distributors, and end users, as important elements.
The smart motor ecosystem comprises major market players such as Rockwell Automation, Inc. (U.S.), Moog, Inc. (U.S.), Fuji Electric Co. Ltd. (Japan), ABB Ltd. (Switzerland), General Electric (U.S.), Siemens AG (Germany), Schneider Electric SE (France), Technosoft SA (Switzerland), RobotShop, Inc. (Quebec), and Robeteq, Inc. (U.S.).
Target Audience of the Report:
The intended audience for this report includes:
- Smart motor components and products providers
- Smart motor product integrators
- Research organizations and manufacturing companies
- Energy conservation related associations, organizations, forums, and alliances
- Government, commercial institutes, and industrial plants
- Venture capitalists, private equity firms, and startup companies
- Distributors and traders
- Forums, alliances, and associations
- End users who want to know more about smart motors and latest technological developments in this market
Scope of the Report
The research report segments the smart motor market into following submarkets:
-
By Application:
- Industrial
- Commercial
- Automotive
- Consumer Electronics
- Aerospace & Defense
-
By Component:
- Variable Speed Drive
- Motor Control Center
- Motor
Available customizations:
With the given market data, MarketsandMarkets offers customizations as per the company’s specific needs. The following customization options are available for the report:
Market Analysis
- Further breakdown of the smart motor applications market
Company Information
- Detailed analysis and profiling of additional market players (up to five)


Growth opportunities and latent adjacency in Smart Motors Market