Smart Solar Market by Solutions (Network Monitoring, Meter Data Management, Analytics, SCADA, Remote Metering, Asset Management), Services (Consulting, Demand Response), Application (Commercial & Industrial, Residential) - Global Forecast to 2020


[144 Pages Report] The smart solar market is estimated to grow from USD 6.47 Billion in 2015 to USD 13.26 Billion by 2020, at a Compound Annual Growth Rate (CAGR) of 15.4% during the forecast period.
The deployment of smart solar solutions helps users to minimize their electricity expenses and increase the efficiency of solar components by real-time monitoring and communication. The report aims at estimating the market size and future growth potential of the market across different segments, such as solutions, services, applications, verticals, and regions. The base year considered for the study is 2014 and the market size forecast is from 2015 to 2020. With the increasing adoption of green energy and smart cities initiatives, the demand for smart solar solutions has grown tremendously across all the countries. Regulatory mandates across North America, Europe, and China are also driving this market. For the forecast period, smart solar market is expected to grow at a moderate pace. Presently, North America is the largest market for smart solar services.
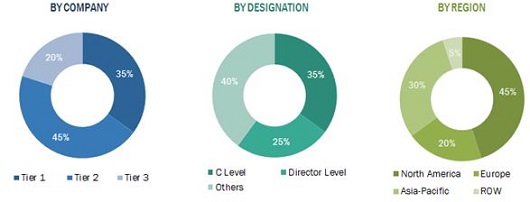
The research methodology used to estimate and forecast the smart solar market begins with capturing data on key vendor revenues through secondary research. The vendor offerings are also taken into consideration to determine market segmentation. The bottom-up procedure was employed to arrive at the overall market size of the global market from the revenue of the key players in the market. After arriving at the overall market size, the total market was split into several segments and sub-segments, which were then verified through primary research by conducting extensive interviews with key industry personnel, such as CEOs, VPs, Directors, and Executives. The data triangulation and market breakdown procedures were employed to complete the overall market engineering process and to arrive at the exact statistics for all segments and sub-segments. The breakdown of profiles of primary discussion participants is depicted in the below figure:
The smart solar ecosystem comprises device vendors, service providers, smart solution vendors, and network providers. Some of the key players that offer smart solar solutions and services are ABB Group, GE Power, Itron Inc., Schneider Electric, Siemens AG, Echelon Corporation, Landis+GYR AG, Sensus USA Inc., Silver Spring Networks Inc., and Urban Green Energy International.
Key Target audience for Smart Solar Market
- Solar companies
- Market Operators (Retail Energy Suppliers)
- Distribution System Operators
- Energy Service Companies (ESCOs)
- Demand Response Providers
- Commercial & Industrial (C&I) Customers
- Residential Customers
- Metering Operators
- National Regulatory Authorities
Scope of the Smart Solar Market Research Report
The research report categorizes the market to forecast the revenues and analyze the trends in each of the following sub-segments:
By Device
- Smart Solar Meters
- IntelliGrid
- RFID
By Solution
- Asset Management
- Network Monitoring
- Meter Data Management
- Analytics
- SCADA
- Remote Metering
- Outage Management
By Service
- Consulting
- System Integration and Deployment
- Support and Maintenance
- Demand Response
By Application
- C&I
- Residential
By Industry Sectors
- Government
- Utilities
- Healthcare
- Construction
- Education
- Agriculture
- Others
By Region
- North America
- Europe
- Asia-Pacific (APAC)
- Middle East and Africa (MEA)
- Latin America
Available Customizations
With the given market data, MarketsandMarkets offers customization as per the company�s specific requirements. The following customization options are available for the report:
Product Analysis
- Product matrix provides a detailed information and product comparison
Geographic Analysis
- Further breakdown of the Europe smart solar market
- Further breakdown of the APAC market
- Further breakdown of the MEA market
- Further breakdown of the Latin America market
Company Information
- Detailed analysis and profiling of additional market players
MarketsandMarkets forecast the smart solar market size to grow from USD 6.47 Billion in 2015 to USD 13.26 Billion by 2020, at a compound annual growth rate (CAGR) of 15.4%. Strict mandates of regulatory bodies has led the organizations to upgrade to the upcoming technological solutions, such as analytics and real-time monitoring. This acts as a primary driving factor for the market as solar energy helps in reducing the dependence on conventional sources of energy which are depleting. Other driving forces include growing need for energy efficiency and high electricity tariffs.
The smart solar market is broadly classified by application into Commercial & Industrial (C&I) and residential consumers. Compared to residential application, the C&I segment is experiencing high adoption as the initial cost for deployment of smart solar solutions and services is high, thereby limiting the application in investor owned utilities. Due to budgetary constraint, residential consumers are hesitant in investing in smart solar solutions even when the penetration of traditional solar solutions is high in residential segment.
Asset management is expected to dominate the solution segment in the smart solar market during the forecast period. This growth is driven due to technological advancement and strict regulatory mandates across North America and Europe. Meter Data Management (MDM) is expected to witness the highest growth due to the growing roll-outs of smart meters and smart grids. Technological innovation has led to additional functionality of MDM to support more business processes across the utility value chain such as customer billing, credit management, and meter asset management, which is also responsible for the growth of MDM solution.
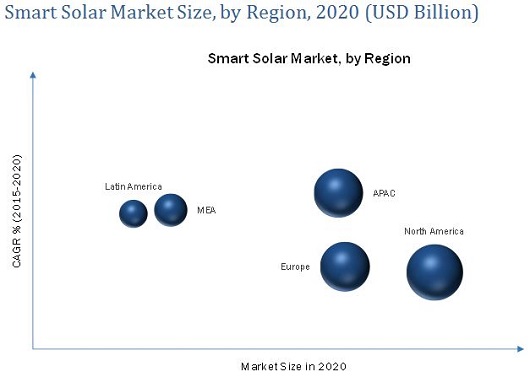
The smart solar market is segmented across five regions, namely, North America, Asia-Pacific (APAC), Europe, Middle East and Africa (MEA), and Latin America. The analysis shows that the spending on smart solar is increasing globally due to the increasing Information and Communications Technology (ICT) integration across different verticals, especially in developing regions. North America is projected to dominate the market during the forecast period due to technological advancements and early adoption of smart solar solutions and services in the region. The APAC market is expected to grow at the highest CAGR between 2015 and 2020. The primary driving forces for this growth are huge technological spending and penetration of meter and component manufacturing industries in countries such as China, India, and Japan.
The adoption of colocation solutions and services is still in the introductory phase in the developing regions, such as MEA and Latin America. Therefore, the initial start-up cost prevents several organizations in these regions from adopting smart solar solutions and services. This acts as a major restraining factor for the growth of the smart solar market. However, worldwide increase in the IT spending is expected to provide significant growth opportunities. On a strategic front, many companies are utilizing different growth strategies, such as mergers & acquisitions, partnerships & collaborations, and product development to increase their share in the market. Some of the major technology vendors include ABB Group, GE Power, Itron, Inc., Schneider Electric, and Siemens AG.
 Exclusive indicates content/data unique to MarketsandMarkets and not available with any competitors.
Table of Contents
1 Introduction (Page No. - 14)
1.1 Objectives of the Study
1.2 Market Definition
1.3 Market Scope
1.3.1 Markets Covered
1.3.2 Years Considered in the Report
1.4 Currency
1.5 Limitations
1.6 Stakeholders
2 Research Methodology (Page No. - 17)
2.1 Introduction
2.1.1 Secondary Data
2.1.1.1 Key Data From Secondary Sources
2.1.2 Primary Data
2.1.2.1 Key Data From Primary Sources
2.1.2.2 Key Industry Insights
2.1.2.3 Breakdown of Primaries
2.2 Market Size Estimation
2.2.1 Bottom-Up Approach
2.2.2 Top-Down Approach
2.3 Market Breakdown and Data Triangulation
2.4 Research Assumptions and Limitations
2.4.1 Assumptions
2.4.2 Limitations
3 Executive Summary (Page No. - 26)
4 Premium Insights (Page No. - 30)
4.1 Attractive Market Opportunities
4.2 Smart Solar Market, By Region, 2015 vs. 2020
4.3 Market, By Service
4.4 Market, By Industry Sector and By Region
4.5 Lifecycle Analysis, By Region
4.6 Market Investment Scenario
5 Market Overview (Page No. - 35)
5.1 Introduction
5.2 Evolution
5.3 Market Segmentation
5.3.1 By Device
5.3.2 By Solution
5.3.3 By Service
5.3.4 By Application
5.3.5 By Industry Sector
5.3.6 By Region
5.4 Market Dynamics
5.4.1 Drivers
5.4.1.1 Increasing Adoption of Green Energy and the Emergence of Smart Cities
5.4.1.2 High Electricity Tariffs
5.4.1.3 Regulatory Compliance
5.4.2 Restraints
5.4.2.1 High Initial Cost
5.4.2.2 Reducing Subsidies
5.4.3 Opportunities
5.4.3.1 Evolving Solar Industry
5.4.3.2 Increasing Environmental Awareness and Technological Evolution
5.4.4 Challenges
5.4.4.1 Low Initial Return on Investment (RoI)
6 Industry Trends (Page No. - 43)
6.1 Introduction
6.2 Value Chain Analysis
6.3 Porter�s Five Forces Analysis
6.3.1 Threat of New Entrants
6.3.2 Threat of Substitutes
6.3.3 Bargaining Power of Suppliers
6.3.4 Bargaining Power of Buyers
6.3.5 Intensity of Rivalry
6.4 Strategic Benchmarking
7 Market Analysis, By Device (Page No. - 49)
7.1 Introduction
7.1.1 Smart Solar Meters
7.1.1.1 AMR Meters
7.1.1.2 Ami Meters
7.1.2 IntelliGrid
7.1.3 RFID
8 Smart Solar Market Analysis, By Solution (Page No. - 51)
8.1 Introduction
8.2 Asset Management
8.3 Network Monitoring
8.4 Meter Data Management
8.5 Analytics
8.6 Supervisory Control and Data Acquisition (SCADA)
8.7 Remote Metering
8.8 Outage Management
9 Market Analysis, By Service (Page No. - 59)
9.1 Introduction
9.2 Consulting Services
9.3 System Integration and Deployment Services
9.4 Support and Maintenance Services
9.5 Demand Response Services
10 Smart Solar Market Analysis, By Application (Page No. - 65)
10.1 Introduction
10.2 Commercial and Industrial
10.3 Residential
11 Market Analysis, By Industry Sector (Page No. - 69)
11.1 Introduction
11.2 Government
11.3 Utilities
11.4 Healthcare
11.5 Construction
11.6 Education
11.7 Agriculture
11.8 Others
12 Geographic Analysis (Page No. - 77)
12.1 Introduction
12.2 North America
12.2.1 United States (U.S.)
12.2.2 Canada
12.3 Europe
12.4 Asia-Pacific
12.5 Middle East and Africa
12.6 Latin America
13 Competitive Landscape (Page No. - 100)
13.1 Overview
13.2 Portfolio Comparison
13.3 Competitive Situation and Trends
13.4 Partnerships, Agreements, and Collaborations
13.5 New Product Launches
13.6 Business Expansions
13.7 Mergers and Acquisitions
14 Company Profiles (Page No. - 106)
(Overview, Products & Services, Strategies & Insights, Developments and MnM View)*
14.1 Introduction
14.2 Geographic Revenue Mix
14.3 ABB Group
14.4 GE Power
14.5 Itron Inc.
14.6 Schneider Electric
14.7 Siemens AG
14.8 Echelon Corporation
14.9 Silver Spring Networks Inc.
14.10 Landis+GYR AG
14.11 Sensus USA, Inc.
14.12 Urban Green Energy (UGE) International
*Details on Overview, Products & Services, Strategies & Insights, Developments and MnM View Might Not Be Captured in Case of Unlisted Companies.
15 Appendix (Page No. - 138)
15.1 Insight of Industry Experts
15.2 Discussion Guide
15.3 Introducing RT: Real-Time Market Intelligence
15.4 Available Customizations
15.5 Related Reports
List of Tables (67 Tables)
Table 1 Smart Solar Market Size, By Type, 2015�2020 (USD Billion)
Table 2 Market Size, By Solution, 2013-2020 (USD Million)
Table 3 Smart Solar Solutions Market Size, By Region, 2013�2020 (USD Million)
Table 4 Asset Management: Market Size, By Region,2013�2020 (USD Million)
Table 5 Network Monitoring: Market Size, By Region,2013�2020 (USD Million)
Table 6 Meter Data Management: Market Size, By Region,2013�2020 (USD Million)
Table 7 Analytics: Market Size, By Region, 2013�2020 (USD Million)
Table 8 SCADA: Market Size, By Region, 2013�2020 (USD Million)
Table 9 Remote Metering: Market Size, By Region,2013�2020 (USD Million)
Table 10 Outage Management: Market Size, By Region,2013�2020 (USD Million)
Table 11 Smart Solar Market Size, By Service, 2013-2020 (USD Million)
Table 12 Smart Solar Services Market Size, By Region, 2013�2020 (USD Million)
Table 13 Consulting Services: Market Size, By Region,2013�2020 (USD Million)
Table 14 System Integration and Deployment Services: Market Size, By Region, 2013�2020 (USD Million)
Table 15 Support and Maintenance Services: Market Size, By Region, 2013�2020 (USD Million)
Table 16 Demand Response Services: Market Size, By Region,2013�2020 (USD Million)
Table 17 Smart Solar Market Size, By Application, 2013�2020 (USD Million)
Table 18 Commercial and Industrial: Market Size, By Region,2013�2020 (USD Million)
Table 19 Residential: Market Size, By Region,2013-2020 (USD Million)
Table 20 Market Size, By Industry Sector, 2013-2020 (USD Million)
Table 21 Government: Market Size, By Region,2013�2020 (USD Million)
Table 22 Utilities: Market Size, By Region, 2013�2020 (USD Million)
Table 23 Healthcare: Market Size, By Region,2013�2020 (USD Million)
Table 24 Construction: Market Size, By Region,2013�2020 (USD Million)
Table 25 Education: Market Size, By Region, 2013�2020 (USD Million)
Table 26 Agriculture: Market Size, By Region,2013�2020 (USD Million)
Table 27 Others: Market Size, By Region, 2013�2020 (USD Million)
Table 28 Smart Solar Market Size, By Region, 2013�2020 (USD Billion)
Table 29 North America: Market Size, By Country,2013�2020 (USD Million)
Table 30 North America: Market Size, By Type,2013�2020 (USD Million)
Table 31 North America: Market Size, By Solution,2013�2020 (USD Million)
Table 32 North America: Market Size, By Service,2013�2020 (USD Million)
Table 33 North America: Market Size, By Industry Sector ,2013�2020 (USD Million)
Table 34 United States: Smart Solar Market Size, By Type,2013�2020 (USD Million)
Table 35 United States: Market Size, By Solution,2013�2020 (USD Million)
Table 36 United States: Market Size, By Service,2013�2020 (USD Million)
Table 37 United States: Market Size, By Application,2013�2020 (USD Million)
Table 38 United States: Market Size, By Industry Sector,2013�2020 (USD Million)
Table 39 Canada: Market Size, By Type, 2013�2020 (USD Million)
Table 40 Canada: Market Size, By Solution, 2013�2020 (USD Million)
Table 41 Canada: Market Size, By Service, 2013�2020 (USD Million)
Table 42 Canada: Market Size, By Application,2013�2020 (USD Million)
Table 43 Canada: Market Size, By Industry Sector,2013�2020 (USD Million)
Table 44 Europe: Smart Solar Market Size, By Type, 2013�2020 (USD Million)
Table 45 Europe: Market Size, By Solution, 2013�2020 (USD Million)
Table 46 Europe: Market Size, By Service, 2013�2020 (USD Million)
Table 47 Europe: Market Size, By Application,2013�2020 (USD Million)
Table 48 Europe: Market Size, By Industry Sector,2013�2020 (USD Million)
Table 49 Asia-Pacific: Market Size, By Type, 2013�2020 (USD Million)
Table 50 Asia-Pacific: Market Size, By Solution,2013�2020 (USD Million)
Table 51 Asia-Pacific: Market Size, By Service,2013�2020 (USD Million)
Table 52 Asia-Pacific: Market Size, By Application,2013�2020 (USD Million)
Table 53 Asia-Pacific: Market Size, By Industry Sector,2013�2020 (USD Million)
Table 54 Middle East and Africa: Smart Solar Market Size, By Type,2013�2020 (USD Million)
Table 55 Middle East and Africa: Market Size, By Solution,2013�2020 (USD Million)
Table 56 Middle East and Africa: Market Size, By Service,2013�2020 (USD Million)
Table 57 Middle East and Africa: Market Size, By Application,2013�2020 (USD Million)
Table 58 Middle East and Africa: Market Size, By Industry Sector, 2013�2020 (USD Million)
Table 59 Latin America: Market Size, By Type,2013�2020 (USD Million)
Table 60 Latin America: Market Size, By Solution,2013�2020 (USD Million)
Table 61 Latin America: Market Size, By Service,2013�2020 (USD Million)
Table 62 Latin America: Market Size, By Application,2013�2020 (USD Million)
Table 63 Latin America: Market Size, By Industry Sector,2013�2020 (USD Million)
Table 64 Partnerships, Agreements, and Collaborations, 2013�2015
Table 65 New Product Launches, 2013�2015
Table 66 Business Expansions, 2013�2015
Table 67 Mergers and Acquisitions, 2014�2015
List of Figures (48 Figures)
Figure 1 Global Smart Solar Market: Research Design
Figure 2 Market Size Estimation Methodology: Bottom-Up Approach
Figure 3 Market Size Estimation Methodology: Top-Down Approach
Figure 4 Market Breakdown and Data Triangulation
Figure 5 Smart Solar Market Expected to Grow Owing to Increasing Adoption of Green Energy During the Forecast Period
Figure 6 Top Three Segments for the Market During The Forecast Period
Figure 7 North America is Expected to Hold the Largest Market Share in 2015
Figure 8 Growing Adoption of Green Energy is Driving the Market Towards Growth
Figure 9 Asia-Pacific is Expected to Witness the Highest Growth Rate During the Forecast Period
Figure 10 Consulting to Grow at the Highest CAGR in the Smart Solar Market
Figure 11 Utilities Sector is Expected to Lead the Smart Solar Market in Terms of Market Share in 2015
Figure 12 Evolution of Market
Figure 13 Smart Solar Market Segmentation: By Device
Figure 14 Market Segmentation: By Solution
Figure 15 Market Segmentation: By Service
Figure 16 Market Segmentation: By Application
Figure 17 Market Segmentation: By Industry Sector
Figure 18 Market Segmentation: By Region
Figure 19 Market: Value Chain Analysis
Figure 20 Smart Solar Market: Porter�s Five Forces Analysis
Figure 21 Companies Adopt Different Strategies to Gain Competitive Advantage
Figure 22 Asset Management is Expected to Lead the Smart Solar Solutions Market in Terms of Market Size During the Forecast Period
Figure 23 Majority of the Market is Expected to Be Dominated By System Integration and Deployment During the Forecast Period
Figure 24 Residential Segment is Expected to Grow at A Higher CAGR During the Forecast Period
Figure 25 Utilities Sector is Expected to Dominate the Market During the Forecast Period
Figure 26 Asia-Pacific: an Attractive Destination for the Smart Solar Market
Figure 27 Asia-Pacific is Expected to Grow at the Fastest Rate During the Forecast Period
Figure 28 Regional Snapshot: Asia-Pacific as A Hotspot During the Period2015�2020
Figure 29 North America Market Snapshot
Figure 30 Asia-Pacific Market Snapshot
Figure 31 Companies Adopted Partnership, Agreement, and Collaboration as the Key Growth Strategy Between 2013 and 2015
Figure 32 Smart Solar Market: Portfolio Comparison
Figure 33 Market Evaluation Framework
Figure 34 Battle for Market Share: Agreements, Partnerships and Collaborations Was the Key Strategy Adopted By Companies in the Smart Solar Market Between 2013 and 2015
Figure 35 Geographic Revenue Mix of the Top 5 Market Players
Figure 36 ABB Group: Company Snapshot
Figure 37 ABB Group: SWOT Analysis
Figure 38 GE Power: Company Snapshot
Figure 39 GE Power: SWOT Analysis
Figure 40 Itron Inc.: Company Snapshot
Figure 41 Itron Inc.: SWOT Analysis
Figure 42 Schneider Electric: Company Snapshot
Figure 43 Schneider Electric: SWOT Analysis
Figure 44 Siemens AG: Company Snapshot
Figure 45 Siemens AG: SWOT Analysis
Figure 46 Echelon Corporation: Company Snapshot
Figure 47 Silver Spring Networks Inc.: Company Snapshot
Figure 48 Landis+GYR AG: Company Snapshot


Growth opportunities and latent adjacency in Smart Solar Market
Interested in smart solar market
Interested in smart solar market
Interested in smart solar market
Interested in smart solar market
Understanding the floating solar,wind, compulsory roof top,community solar, integrated gated apartment complex to have roof top solar market
Interested in smart solar market
Interested in smart solar market
Interested in IOT market segmentation
Understanding the solar software for regions like Chile and Latin America