Spandex Fiber Market by Production Process (Solution Dry Spinning, and Solution Wet Spinning), by End-Use (Textile, and Healthcare) & by Region (Asia-Pacific, North America, Europe, and RoW) - Forecast to 2020


The spandex fiber market is projected to reach 5.40 Billion by 2020, at a CAGR of 7.2%. The base year used for study is 2014 and the forecast period is 2015 to 2020. This report provides a detailed analysis of the market based on end-use, production process, and region.
Request for Customization to get the global Spandex Fiber market forecasts to 2022
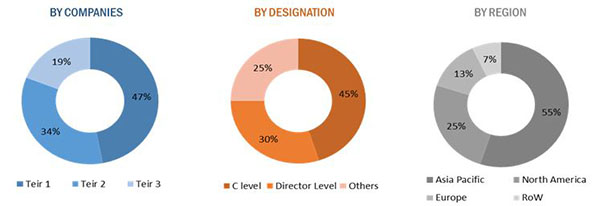
The research methodology used to estimate and forecast the market begins with capturing data on revenues of key players through secondary research. The market player’s offerings are also taken into consideration to determine the market segmentation. The bottom-up procedure was employed to arrive at the overall market size of the global spandex fiber market from the revenue of the key players in the market. After arriving at the overall market size, the total market was split into several segments and subsegments which are then verified through primary research by conducting extensive interviews with key people such as CEOs, VPs, directors, and executives. This data triangulation and market breakdown procedures were employed to complete the overall market engineering process and arrive at the exact statistics for all segments and subsegments.
The stakeholders of this report include Spandex Fiber Manufacturers, Government Bodies, PTMEG and MDI Manufacturers, End-use companies, Industry Associations, Investment Banks, Consulting Companies/Consultants in Chemical and Material sectors
Key Spandex Fiber Market Players
Key players operating in this market are Hyosung Corporation (South Korea), Du Pont (U.S.), Teijin ltd (Japan), Toray Industries (Japan), Asahi Kasei Corporation (Japan), Far Eastern New Century Corporation (Taiwan), and INVISTA (U.S.).
Spandex Fiber Market Report Scope
This research report categorizes the global market based on end-use industry, production process, and region.
Report Scope:
This research report categorizes the global market into the following segments:
Global Spandex Fiber Market, By End-Use Industry
- Textile
- Healthcare
Global Spandex Fiber Market, By Production Process
- Solution Dry Spinning
- Solution Wet Spinning
Global Spandex Fiber Market, By Region
- Asia Pacific
- North America
- Europe
- RoW
Spandex Fiber Market reprot Available Customizations
Along with the market data, MarketsandMarkets offers customizations as per the client’s specific needs. The following customization options are available for the report:
- Detailed analysis and profiling of additional market players (up to five)
- Information for two countries of client’s choice
The global spandex fiber market was valued at USD 3.57 Billion in 2014, and is expected to grow at a CAGR of 7.2% between 2015 and 2020. Increasing disposable income in the emerging economies such as China, Japan, India, and others is increasing demand for textile products. Textile being the major segment, is fueling the growth of the market.
Manufacturing of spandex fiber entails two processes, namely, solution dry spinning and solution wet spinning. These two processes are covered in the segment of production process of this market. The solution dry spinning is the most cost efficient process, the fibers manufactured through this process offer better elastic recovery. This is the reason why it accounts for the largest market share out of the two manufacturing processes.
Textile is the fastest-growing segment in the spandex fiber market. The demand for applications such as sport wear, active wear, intimate wear, and others is increasing and hence the segment is growing. Spandex fiber has unmatched physical and chemical qualities, which makes it the most favorable choice for fabric manufacturers. Other than the textile industry, spandex is also used in the healthcare industry in applications such as stretchable bandages, compress bandages, and medical housing. This segment is witnessing higher growth from the European region, due to large number of bandages manufacturers present in the region.
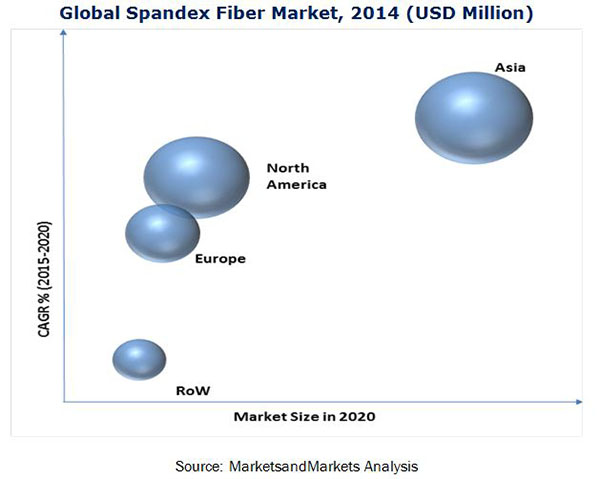
The market in the APAC region accounts the largest share and is expected to grow at the highest CAGR during the forecast period. The increasing demand of textile products in the economies such as China, Japan, India, and South Korea among many others drives the spandex fiber market in this region. Also, the presence of large number of local players in china are contributing towards the growth of market.
However, this fiber if exposed to high temperature can damage the structure of the fiber and cause the fiber to shrink. This fiber can also cause skin allergies, as several chemicals are used in the manufacturing of the fiber.
Frequently Asked Questions (FAQ):
How big is the spandex fiber market industry?
The spandex fiber market is estimated to reach USD 5.40 Billion by 2020, at a CAGR of 7.2%.
Who leading market players in spandex fiber industry?
Major players operating in spandex fiber market are Hyosung Corporation (South Korea), Du Pont (U.S.), Investa (U.S.), Teijin Ltd. (Japan), Asahi Kasei Corporation (Japan), Toray Industries (Japan), Far Eastern New Century Corporation (Taiwan), Acelon Chemical and Fiber Corporation (Taiwan) & others.
To speak to our analyst for a discussion on the above findings, click Speak to Analyst
 Exclusive indicates content/data unique to MarketsandMarkets and not available with any competitors.
Table of Contents
1 Introduction (Page No. - 13)
1.1 Objectives of the Study
1.2 Market Definition
1.3 Market Scope
1.3.1 Markets Covered
1.3.2 Years Considered for the Study
1.4 Currency & Pricing
1.5 Limitations
1.6 Stake Holders
2 Research Methodology (Page No. - 17)
2.1 Research Data
2.1.1 Secondary Data
2.1.1.1 Key Data From Secondary Sources
2.1.2 Primary Data
2.1.2.1 Key Data From Primary Sources
2.1.2.2 Key Industry Insights
2.1.2.3 Breakdown of Primaries
2.2 Market Size Estimation
2.2.1 Bottom-Up Approach
2.2.2 Top Down Approach
2.3 Market Breakdown & Data Triangulation
2.4 Research Assumptions and Limitations
3 Executive Summary (Page No. - 25)
4 Premium Insights (Page No. - 31)
4.1 Significant Opportunities for Spandex Fiber Market
4.2 Spandex Fibers Market: Key Regions
4.3 Spandex Fiber Market in Asia-Pacific
4.4 Spandex Fibers Market Attractiveness
4.5 Spandex Fiber Market Share, By Application
4.6 Life Cycle Analysis, By Region
5 Market Overview (Page No. - 37)
5.1 Introduction
5.2 Market Segmentation
5.2.1 By Production Process
5.2.2 By End Use Industry
5.2.3 By Region
5.3 Market Dynamics
5.3.1 Drivers
5.3.1.1 Elongations, Flexibility and Comfort
5.3.1.2 Increasing Disposable Income in the Developing Countries
5.3.1.3 Wide Range of Applications Across Various Industry
5.3.2 Restraints
5.3.2.1 Sensitive to Heat
5.3.2.2 Natural Latex (Closest Substitute)
5.3.3 Opportunities
5.3.3.1 Rapid Growing Demand in the Textile Industry
5.3.3.2 Higher Growth in the Asia-Pacific Market
5.3.4 Healthcare Or Medical Issues
5.3.4.1 Medical Issues
6 Industry Trends (Page No. - 43)
6.1 Introduction
6.2 Value Chain Analysis
6.2.1 Raw Materials
6.2.2 Research and Developments
6.2.3 Manufacturing
6.2.4 Distribution Network
6.3 Porter’s Five Forces Analysis
6.3.1 Threat of New Entrants
6.3.2 Threat of Substitutes
6.3.3 Bargaining Power of Suppliers
6.3.4 Bargaining Power of Buyers
6.3.5 Intensity of Competitive Rivalry
6.4 Strategic Benchmarking
6.4.1 New Product Launch
6.4.2 Expansions
6.4.3 Collaboration/ Joint Venture/ Partnership
7 Spandex Fiber Market, By Production Process (Page No. - 49)
7.1 Introduction
7.2 Market Size & Projection
7.3 Solution Dry Spinning
7.4 Solution Wet Spinning
8 Spandex Fiber Market, By End-Use Industry (Page No. - 57)
8.1 Introduction
8.2 Market Size & Projection
8.3 Textile
8.4 Healthcare
9 Spandex Fiber Market, By Region (Page No. - 65)
9.1 Introduction
9.2 Asia-Pacific
9.3 North America
9.4 Europe
9.5 Rest of the World
10 Competitive Landscape (Page No. - 90)
10.1 Overview
10.1.1 Expansion: Most Preferred Growth Strategy
10.2 Maximum Developments in Between 2010-2015
10.3 Maximum Developments in 2015
10.4 Hyosung Corporation: Top Most Player
10.5 Competitive Situation & Trends
10.5.1 Expansions
10.5.2 New Product Launches
10.5.3 Collaborations
10.5.4 New Project Announcements
10.5.5 Other Developments
10.6 Introduction
10.6.1 Business Overview
10.6.2 Products Offered
10.6.3 Recent Developments
10.6.4 MnM View
10.7 E. I. Du Pont De Nemours and Company
10.7.1 Business Overview
10.7.2 Products Offered
10.7.3 Recent Developments
10.7.4 SWOT Analysis
10.7.5 MnM View
10.8 Teijin Limited
10.8.1 Business Overview
10.8.2 Products Offered
10.8.3 Recent Developments
10.8.4 SWOT Analysis
10.8.5 MnM View
10.9 Far Eastern New Century Corporation
10.9.1 Business Overview
10.9.2 Products Offered
10.9.3 Recent Developments
10.9.4 SWOT Analysis
10.9.5 MnM View
10.10 Asahi Kasei Corporation
10.10.1 Business Overview
10.10.2 Products Offered
10.10.3 Recent Developments
10.10.4 SWOT Analysis
10.10.5 MnM View
10.11 Toray Industries Inc.
10.11.1 Business Overview
10.11.2 Products Offered
10.11.3 Recent Developments
10.11.4 SWOT Analysis
10.11.5 MnM View
10.12 Acelon Chemical and Fiber Corporation
10.12.1 Business Overview
10.12.2 Products Offered
10.12.3 Recent Developments
10.12.4 SWOT Analysis
10.12.5 MnM View
10.13 Toyobo Co., Ltd
10.13.1 Business Overview
10.13.2 Products Offered
10.13.3 Recent Developments
10.13.4 SWOT Analysis
10.13.5 MnM View
10.14 Indorama Corporation
10.14.1 Business Overview
10.14.2 Products Offered
10.14.3 Recent Developments
10.14.4 MnM View
10.15 Invista
10.15.1 Business Overview
10.15.2 Products Offered
10.15.3 Recent Developments
10.15.4 MnM View
11 Appendix (Page No. - 139)
11.1 Discussion Guide
11.2 Available Customizations
List of Tables (72 Tables)
Table 1 Spandex Fiber Market: By Production Process, 2015–2020 (USD Million)
Table 2 8 Spandex Fiber Market Size: By Production Process, 2015–2020 (MT)
Table 3 Solution Dry Spinning Market, By Region, 2015–2020 (USD Million )
Table 4 Solution Dry Spinning Market, By Region, 2015–2020 (MT)
Table 5 Solution Wet Spinning Market, By Region, 2015–2020 (USD Million)
Table 6 Solution Wet Spinning Market, By Region, 2015–2020 (MT)
Table 7 Solution Dry Spinning Market, By End Use Industry, 2015–2020 (USD Million)
Table 8 Solution Dry Spinning Market, By End Use Industry, 2015–2020 (MT)
Table 9 Solution Wet Spinning Market, By End Use Industry, 2015–2020 (USD Million)
Table 10 Solution Wet Spinning Market, By End Use Industry, 2015–2020 (MT)
Table 11 Spandex Fiber Market, By End-Use Industry, 2013–2020 (USD Million)
Table 12 Textile Market, By Production Process, 2013–2020 (MT)
Table 13 Textile Market, By Production Process, 2013–2020 (USD Million)
Table 14 Textile Market, By Region, 2013–2020 (MT)
Table 15 Textile Market, By Region, 2013–2020 (USD Million)
Table 16 Healthcare Market, By Production Process, 2013–2020 (MT)
Table 17 Healthcare Market, By Production Process, 2013–2020 (USD Million)
Table 18 Healthcare Market, By Region, 2013–2020 (MT)
Table 19 Healthcare Market, By Region, 2013–2020 (USD Million)
Table 20 Spandex Fiber Market, By Region, 2013–2020 (MT)
Table 21 Asia-Pacific: Spandex Fiber Market , By Country, 2013–2020 (MT)
Table 22 Asia Pacific : Market, By Enduse Industryby, 2013–2020 (MT)
Table 23 Asia-Pacific: Market, By Production Process, 2013–2020 (MT)
Table 24 China: Market, By Production Process, 2013–2020 (MT)
Table 25 China: Market, By End-Use Industry, 2013–2020 (MT)
Table 26 Japan: Market, By Production Process, 2013–2020 (MT)
Table 27 Japan: Market , By End-Use Industry, 2013–2020 (MT)
Table 28 South Korea: Spandex Fiber Market, By Production Process, 2013–2020 (MT)
Table 29 South Korea: Spandex Fiber Market, By Enduse Industry, 2013–2020 (MT)
Table 30 India: Market , By Production Process, 2013–2020 (MT)
Table 31 India: Market , By End Use Industry, 2013–2020 (MT)
Table 32 North America: Spandex Fiber Market, By Country, 2013–2020 (MT)
Table 33 North America: Market, By Production Process, 2013–2020 (MT)
Table 34 North America: Market , By End-Use Industry, 2013–2020 (MT)
Table 35 U.S: Market , By Production Process, 2013–2020 (MT)
Table 36 U.S: Market, By End-Use Industry, 2013–2020 (MT)
Table 37 Mexico: Market, By Production Process, 2013–2020 (MT)
Table 38 Mexico: Market , By End Use Industry, 2013–2020 (MT)
Table 39 Canada: Market, By Production Process, 2013–2020 (MT)
Table 40 Canada: Market, By End Use Industry, 2013–2020 (MT)
Table 41 Europe: Market, By Country, 2013–2020 (MT)
Table 42 Europe: Market, By Production Process, 2013–2020 (MT)
Table 43 Europe: Spandex Fiber Market, By End Use Industry, 2013–2020 (MT)
Table 44 U.K.: Market, By Production Process, 2013–2020 (MT)
Table 45 U.K.: Market , By End Use Industry, 2013–2020 (MT)
Table 46 Germany: Market, By Production Process, 2013–2020 (MT)
Table 47 Germany: Market, By End Use Industry, 2013–2020 (MT)
Table 48 France: Market, By Production Process, 2013–2020 (MT)
Table 49 France: Market, By End Use Industry, 2013–2020 (MT)
Table 50 Italy: Market, By Production Process, 2013–2020 (MT)
Table 51 Italy: Market , By End Use Industry, 2013–2020 (MT)
Table 52 RoW: Spandex Fiber Market, By Country, 2013–2020 (MT)
Table 53 RoW: Market, By Production Process, 2013–2020 (MT)
Table 54 RoW: Market, By End Use Industry, 2013–2020 (MT)
Table 55 Turkey: Market, By Production Process, 2013–2020 (MT)
Table 56 Turkey: Spandex Fibers Market, By End Use Industry, 2013–2020 (MT)
Table 57 Brazil: Spandex Fiber Market, By Production Process, 2013–2020 (MT)
Table 58 Brazil: Market, By End Use Industry, 2013–2020 (MT)
Table 59 Expansions, 2010–2015
Table 60 New Product Launches, 2010–2015
Table 61 Collaborations/ Joint Ventures/ Partnerships, 2010–2015
Table 62 New Project Announcement, 2010–2015
Table 63 Other Developments, 2010–2015
Table 64 Hyosung Corporation: Products & Their Description
Table 65 E. I. Du Pont De Nemours and Company: Products & Their Description
Table 66 Teijin Limited : Products & Their Descriptions
Table 67 Far Eastern New Century Corporation: Products & Their Descriptions
Table 68 Asahi Kasei Cororation: Products & Their Descriptions
Table 69 Toray Industries Inc.: Products & Their Descriptions
Table 70 Toyobo Co., Ltd: Products & Their Description
Table 71 Indorama Corporation: Products & Their Descriptions
Table 72 Invista: Products & Their Description
List of Figures (59 Figures)
Figure 1 Spandex Fiber Market Segmentation
Figure 2 Spandex Fibers Market, Research Design
Figure 3 Key Data From Secondary Sources
Figure 4 Key Data From Primary Sources
Figure 5 Key Industry Insights
Figure 6 Breakdown of Primary Interviews, By Company Type, Designation & Region
Figure 7 Market Size Estimation: Bottom-Up Approach
Figure 8 Market Size Estimation: Top-Down Approach
Figure 9 Spandex Fiber Market: Data Triangulation
Figure 10 Solution Dry Spinning to Dominate the Spandex Fibers Market By Volume, 2015–2020
Figure 11 Solution Wet Spinning to Grow at A Higher CAGR During the Forecast Period
Figure 12 Asia-Pacific to Register Higher CAGR Between 2015 & 2020
Figure 13 Textle Industry to Witness Maximum Demand for Spandex Fiber Between 2015-2020(Metric Tons)
Figure 14 High Growth in the Global Spandex Fiber Market Between 2015 & 2020
Figure 15 Asia-Pacific Expected to Account for the Largest Share in the Spandex Fibers Market During the Forecast Period
Figure 16 China Accounted for the Largest Share in the Asia-Pacific Region
Figure 17 Rapid Industrialization in Emerging Regions to Boost the Demand for Spandex Fiber Between 2015 & 2020
Figure 18 Textile Segment Dominated the Spandex Fiber Market in 2014
Figure 19 Asia-Pacific to Experience High Growth During the Forecast Period
Figure 20 Spandex Fibers Market Segmentation
Figure 21 Spandex Market: Market Dynamics
Figure 22 Value Chain Analysis for Spandex Fiber: Raw Material Accounts for the Major Value Addition
Figure 23 Porter’s Five Forces Analysis
Figure 24 Strategic Benchmarking: Hyosung Corporation Introduced Several Products With Higher Flexibility Than Other Products
Figure 25 Strategic Benchmarking: Asahi Kasei Corporation Focused on Expansion to Capture A Large Share
Figure 26 Strategic Benchmarking: Collaboration/Partnership Among Companies Play A Major Role in This Market
Figure 27 Solution Dry Spinning to Account for the Largest Market Share During the Forecast Period
Figure 28 Healthcare Industry to Register the Highest CAGR in the Next Five Years (2015–2020) By Value
Figure 29 Textile Industry to Register the Highest CAGR in the Next Five Years (2015–2020) By Volume
Figure 30 Regional Snapshot (2015-2020): India & South Korea Emerging as the New Strategic Locations
Figure 31 Asia Pacific and North America Likely to Be the Fastest-Growing Markets for the Textile End Use Segment
Figure 32 Asia-Pacific Market Snapshot: Spandex Fiber (2014–2020)
Figure 33 North America Market Snapshot: Spandex Fiber (2014–2020)
Figure 34 Europe Market Snapshot: Spandex Fiber (2014–2020)
Figure 35 RoW Market Snapshot: Preference for Spandex Fiber(2015–2020)
Figure 36 Companies Primarily Adopted Organic Growth Strategies Between 2010-2015
Figure 37 Key Growth Strategies in the Spandex Fiber Market, 2010–2015
Figure 38 Asia-Pacific has the Most Number of Developments During the Forecast Period
Figure 39 Spandex Fiber Market Development Share, 2010–2015
Figure 40 Spandex Fibers Market: Growth Strategies, By Company, 2010–2015
Figure 41 Geographical Revenue Mix of Top Five Market Player
Figure 42 Hyosung Corporation : Company Snapshot
Figure 43 Hyosung Corporation: SWOT Analysis
Figure 44 E. I. Du Pont De Nemours and Company: Company Snapshot
Figure 45 E. I. Du Pont De Nemours and Company: SWOT Analysis
Figure 46 Teijin Limited: Company Snapshot
Figure 47 Teijin Limited: SWOT Analysis
Figure 48 Far Eastern New Century Corporation: Company Snapshot
Figure 49 Far Eastern New Century Corporation: SWOT Analysis
Figure 50 Asahi Kasei Corporation: Company Snapshot
Figure 51 Asahi Kasei Corporation: SWOT Analysis
Figure 52 Toray Industries Inc. : Company Snapshot
Figure 53 Toray Industries Inc.: SWOT Analysis
Figure 54 Acelon Chemical and Fiber Corporation: Company Snapshot
Figure 55 Acelon Chemical and Fiber Corporation: SWOT Analysis
Figure 56 Toyobo Co., Ltd: Company Snapshot
Figure 57 Toyobo Co., Ltd: SWOT Analysis
Figure 58 Indorama Corporation: Company Snapshot
Figure 59 Invista: Company Snapshot


Growth opportunities and latent adjacency in Spandex Fiber Market