Spectrum Analyzer Market by Offering (Product & Software), Type (Swept-Tuned, Vector Signal, Real-Time), Range (<6 GHz, 6 GHz¢18 GHz, >18 GHz), Form Factor (Handheld, Portable, Benchtop), Network Technology, End-User Industry - Global Forecasts to 2022


The overall spectrum analyzer market was valued at USD 999.2 Million in 2015 and is expected to reach USD 1,750.0 Million by 2022, at a CAGR of 8.48% between 2016 and 2022.
The years considered for the study are as follows:
- Base Year: 2015
- Estimated Year: 2016
- Projected Year: 2022
- Forecast Period: 2016 to 2022
The major objectives of the study are as follows:
- To define, describe, and forecast the spectrum analyzer market segmented on the basis of offering, type, frequency range, form factor, network technology, end-user industry, and geography
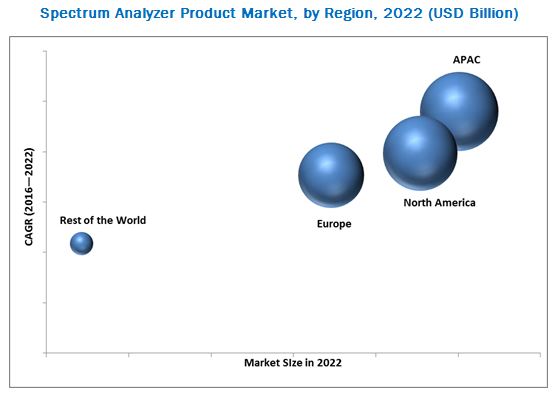
- To forecast the market size, in terms of value, for various segments with regard to four main regions, namely, North America, Europe, Asia-Pacific (APAC), and Rest of the World (RoW)
- To provide detailed information regarding the major factors influencing the growth of the spectrum analyzer market (drivers, restraints, opportunities, and industry-specific challenges)
- To analyze the micromarkets with respect to the individual growth trends, future prospects, and contribution to the total market
- To provide a detailed overview of the value chain in the spectrum analyzer market and analyze the market trends through the Porter’s five forces analysis
- To analyze the opportunities in the market for various stakeholders by identifying the high-growth segments of the spectrum analyzer market
- To profile the key players and comprehensively analyze their market position in terms of the ranking and core competencies, along with detailing the competitive landscape for the market leaders
- To analyze competitive developments such as partnerships & joint ventures, mergers & acquisitions, new product developments, expansions, and research & development in the spectrum analyzer market
The overall spectrum analyzer market was valued at USD 999.2 Million in 2015 and is expected to reach USD 1,750.0 Million by 2022, at a CAGR of 8.48% between 2016 and 2022. The growth of the studied market is driven by factors such as the rising demand for wireless technology, growth in the demand for spectrum analyzers with multi-tasking capabilities, technological advancements leading to innovation in product offering, significant advancements in terms of bandwidth & frequency, and the growing trend of portability in the studied market.
The swept-tuned spectrum analyzer market is expected to hold a major share during the forecast period because of factors such as the wide usage of spectrum analyzer compared to other types, maximum frequency coverage, and increasing advancements in terms of new-generation connectivity platforms such as 3G, 4G, 5G, and LTE in the coming years. Additionally, swept-tuned spectrum analyzer and vector signal spectrum analyzer are the traditional types of spectrum analyzers. They are widely used in high-end industries such as A&D, telecommunication, medical, and industrial sector.
The benchtop spectrum analyzer is expected to hold a major share during the forecast period. This form factor is the oldest form of spectrum analyzer equipment. Benchtop spectrum analyzer is normally used in a lab area or a production area where it can be plugged into AC power. This is the traditional form of spectrum analyzers and gives the best performance among all the form factors. It is widely used in most of the industries wherein there is requirement of high frequency measurement such as defense, telecommunication, and industrial, among others.
Among all the end-user industries, the market for the medical & healthcare industry is expected to grow at the highest rate between 2016 and 2022. In the healthcare industry, there are many new advanced devices such as ECG, EEG, and blood pressure monitors that are developed to measure various medical parameters. However, before these devices are delivered to the end user, it is necessary to test and calibrate them according to the requirement. To conduct this testing process, equipment such as spectrum analyzers and signal generators are widely used.
North America held the largest market share for spectrum analyzers in 2015. However, the market in APAC is expected to grow at a high rate between 2016 and 2022. The increased research and development in the field of spectrum analyzer in terms of new and emerging areas of applications as well as the increasing demand for emerging technologies such as spectrum analyzers are the two crucial factors driving the market in this region. Asia-Pacific is a major market for various sectors such as semiconductors & electronics, automobiles, and healthcare, among others. Factors such as the leading position of APAC in the worldwide sale of automobiles and the emergence of China as a global manufacturing hub are the major reasons for the growth of the market in APAC.
The major restraints hindering the growth of the spectrum analyzer market include the requirement of cost-effective spectrum analyzers with maximum features and the growing market for second-hand spectrum analyzers. The key players operating in the studied market such as Keysight Technologies (U.S.), Rohde & Schwarz GmbH & Co., Kg. (Germany), Fortive Corporation (U.S.), and Anritsu Corporation (Japan) are focusing on the strategies of new product developments and partnerships & agreements to expand their business and leverage the benefits. In July 2016, Keysight Technologies launched BenchVue software that provides multiple-instrument measurement applications, data capture, and solution applications without the need for instrument programming.
To speak to our analyst for a discussion on the above findings, click Speak to Analyst
 Exclusive indicates content/data unique to MarketsandMarkets and not available with any competitors.
Table of Contents
1 Introduction (Page No. - 17)
1.1 Objectives of the Study
1.2 Market Definition
1.3 Study Scope
1.3.1 Markets Covered
1.3.2 Geographic Scope
1.3.3 Years Considered for the Study
1.4 Currency
1.5 Limitations
1.6 Stakeholders
2 Research Methodology (Page No. - 21)
2.1 Research Data
2.1.1 Secondary Data
2.1.1.1 Key Data From Secondary Sources
2.1.2 Primary Data
2.1.2.1 Key Data From Primary Sources
2.1.2.2 Key Industry Insights
2.1.2.3 Breakdown of Primaries
2.2 Market Size Estimation
2.2.1 Bottom-Up Approach
2.2.2 Top-Down Approach
2.3 Market Breakdown and Data Triangulation
2.4 Research Assumptions
3 Executive Summary (Page No. - 29)
4 Premium Insights (Page No. - 34)
4.1 Attractive Opportunities in the Spectrum Analyzer Market Between 2016 and 2022
4.2 Spectrum Analyzer Market, By Offering (2016–2022)
4.3 Spectrum Analyzer Market, By Type (2016–2022)
4.4 Spectrum Analyzer Market, By Frequency Range (2016–2022)
4.5 Spectrum Analyzer Market, By Form Factor (2016–2022)
4.6 Spectrum Analyzer Market, By Region and End-User Industry
4.7 Spectrum Analyzer Market, By Region (2016–2022)
4.8 Life Cycle Analysis, By Region
5 Market Overview (Page No. - 40)
5.1 Introduction
5.2 Market Segmentation
5.2.1 Spectrum Analyzer Market, By Offering
5.2.2 Spectrum Analyzer Market, By Type
5.2.3 Spectrum Analyzer Market, By Frequency Range
5.2.4 Spectrum Analyzer Market, By Form Factor
5.2.5 Spectrum Analyzer Market, By Network Technology
5.2.6 Spectrum Analyzer Market, By End-User Industry
5.2.7 Spectrum Analyzer Market, By Geography
5.3 Market Dynamics
5.3.1 Drivers
5.3.1.1 Growing Market for Wireless Technology Which Requires Spectrum Analyzers for Testing
5.3.1.2 Growing Demand for Spectrum Analyzers With Multi-Tasking Capabilities
5.3.1.3 Technological Advancement Leading to Innovation in Spectrum Analyzer Offering
5.3.1.4 Increasing Adoption of Portable and Hand-Held Spectrum Analyzers
5.3.1.5 Significant Advancements in Terms of Bandwidth and Frequency Globally
5.3.2 Restraints
5.3.2.1 Requirement of Cost-Effective Spectrum Analyzers With Maximum Features
5.3.2.2 Increasing Demand for Second-Hand Spectrum Analyzers
5.3.3 Opportunities
5.3.3.1 Constantly Growing Need for Higher Bandwidth
5.3.3.2 Widespread Deployment of Lte
5.3.4 Challenges
5.3.4.1 Need for Components to Cope Up With Increasing Bandwidth
5.3.4.2 Controlling the Noise Floor of the Spectrum Analyzing System
5.3.4.3 Measurement of Low-Level Signals With A Spectrum Analyzer
6 Industry Trends (Page No. - 51)
6.1 Introduction
6.2 Advanced Technological Trends and Innovations
6.2.1 Lte and Lte-Advanced is the Future of Telecom
6.2.2 Market Potential for Lte Services
6.2.3 Role of Test and Measurement Equipment in This Segment
6.3 Value Chain Analysis
6.4 Porter’s Five Forces Analysis
6.4.1 Threat of New Entrants
6.4.2 Threat of Substitutes
6.4.3 Bargaining Power of Suppliers
6.4.4 Bargaining Power of Buyers
6.4.5 Intensity of Competitive Rivalry
7 Spectrum Analyzer Market, By Offering (Page No. - 59)
7.1 Introduction
7.2 Product
7.3 Software
8 Spectrum Analyzer Market, By Type (Page No. - 62)
8.1 Introduction
8.2 Swept-Tuned Spectrum Analyzer
8.2.1 Rf Tuning Method
8.2.2 Super Heterodyne
8.3 Vector Signal Spectrum Analyzer
8.4 Real-Time Spectrum Analyzer
8.4.1 Fast Fourier Transform (FFT) Spectrum Analyzer
8.4.2 Parallel Filter Analyzer
9 Spectrum Analyzer Market, By Frequency Range (Page No. - 78)
9.1 Introduction
9.2 <6 GHz
9.3 6 GHz–18 GHz
9.4 >18 GHz
10 Spectrum Analyzer Market, By Form Factor (Page No. - 87)
10.1 Introduction
10.2 Handheld Spectrum Analyzer
10.3 Portable Spectrum Analyzer
10.4 Benchtop Spectrum Analyzer
11 Spectrum Analyzer Market, By Network Technology (Page No. - 95)
11.1 Introduction
11.2 Wired Network Technology
11.3 Wireless Network Technology
12 Spectrum Analyzer Market, By End-User Industry (Page No. - 99)
12.1 Introduction
12.2 Automotive and Transportation
12.3 Aerospace & Defense
12.4 IT & Telecommunication
12.5 Medical & Healthcare
12.6 Semiconductors & Electronics
12.7 Industrial & Energy Sector
12.8 Others (Educational Institutes and Government Sector)
13 Geographic Analysis (Page No. - 124)
13.1 Introduction
13.2 North America
13.2.1 U.S.
13.2.2 Canada
13.2.3 Mexico
13.3 Europe
13.3.1 Germany
13.3.2 U.K.
13.3.3 France
13.3.4 ITaly
13.3.5 Rest of Europe (RoE)
13.4 Asia-Pacific (APAC)
13.4.1 China
13.4.2 Japan
13.4.3 South Korea
13.4.4 India
13.4.5 Rest of APAC (RoAPAC)
13.5 Rest of the World (RoW)
13.5.1 South America
13.5.2 Middle East & Africa
14 Competitive Landscape (Page No. - 142)
14.1 Overview
14.2 Key Players in Spectrum Analyzer Market
14.3 Competitive Situations and Trends
14.3.1 New Product Developments
14.3.2 Partnerships, Agreements, Contracts, and Collaborations
14.3.3 Mergers & Acquisitions
14.3.4 Other Developments
15 Company Profiles (Page No. - 152)
(Company at A Glance, Business Overview, Products Offered, Key Strategy, Recent Developments, SWOT Analysis & MnM View)*
15.1 Introduction
15.2 Keysight Technologies
15.3 Rohde & Schwarz GmbH & Co., Kg.
15.4 Fortive Corporation
15.5 Anritsu Corporation
15.6 Advantest Corporation
15.7 Cobham PLC
15.8 Giga-Tronics Incorporated
15.9 Yokogawa Electric Corporation
15.10 National Instruments Corporation
15.11 LP Technologies Inc
15.12 Teledyne Lecroy, Inc.
15.13 Avcom of Virginia. Inc
15.14 B&K Precision Corporation
15.15 Stanford Research Systems, Inc.
*Details on Company at A Glance, Recent Financials, Products Offered, Strategies & Insights, & Recent Developments Might Not Be Captured in Case of Unlisted Companies.
16 Appendix (Page No. - 189)
16.1 Insights of Industry Experts
16.2 Discussion Guide
16.3 Knowledge Store: Marketsandmarkets’ Subscription Portal
16.4 Introducing Rt: Real-Time Market Intelligence
16.5 Available Customizations
16.5.1 Market Size for 2017, 2019, and 2021 for Segments Such as Offering, Type, Frequency Range, Form Factor, Network Technology, End-User Industry, and Geography.
16.5.2 Unit Shipment of Global Spectrum Analyzer Market
16.5.3 Company Information: Detailed Analysis and Profiling of Additional Five Market Players
16.6 Related Reports
List of Tables (87 Tables)
Table 1 Currency Table
Table 2 Spectrum Analyzer Market, By Offering, 2013–2022 (USD Million)
Table 3 Worldwide Lte Connections and Networks (2014)
Table 4 Recent Spectrum Analyzers Offering With Multi-Tasking Capabilities, By Key Player (2012–2016)
Table 5 Porter’s Five Forces Analysis (2015): High Impact of Intensity of Competitive Rivalry on the Spectrum Analyzer Market
Table 6 Spectrum Analyzer Market, By Offering, 2013–2022 (USD Million)
Table 7 Spectrum Analyzer Market, By Type, 2013–2022 (USD Million)
Table 8 Swept-Tuned Spectrum Analyzer Market, By End-User Industry, 2013–2022 (USD Million)
Table 9 Swept-Tuned Spectrum Analyzer Market, By Frequency Range, 2013–2022 (USD Million)
Table 10 Swept-Tuned Spectrum Analyzer Market, By Form Factor, 2013–2022 (USD Million)
Table 11 Swept-Tuned Spectrum Analyzer Market, By Network Technology, 2013–2022 (USD Million)
Table 12 Swept-Tuned Spectrum Analyzer Market, By Region, 2013–2022 (USD Million)
Table 13 Vector Signal Spectrum Analyzer Market, By End-User Industry, 2013–2022 (USD Million)
Table 14 Vector Signal Spectrum Analyzer Market, By Frequency Range, 2013–2022 (USD Million)
Table 15 Vector Signal Spectrum Analyzer Market, By Form Factor,2013–2022 (USD Million)
Table 16 Vector Signal Spectrum Analyzer Market, By Network Technology, 2013–2022 (USD Million)
Table 17 Vector Signal Spectrum Analyzer Market, By Region, 2013–2022 (USD Million)
Table 18 Real-Time Spectrum Analyzer Market, By End-User Industry, 2013–2022 (USD Million)
Table 19 Real-Time Spectrum Analyzer Market, By Frequency Range, 2013–2022 (USD Million)
Table 20 Real-Time Spectrum Analyzer Market, By Form Factor, 2013–2022 (USD Million)
Table 21 Real-Time Spectrum Analyzer Market, By Network Technology, 2013–2022 (USD Million)
Table 22 Real-Time Spectrum Analyzer Market, By Region, 2013–2022 (USD Million)
Table 23 Spectrum Analyzer Market, By Frequency Range, 2013–2022 (USD Million)
Table 24 Spectrum Analyzer Market for <6 GHz Frequency Range, By End-User Industry, 2013–2022 (USD Million)
Table 25 Spectrum Analyzer Market for <6 GHz Frequency Range, By Type, 2013–2022 (USD Million)
Table 26 Spectrum Analyzer Market for 6 GHz–18 GHz Frequency Range, By End-User Industry, 2013–2022 (USD Million)
Table 27 Spectrum Analyzer Market for 6 GHz–18 GHz Frequency Range, By Type, 2013–2022 (USD Million)
Table 28 Spectrum Analyzer Market for >18 GHz Frequency Range, By End-User Industry, 2013–2022 (USD Thousand)
Table 29 Spectrum Analyzer Market for >18 GHz Frequency Range, By Type, 2013–2022 (USD Million)
Table 30 Spectrum Analyzer Market, By Form Factor, 2013–2022 (USD Million)
Table 31 Handheld Spectrum Analyzer Market, By End-User Industry, 2013–2022 (USD Million)
Table 32 Handheld Spectrum Analyzer Market, By Type, 2013–2022 (USD Million)
Table 33 Portable Spectrum Analyzer Market, By End-User Industry, 2013–2022 (USD Million)
Table 34 Portable Spectrum Analyzer Market, By Type, 2013–2022 (USD Million)
Table 35 Benchtop Spectrum Analyzer Market, By End-User Industry, 2013–2022 (USD Million)
Table 36 Benchtop Spectrum Analyzer Market, By Type, 2013–2022 (USD Million)
Table 37 Spectrum Analyzer Market, By Network Technology, 2013–2022 (USD Million)
Table 38 Wired Spectrum Analyzer Market, By Type, 2013–2022 (USD Million)
Table 39 Wireless Spectrum Analyzer Market, By Type, 2013–2022 (USD Million)
Table 40 Spectrum Analyzer Market, By End-User Industry, 2013–2022 (USD Million)
Table 41 Spectrum Analyzer Market for Automotive & Transportation End-User Industry, By Type, 2013–2022 (USD Million)
Table 42 Spectrum Analyzer Market for Automotive & Transportation End-User Industry, By Frequency Range, 2013–2022 (USD Million)
Table 43 Spectrum Analyzer Market for Automotive & Transportation End-User Industry, By Form Factor, 2013–2022 (USD Million)
Table 44 Spectrum Analyzer Market for Automotive & Transportation End-User Industry, By Region, 2013–2022 (USD Thousand)
Table 45 Spectrum Analyzer Market for A&D End-User Industry, By Type, 2013–2022 (USD Million)
Table 46 Spectrum Analyzer Market for A&D End-User Industry, By Frequency Range, 2013–2022 (USD Million)
Table 47 Spectrum Analyzer Market for A&D End-User Industry, By Form Factor, 2013–2022 (USD Million)
Table 48 Spectrum Analyzer Market for A&D End-User Industry, By Region, 2013–2022 (USD Million)
Table 49 Spectrum Analyzer Market for IT & Telecommunication End-User Industry, By Type, 2013–2022 (USD Million)
Table 50 Spectrum Analyzer Market for IT & Telecommunication End-User Industry, By Frequency Range, 2013–2022 (USD Million)
Table 51 Spectrum Analyzer Market for IT & Telecommunication End-User Industry, By Form Factor, 2013–2022 (USD Million)
Table 52 Spectrum Analyzer Market for IT & Telecommunication End-User Industry, By Region, 2013–2022 (USD Million)
Table 53 Spectrum Analyzer Market for Medical & Healthcare End-User Industry, By Type, 2013–2022 (USD Million)
Table 54 Spectrum Analyzer Market for Medical & Healthcare End-User Industry, By Frequency Range, 2013–2022 (USD Thousand)
Table 55 Spectrum Analyzer Market for Medical & Healthcare End-User Industry, By Form Factor, 2013–2022 (USD Million)
Table 56 Spectrum Analyzer Market for Medical & Healthcare End-User Industry, By Region, 2013–2022 (USD Thousand)
Table 57 Spectrum Analyzer Market for Semiconductors & Electronics End-User Industry, By Type, 2013–2022 (USD Million)
Table 58 Spectrum Analyzer Market for Semiconductors & Electronics End-User Industry, By Frequency Range, 2013–2022 (USD Million)
Table 59 Spectrum Analyzer Market for Semiconductors & Electronics End-User Industry, By Form Factor, 2013–2022 (USD Million)
Table 60 Spectrum Analyzer Market for Semiconductors & Electronics End-User Industry, By Region, 2013–2022 (USD Million)
Table 61 Spectrum Analyzer Market for Industrial & Energy End-User Industry, By Type, 2013–2022 (USD Million)
Table 62 Spectrum Analyzer Market for Industrial & Energy End-User Industry, By Frequency Range, 2013–2022 (USD Million)
Table 63 Spectrum Analyzer Market for Industrial & Energy End-User Industry, By Form Factor, 2013–2022 (USD Million)
Table 64 Spectrum Analyzer Market for Industrial & Energy End-User Industry, By Region, 2013–2022 (USD Million)
Table 65 Spectrum Analyzer Market for Other End-User Industries, By Type, 2013–2022 (USD Thousand)
Table 66 Spectrum Analyzer Market for Other End-User Industries, By Frequency Range, 2013–2022 (USD Thousand)
Table 67 Spectrum Analyzer Market for Other End-User Industries, By Form Factor, 2013–2022 (USD Thousand)
Table 68 Spectrum Analyzer Market for Other End-User Industries, By Region, 2013–2022 (USD Thousand)
Table 69 Spectrum Analyzer Market, By Region, 2013–2022 (USD Million)
Table 70 Spectrum Analyzer Market in North America, By Country, 2013–2022 (USD Million)
Table 71 Spectrum Analyzer Market in North America, By End-User Industry, 2013–2022 (USD Million)
Table 72 Spectrum Analyzer Market in North America, By Type, 2013–2022 (USD Million)
Table 73 Spectrum Analyzer Market in Europe, By Country, 2013–2022 (USD Million)
Table 74 Spectrum Analyzer Market in Europe, By End-User Industry, 2013–2022 (USD Million)
Table 75 Spectrum Analyzer Market in Europe, By Type, 2013–2022 (USD Million)
Table 76 Spectrum Analyzer Market in APAC, By Country, 2013–2022 (USD Million)
Table 77 Spectrum Analyzer Market in APAC, By End-User Industry, 2013–2022 (USD Million)
Table 78 Spectrum Analyzer Market in APAC, By Type, 2013–2022 (USD Million)
Table 79 Spectrum Analyzer Market in RoW, By Region, 2013–2022 (USD Million)
Table 80 Spectrum Analyzer Market in RoW, By End-User Industry, 2013–2022 (USD Thousand)
Table 81 Spectrum Analyzer Market in RoW, By Type, 2013–2022 (USD Million)
Table 82 Companies Segment Revenue of Major Players, (2013–2015) USD Billion
Table 83 Top 5 Players in the Spectrum Analyzer Market, 2015
Table 84 New Product Developments (2011–2016)
Table 85 Partnerships, Agreements, Contracts, and Collaborations (2013–2016)
Table 86 Mergers & Acquisitions (2011–2016 )
Table 87 Other Developments (2016)
List of Figures (77 Figures)
Figure 1 Market Segmentation
Figure 2 Spectrum Analyzer Market: Research Design
Figure 3 Data Triangulation
Figure 4 Process Flow of Market Size Estimation
Figure 5 Snapshot of Spectrum Analyzer Market, By Offering (2013–2022)
Figure 6 Medical & Healthcare End-User Industry Estimated to Witness the Highest Growth Rate Between 2016 and 2022
Figure 7 Swept-Tuned Spectrum Analyzer Expected to Hold A Major Market Share Between 2016 and 2022
Figure 8 North America Led the Spectrum Analyzer Market in 2015
Figure 9 Spectrum Analyzer Market Expected to Grow at A Siginificant Rate Between 2016 and 2022
Figure 10 Software Market to Grow at the Highest Rate Between 2016 and 2022
Figure 11 Swept-Tuned Spectrum Analyzer Expected to Hold the Major Market Size Between 2016 and 2022
Figure 12 Market for <6 GHz Expected to Hold the Lagest Market Size in 2016
Figure 13 Benchtop Spectrum Analyzer Expected to Hold A Major Market Share Between 2013 and 2022
Figure 14 APAC Spectrum Analyzer Market Expected to Surpass the North American Market in 2016
Figure 15 U.S. Expected to Hold the Largest Share of the Spectrum Analyzer Market in 2016
Figure 16 The Market in North America and APAC is in the Growth Stage in the Spectrum Analyzer Market Between 2016 and 2022
Figure 17 Growth in Demand for Spectrum Analyzers With Multi-Tasking Capabilities Expected to Propel the Growth of the Spectrum Analyzer Market
Figure 18 Cable Modems: Increasing Bandwidth Between 1982 and 2016
Figure 19 Value Chain Analysis of the Spectrum Analyzer Market (2015)
Figure 20 Overview of Porter’s Five Forces Analysis of Spectrum Analyzer Market (2015)
Figure 21 Spectrum Analyzer Market: Porter’s Five Forces Analysis (2015)
Figure 22 Spectrum Analyzer Market: Threat of New Entrants
Figure 23 Spectrum Analyzer Market: Bargaining Power of Suppliers
Figure 24 Spectrum Analyzer Market: Bargaining Power of Buyers
Figure 25 Spectrum Analyzer Market: Intensity of Competitive Rivalry
Figure 26 Product Offering to Hold the Larger Market Size Between 2016 and 2022
Figure 27 Real-Time Spectrum Analyzer to Grow at the Highest Rate Between 2016 and 2022
Figure 28 IT & Telecommunication End-User Industry to Hold A Major Share of the Swept-Tuned Spectrum Analyzer Market Till 2022 (USD Million)
Figure 29 Portable Spectrum Analyzer to Grow at the Highest Rate Between 2016 and 2022
Figure 30 APAC and North America to Be the Top Two Markets for Swept-Tuned Spectrum Analyzer in 2016
Figure 31 Vector Signal Spectrum Analyzer With <6 GHz Frequency Range to Hold A Major Market Share Between 2016 and 2022
Figure 32 APAC to Grow at the Highest Rate in the Vector Signal Spectrum Analyzer Market Between 2016 and 2022
Figure 33 IT & Telecommunication End-User Industry to Hold A Major Market Size of the Real-Time Spectrum Analyzer Market Till 2022
Figure 34 Market for >18 GHz Frequency Range to Grow at the Highest Rate in the Spectrum Analyzer Market Between 2016 and 2022
Figure 35 Real-Time Spectrum Analyzer to Witness the Highest Growth Rate Between 2016 and 2022
Figure 36 IT & Telecommunication End-User Industry to Hold A Major Market Size for >18 GHz Frequency Range Between 2016 and 2022
Figure 37 Portable Spectrum Analyzer to Grow at the Highest Rate in the Spectrum Analyzer Market Between 2016 and 2022
Figure 38 Real-Time Spectrum Analyzer to Grow at the Highest Rate in the Handheld Spectrum Analyzer Market Between 2016 and 2022
Figure 39 IT & Telecommunication to Hold A Major Market Size in the Portable Spectrum Analyzer Market Between 2016 and 2022
Figure 40 Swept-Tuned Spectrum Analyzer to Hold A Major Share of the Benchtop Spectrum Analyzer Market in 2016
Figure 41 Wireless Network Technology to Witness the Highest Growth Rate in the Spectrum Analyzer Market Between 2016 and 2022
Figure 42 Medical & Healthcare End-User Industry to Witness the Highest Growth Rate in the Spectrum Analyzer Market Between 2016 and 2022
Figure 43 Spectrum Analyzer With <6 GHz Frequency Range to Lead the Market for the Automotive & Transportation End-User Industry Between 2016 and 2022
Figure 44 Portable Spectrum Analyzer to Grow at the Highest Rate in the Automotive & Transportation Industry Between 2016 and 2022
Figure 45 Spectrum Analyzer Market in >18 GHz Frequency Range to Grow at the Highest Rate in the A&D End-User Industry Between 2016 and 2022
Figure 46 North America and APAC to Be the Top Two Markets for A&D End-User Industry Till 2022
Figure 47 Spectrum Analyzer With Frequency Range <6 GHz to Hold the Major Share of the Market for IT & Telecommunication End-User Industry Till 2022
Figure 48 Real-Time Spectrum Analyzer to Witness the Highest Growth Rate in the Medical & Healthcare End-User Industry Between 2016 and 2022
Figure 49 North America to Grow at the Highest Rate in the Medical & Healthcare End-User Industry Between 2016 and 2022
Figure 50 Spectrum Analyzer With Frequency Range of <6 GHz to Lead the Market for the Semiconductors & Electronics End-User Industry Between 2016 and 2022
Figure 51 APAC to Grow at the Highest Rate in the Semiconductors & Electronics End-User Industry Between 2016 and 2022
Figure 52 North America to Hold A Major Share of the Industrial & Energy Sector Between 2016 and 2022
Figure 53 Portable Spectrum Analyzer Market to Grow at the Highest Rate Between 2016 and 2022
Figure 54 Geographic Snapshot of Spectrum Analyzer Market (2016–2022)
Figure 55 North American Market Snapshot
Figure 56 IT & Telecommunication to Lead the Spectrum Analyzer Market in North America Between 2016 and 2022 (USD Million)
Figure 57 APAC Market Snapshot
Figure 58 IT & Telecommunication to Lead the Spectrum Analyzer Market in RoW Between 2016 and 2022 (USD Thousand)
Figure 59 Companies Adopted New Product Developments as the Key Growth Strategy Between 2013 and 2016
Figure 60 Advantest Corporation Registered the Highest Growth Rate in Terms of Segment Revenue Between 2013 and 2015
Figure 61 Market Evolution Framework — New Product Developments as the Major Strategy Adopted By Key Players (2013–2016)
Figure 62 Battle for Market Ranking: New Product Developments as the Key Growth Strategy
Figure 63 Geographic Revenue Mix of the Major Market Players (2015)
Figure 64 Keysight Technologies: Company Snapshot
Figure 65 Keysight Technologies: SWOT Analysis
Figure 66 Rohde & Schwarz GmbH & Co., Kg.: Company Snapshot
Figure 67 Rohde & Schwarz GmbH & Co., Kg.: SWOT Analysis
Figure 68 Fortive Corporation: Company Snapshot
Figure 69 Fortive Corporation: SWOT Analysis
Figure 70 Anritsu Corporation: Company Snapshot
Figure 71 Anritsu Corporation: SWOT Analysis
Figure 72 Advantest Corporation: Company Snapshot
Figure 73 Advantest Corporation: SWOT Analysis
Figure 74 Cobham PLC : Company Snapshot
Figure 75 Giga-Tronics Incorporated: Company Snapshot
Figure 76 Yokogawa Electric Corporation: Company Snapshot
Figure 77 National Instruments Corporation: Company Snapshot
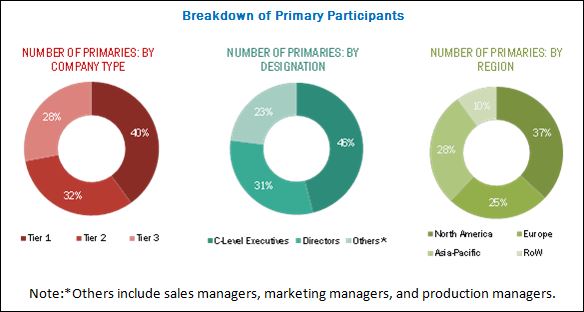
During this research study, major players of the spectrum analyzer ecosystem in various regions have been identified and their offerings, regional presence, and distribution channels have been understood through in-depth discussions. To find the overall market size, top-down and bottom-up approaches have been used to estimate the sizes of other individual markets by using percentage splits from secondary sources (such as Hoovers, Bloomberg BusinessWeek, Factiva, and OneSource) and primary research. The entire procedure includes the study of the annual and financial reports of the top market players and extensive interviews of industry leaders such as CEOs, VPs, directors, and marketing executives for key insights (both qualitative and quantitative) pertaining to the market. The figure below shows the breakdown of the primaries on the basis of the company type, designation, and region.
To know about the assumptions considered for the study, download the pdf brochure
The spectrum analyzer ecosystem comprises spectrum analyzer manufacturers who look after different phases in the value chain such as R&D, manufacturing, distribution, and post-sales services. Companies such as Keysight Technologies (U.S.), Rohde & Schwarz GmbH & Co., Kg. (Germany), Fortive Corporation (U.S.), Anritsu Corporation (Japan), Advantest Corporation (Japan), Cobham PLC (U.K.), Giga-tronics Incorporated (U.S.), Yokogawa Electric Corporation (Japan), National Instruments Corporation (U.S.), LP Technologies Inc. (U.S.), Teledyne LeCroy (U.S.), Avcom of Virginia Inc. (U.S.), B&K Precision Corporation (U.S.), and Stanford Research Systems, Inc. (U.S.), among others are the major players in the studied market.
Key Target Audience
- Semiconductor companies
- Consumer electronics manufacturers
- Telecommunication original device manufacturers (ODMs)
- Technology solution providers
- Original equipment manufacturers (OEMs)
- Universities and research organizations
- Technology investors
- Government bodies
The study answers several questions for the target audiences, primarily which market segments to focus on in the next two to five years for prioritizing efforts and investments.
Scope of the Report
In the research report, the spectrum analyzer market is segmented into the following submarkets:
By Offering:
- Product (Type, Frequency Range, Form Factor)
- Software (Apps and OS)
By Type:
- Swept-Tuned Spectrum Analyzer
- RF Tuning Method
- Super Heterodyne
- Vector Signal Spectrum Analyzer
- Real-Time Spectrum Analyzer
- Fast Fourier Transform (FFT)
- Parallel Filter Analyzer
By Frequency Range:
- <6 GHz
- 6 GHz–18 GHz
- >18 GHz
By Form Factor:
- Handheld Spectrum Analyzer
- Portable Spectrum Analyzer
- Benchtop Spectrum Analyzer
By Network Technology:
- Wired
- Wireless
By End-User Industry:
- Automotive & Transportation
- A&D
- IT & Telecommunication
- Medical & Healthcare
- Semiconductors & Electronics
- Industrial & Energy
- Others (Educational Institutes and Government Sector)
By Region:
- North America
- Europe
- Asia-Pacific (APAC)
- Rest of the World (RoW) (South America and Middle East & Africa)
Available Customizations
With the given market data, MarketsandMarkets offers customizations according to the company’s specific needs. The following customization options are available for the report:
Submarkets Analysis
- Market size for 2017, 2019, and 2021 for segments such as offering, type, frequency range, form factor, network technology, end-user industry, and geography.
- Unit shipment of global spectrum analyzer market.
Company Information
- Detailed analysis and profiling of additional market players (up to five)


Growth opportunities and latent adjacency in Spectrum Analyzer Market