Structural Core Materials Market by Type (Foam, Honeycomb, and Balsa), Outer Skin Type (GFRP, CFRP, and NFRP), End-use Industry (Aerospace, Wind Energy, Marine, Transportation, and Construction), and Region - Global Forecasts to 2022


Structural Core Material Market size was USD 1.40 Billion in 2016 and is projected to reach USD 2.32 Billion by 2022, at a CAGR of 8.8% during the forecast period. The use of structural core materials is becoming crucial in the wind energy, aerospace, marine, transportation, construction, and other industries. Furthermore, structural core material manufacturers are signing supply agreements with various end-use industries to secure their position in the structural core materials market. In this study, the years considered to estimate the structural core materials market size have been mentioned below.
- Base Year � 2016
- Estimated Year � 2017
- Projected Year � 2022
- Forecast Period � 2017 to 2022
2016 has been considered as the base year for company profiles. Whenever information was unavailable for the base year, the previous year has been considered.
Objectives of the Study
- To analyze and forecast the market size of structural core materials, in terms of volume (kiloton) and value (USD million)
- To provide detailed information regarding the key factors influencing the growth of the market (drivers, restraints, opportunities, and challenges)
- To define, describe, and forecast the structural core materials market based on type, outer skin type, and end-use industry
- To analyze and forecast the structural core materials market size by regions, namely, North America, Europe, APAC, MEA, and Latin America
- To strategically analyze the market with respect to individual growth trends, prospects, and contribution of submarkets1 to the overall market
- To analyze the market opportunities and competitive landscape for stakeholders and market leaders
- To analyze recent market developments and competitive strategies, such as agreements, collaborations, joint ventures, mergers & acquisitions, and new product developments to draw the competitive landscape
- To strategically profile key players and analyze their core competencies2
- Submarkets refer to regional subdivisions of a market.
- Core competencies of the companies are determined in terms of key strategies adopted by them to sustain their position in the market.
Various secondary sources, such as such as Factiva, Hoovers, and Manta, have been used to understand and gain insights into the global structural core materials market. Experts from top structural core material companies have been interviewed to verify and collect critical information and to assess the trends in the structural core materials market during the forecast period. Top-down, bottom-up, and data triangulation approaches have been implemented to calculate the exact values of the overall parent and individual market sizes.
To know about the assumptions considered for the study, download the pdf brochure
The structural core materials market has a diversified and established ecosystem of its upstream players, such as raw material suppliers and downstream stakeholders, such as manufacturers, vendors, end users, and government organizations. Most of the major players in the structural core materials market have backward and forward integration to strengthen their position in the market. Some of the manufacturers of structural core materials include Diab Group (Sweden), Hexcel Corporation (US), Schweiter Technologies (Switzerland), Evonik Industries (Germany), Gurit Holding (Switzerland), Armacell International (Luxembourg), The Gill Corporation (US), and Changzhou Tiansheng New Materials Co. Ltd. (China)
Target audience
- Structural Core Materials Manufacturers
- Raw Materials Suppliers
- Distributors and Suppliers
- End-use Industries
- Industry Associations
�This study answers several questions for the stakeholders, primarily, which market segments to focus in the next two to five years for prioritizing the efforts and investments.�
Scope of the Report:
This research report categorizes the structural core materials market based on type, outer skin type, end-use industry, and region, and forecasts revenue growth and analysis of trends in each of the submarkets.
By Type:
- Foam
- Honeycomb
- Balsa
By Outer Skin Type
- GFRP
- CFRP
- NFRP
- Others
By End-use Industry:
- Aerospace
- Wind Energy
- Marine
- Transportation
- Construction
- Others
By Region
- North America
- Europe
- APAC
- MEA
- Latin America
Available Customizations
With the given market data, MarketsandMarkets offers customizations according to the company�s specific needs. The following customization options are available for the report:
Product Analysis
- Product matrix, which gives a detailed comparison of product portfolio of each company
Regional Analysis
- Further breakdown of the North American Structural Core Materials Market
- Further breakdown of the European Structural Core Materials Market
- Further breakdown of the APAC Structural Core Materials Market
- Further breakdown of MEA Structural Core Materials Market
- Further breakdown of the Latin American Structural Core Materials Market
Company Information
- Detailed analysis and profiling of additional market players
The global structural core materials market is projected to grow from USD 1.52 Billion in 2017 to USD 2.32 Billion by 2022, at a CAGR of 8.8% during the forecast period. The increasing number of patents filed for structural core materials by global players, growing manufacturing industries, and continuous agreements, partnerships & joint ventures, expansions, new product & technology launches, and mergers & acquisitions activities undertaken by various companies are key factors driving the global structural core materials market.
The global structural core materials market is segmented on the basis of type, outer skin type, end-use industry, and region. Based on type, the structural core materials market has been further segmented into foam, honeycomb, and balsa. Foam is expected to be the fastest-growing type of structural core materials. Foam core imparts strength and stiffness while keeping the composite and non-composite structures lightweight. Rapid growth in the wind energy industry, wind turbine blade manufacturing, and emergence of China and other Asian countries as major wind energy producers are propelling the consumption of foam core, thereby significantly driving the structural core materials market.
Based on outer skin type, the structural core materials market has been further segmented into GFRP, CFRP, NFRP, and other outer skin types such as metal sheets and aramid sheets. GFRP is the largest segment of the structural core materials market. This is because GFRP is extensively used in wind turbine blades as it reduces the overall weight, thereby increasing its efficiency. CFRP is the fastest-growing segment and is replacing other outer skins in sandwich panels in various applications due to its superior properties such as high strength-to-weight ratio, rigidity, corrosion resistance, and good tensile strength.
Major end-use industries in the structural core materials market are aerospace, wind energy, marine, transportation, construction, and others. The market in the wind energy end-use industry is projected to register the highest CAGR between 2017 and 2022. This high growth is attributed to the use of composites in designing of blades for large wind turbines. These blades are made by combining structural core materials and glass reinforced polyester/epoxy. Renewal of Production Tax Credit (PTC) in the US has helped the wind energy market to grow, thereby driving the structural core materials market. The wind energy end-use industry is also estimated to grow due to the rising demand for clean energy, globally.
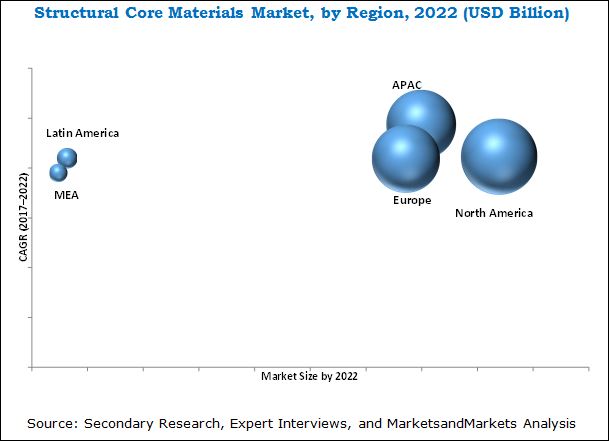
North America led the structural core materials market, in terms of value, in 2016, owing to high demand for honeycomb core materials from the aerospace and wind energy end-use industries. Established players, such as Hexcel Corporation (US) and The Gill Corporation (US) are accelerating their efforts to increase the production of honeycomb and foam core materials to meet the increasing demand from aircraft and wind blade manufacturers. Therefore, increasing application of honeycomb and foam core materials in the aerospace and wind energy end-use industries is expected to drive the structural core materials market.
The structural core materials market is rapidly gaining importance though a few factors are acting as bottlenecks in its growth. The capital-intensive nature of the industry and the uncertain wind energy industry in the US are some of the major restraints for the growth of the structural core materials market.
Diab Group (Sweden) is one of the major manufacturers of structural core materials. It emphasizes on excellence in consumer-centric product creation and focuses mainly on strategies, such as new product launches, agreements, partnerships, and expansions to grow. The company carried out continuous improvements in several business areas by maintaining its focus. It follows strategic moves to sustain its position as a market leader.
To speak to our analyst for a discussion on the above findings, click Speak to Analyst
 Exclusive indicates content/data unique to MarketsandMarkets and not available with any competitors.
Table of Contents
1 Introduction (Page No. - 17)
1.1 Objectives of the Study
1.2 Market Definition
1.3 Market Scope
1.3.1 Years Considered for the Study
1.4 Currency
1.5 Limitations
1.6 Stakeholders
2 Research Methodology (Page No. - 20)
2.1 Research Data
2.1.1 Secondary Data
2.1.1.1 Key Data From Secondary Sources
2.1.2 Primary Data
2.1.2.1 Key Data From Primary Sources
2.1.2.2 Key Industry Insights
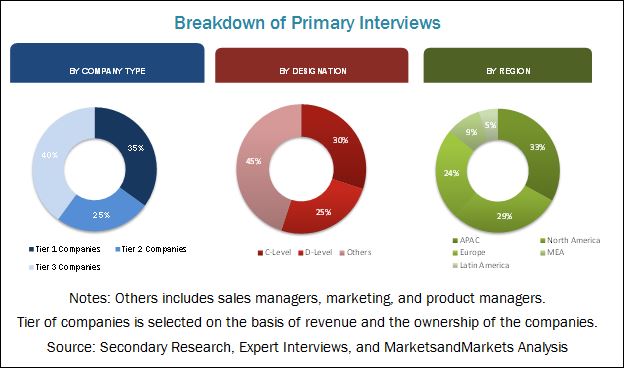
2.1.2.3 Breakdown of Primary Interviews
2.2 Market Size Estimation
2.2.1 Bottom-Up Approach
2.2.2 Top-Down Approach
2.3 Data Triangulation
2.4 Research Assumptions
3 Executive Summary (Page No. - 28)
4 Premium Insights (Page No. - 33)
4.1 Attractive Market Opportunities in Structural Core Materials
4.2 Market of Structural Core Materials, By Type
4.3 Market of Structural Core Materials, By Outer Skin Type
4.4 Market of Structural Core Materials, By End-Use Industry and Region
4.5 Market of Structural Core Materials, By Country
5 Market Overview (Page No. - 37)
5.1 Introduction
5.1.1 Drivers
5.1.1.1 Growing Demand From Wind Energy Industry
5.1.1.2 Growing Use of Composites in the Aerospace Industry
5.1.2 Restraints
5.1.2.1 Highly Capital-Intensive Market
5.1.2.2 Delay and Uncertainty in the Renewal of Production Tax Credit (PTC)
5.1.3 Opportunities
5.1.3.1 Emergence of PET Foam
5.1.4 Challenges
5.1.4.1 Price Reduction Through Bulk Production and Novel Manufacturing Processes
5.2 Porter�s Five Forces Analysis
5.2.1 Threat of New Entrants
5.2.2 Threat of Substitutes
5.2.3 Bargaining Power of Suppliers
5.2.4 Bargaining Power of Buyers
5.2.5 Intensity of Competitive Rivalry
6 Macroeconomic Overview and Key Trends (Page No. - 44)
6.1 Introduction
6.2 Trends and Forecast of GDP
6.3 Per Capita GDP vs Per Capita Structural Core Materials Demand
6.4 Trends in the Construction Industry
6.5 Trends in the Wind Energy Industry
6.6 Trends of Aerospace Industry
6.7 Trends in the Automotive Industry
7 Structural Core Materials Market, By Outer Skin Type (Page No. - 51)
7.1 Introduction
7.2 GFRP
7.3 CFRP
7.4 NFRP
7.5 Others
8 Structural Core Materials Market, By Type (Page No. - 59)
8.1 Introduction
8.2 Foam
8.2.1 PVC Foam
8.2.2 PET Foam
8.2.3 SAN Foam
8.2.4 Others
8.2.4.1 Polystyrene (PS)
8.2.4.2 Polymethacrylimide (PMI)
8.2.4.3 Polyetherimide (PEI)
8.2.4.4 Polyurethane (PU)
8.3 Honeycomb
8.3.1 Aluminum
8.3.2 Aramid
8.3.3 Thermoplastic
8.3.4 Paper
8.4 Balsa
9 Structural Core Market, By End-Use Industry (Page No. - 69)
9.1 Introduction
9.2 Aerospace
9.3 Wind Energy
9.4 Marine
9.5 Transportation
9.6 Construction
9.7 Others
10 Structural Core Materials Market, By Region (Page No. - 81)
10.1 Introduction
10.2 North America
10.2.1 U.S.
10.2.2 Canada
10.3 Europe
10.3.1 Germany
10.3.2 France
10.3.3 U.K.
10.3.4 Italy
10.3.5 Austria
10.3.6 Netherlands
10.3.7 Poland
10.3.8 Sweden
10.3.9 Spain
10.3.10 Russia
10.4 Asia-Pacific
10.4.1 China
10.4.2 Japan
10.4.3 India
10.4.4 South Korea
10.4.5 Australia & New Zealand
10.4.6 Malaysia
10.5 Middle East and Africa
10.5.1 Saudi Arabia
10.5.2 South Africa
10.5.3 UAE
10.6 Latin America
10.6.1 Brazil
10.6.2 Mexico
10.6.3 Argentina
10.6.4 Chile
11 Competitive Landscape (Page No. - 112)
11.1 Overview
11.2 Market Ranking
11.3 Competitive Scenario
11.3.1 Expansion
11.3.2 Agreement
11.3.3 Joint Venture
11.3.4 Acquisition
11.3.5 New Product Launch
12 Company Profiles (Page No. - 118)
(Overview, Financial*, Products & Services, Strategy, and Developments)
12.1 Diab Group
12.2 Evonik Industries
12.3 Gurit Holding
12.4 Schweiter Technologies
12.5 Hexcel Corporation
12.6 Armacell International
12.7 Changzhou Tiansheng New Materials Co. Ltd.
12.8 The Gill Corporation
12.9 Euro-Composites
12.10 Plascore
12.11 Other Key Players
12.11.1 SABIC
12.11.2 BASF
12.11.3 Corelite
12.11.4 Core Composites
12.11.5 I-Core Composites
12.11.6 ACP Composites
12.11.7 Carbon Core Corp
12.11.8 Matrix Composite Materials Company
12.11.9 Honicel Group
12.11.10 Honeylite
*Details Might Not Be Captured in Case of Unlisted Companies
13 Appendix (Page No. - 143)
13.1 Insights From Industry Experts
13.2 Discussion Guide
13.3 Knowledge Store: Marketsandmarkets� Subscription Portal
13.4 Introducing RT: Real-Time Market Intelligence
13.5 Available Customizations
13.6 Related Reports
13.7 Author Details
List of Tables (93 Tables)
Table 1 Structural Core Materials Market Size, 2015�2022 (Volume and Value)
Table 2 Global Wind Installation, 2011�2016
Table 3 Properties of PET Foam in End-Use Industries
Table 4 Trends and Forecast of GDP, By Country, 2017�2022 (USD Billion)
Table 5 Per Capita GDP vs Per Capita Structural Core Materials Demand, 2016
Table 6 Construction Industry Contribution to GDP in North America, By Country, 2015�2022 (USD Billion)
Table 7 Construction Industry Contribution to GDP in Europe, By Country, 2015�2022 (USD Billion)
Table 8 Construction Industry Contribution to GDP in Asia-Pacific, By Country, 2015�2022 (USD Billion)
Table 9 Construction Industry Contribution to GDP in MEA, By Country, 2015�2022 (USD Billion)
Table 10 Construction Industry Contribution to GDP in Latin America, By Country, 2015�2022 (USD Billion)
Table 11 Wind Turbine Installations, By Country, 2015�2016 (MW)
Table 12 Number of Airplane Deliveries, By Region, 2017-2036
Table 13 Automotive Production, By Region/Country, 2011�2015 (Thousand Units)
Table 14 Market Size, By Outer Skin Type, 2015�2022 (USD Million)
Table 15 Market Size, By Outer Skin Type, 2015�2022 (Kiloton)
Table 16 GFRP Outer Skin Market Size, By Region, 2015�2022 (USD Million)
Table 17 GFRP Outer Skin Market Size, By Region, 2015�2022 (Kiloton)
Table 18 CFRP Outer Skin Market Size, By Region, 2015�2022 (USD Million)
Table 19 CFRP Outer Skin Structural Core Market Size, By Region, 2015�2022 (Kiloton)
Table 20 NFRP Outer Skin Market Size, By Region, 2015�2022 (USD Million)
Table 21 NFRP Outer Skin Market Size, By Region, 2015�2022 (Kiloton)
Table 22 Other Outer Skin Types Market Size, By Region, 2015�2022 (USD Million)
Table 23 Other Outer Skin Types Market Size, By Region, 2015�2022 (Kiloton)
Table 24 Market Size, By Type, 2015�2022 (USD Million)
Table 25 Market Size, By Type, 2015�2022 (Kiloton)
Table 26 Structural Foam Core Materials Market Size, By Region, 2015�2022 (USD Million)
Table 27 Structural Foam Core Materials Market Size, By Region, 2015�2022 (Kiloton)
Table 28 Structural Honeycomb Core Materials Market Size, By Region, 2015�2022 (USD Million)
Table 29 Honeycomb Market Size, By Region, 2015�2022 (Kiloton)
Table 30 Structural Balsa Core Materials Market Size, By Region, 2015�2022 (USD Million)
Table 31 Balsa Market Size, By Region, 2015�2022 (Kiloton)
Table 32 Market Size, By End-Use Industry, 2015�2022 (USD Million)
Table 33 Market Size, By End-Use Industry, 2015�2022 (Kiloton)
Table 34 Market Size in Aerospace Industry, By Region, 2015�2022 (USD Million)
Table 35 Market Size in Aerospace Industry, By Region, 2015�2022 (Kiloton)
Table 36 Market Size in Wind Energy Industry, By Region, 2015�2022 (USD Million)
Table 37 Market Size in Wind Energy Industry, By Region, 2015�2022 (Kiloton)
Table 38 Market Size in Marine Industry, By Region, 2015�2022 (USD Million)
Table 39 Market Size in Marine Industry, By Region, 2015�2022 (Kiloton)
Table 40 Market Size in Transportation Industry, By Region, 2015�2022 (USD Million)
Table 41 Market Size in Transportation Industry, By Region, 2015�2022 (Kiloton)
Table 42 Market Size in Construction Industry, By Region, 2015�2022 (USD Million)
Table 43 Market Size in Construction Industry, By Region, 2015�2022 (Kiloton)
Table 44 Market Size in Other Industries, By Region, 2015�2022 (USD Million)
Table 45 Market Size in Other Industries, By Region, 2015�2022 (Kiloton)
Table 46 Market Size, By Region, 2015�2022 (USD Million)
Table 47 Market Size, By Region, 2015�2022 (Kiloton)
Table 48 North America: Market Size, By Country, 2015�2022 (USD Million)
Table 49 North America: Market Size, By Country, 2015�2022 (Kiloton)
Table 50 North America: Market Size, By Type, 2015�2022 (USD Million)
Table 51 North America: Market Size, By Type, 2015�2022 (Kiloton)
Table 52 North America: Market Size, By Outer Skin Type, 2015�2022 (USD Million)
Table 53 North America: Market Size, By Outer Skin Type, 2015�2022 (Kiloton)
Table 54 North America: Market Size, By End-Use Industry, 2015�2022 (USD Million)
Table 55 North America: Market Size, By End-Use Industry, 2015�2022 (Kiloton)
Table 56 Europe: Market Size, By Country, 2015�2022 (USD Million)
Table 57 Europe: Market Size, By Country, 2015�2022 (Kiloton)
Table 58 Europe: Market Size, By Type, 2015�2022 (USD Million)
Table 59 Europe: Market Size, By Type, 2015�2022 (Kiloton)
Table 60 Europe: Market Size, By Outer Skin Type, 2015�2022 (USD Million)
Table 61 Europe: Market Size, By Outer Skin Type, 2015�2022 (Kiloton)
Table 62 Europe: Market Size, By End-Use Industry, 2015�2022 (USD Million)
Table 63 Europe: Market Size, By End-Use Industry, 2015�2022 (Kiloton)
Table 64 Asia-Pacific: Market Size, By Country, 2015�2022 (USD Million)
Table 65 Asia-Pacific: Market Size, By Country, 2015�2022 (Kiloton)
Table 66 Asia-Pacific: Market Size, By Type, 2015�2022 (USD Million)
Table 67 Asia-Pacific: Market Size, By Type, 2015�2022 (Kiloton)
Table 68 Asia-Pacific: Market Size, By Outer Skin Type, 2015�2022 (USD Million)
Table 69 Asia-Pacific: Market Size, By Outer Skin Type, 2015�2022 (Kiloton)
Table 70 Asia-Pacific: Market Size, By End-Use Industry, 2015�2022 (USD Million)
Table 71 Asia-Pacific: By Market Size, By End-Use Industry, 2015�2022 (Kiloton)
Table 72 MEA: Market Size, By Country, 2015�2022 (USD Million)
Table 73 MEA: Market Size, By Country, 2015�2022 (Kiloton)
Table 74 Middle East & Africa: Market Size, By Type, 2015�2022 (USD Million)
Table 75 Middle East & Africa: Market Size, By Type, 2015�2022 (Kiloton)
Table 76 Middle East & Africa: Market Size, By Outer Skin Type, 2015�2022 (USD Million)
Table 77 Middle East & Africa: Market Size, By Outer Skin Type, 2015�2022 (Kiloton)
Table 78 MEA: Market Size, By End-Use Industry, 2015�2022 (USD Million)
Table 79 MEA: Market Size, By End-Use Industry, 2015�2022 (Kiloton)
Table 80 Latin America: Market Size, By Country, 2015�2022 (USD Million)
Table 81 Latin America: Market Size, By Country, 2015�2022 (Kiloton)
Table 82 Latin America: Market Size, By Type, 2015�2022 (USD Million)
Table 83 Latin America: Market Size, By Type, 2015�2022 (Kiloton)
Table 84 Latin America: Market Size, By Outer Skin Type, 2015�2022 (USD Million)
Table 85 Latin America: Market Size, By Outer Skin Type, 2015�2022 (Kiloton)
Table 86 Latin America: Market Size, By End-Use Industry, 2015�2022 (USD Million)
Table 87 Latin America: Market Size, By End-Use Industry, 2015�2022 (Kiloton)
Table 88 Market Ranking of Top 5 Players
Table 89 Expansion (2013�2017)
Table 90 Agreement, Partnership, and Collaboration (2013�2017)
Table 91 Joint Venture (2013�2017)
Table 92 Acquisition (2013�2017)
Table 93 New Product Launch (2013�2017)
List of Figures (38 Figures)
Figure 1 Structural Core Materials Market: Research Design
Figure 2 Foam Core to Register the Highest CAGR in the Market of Structural Core Materials
Figure 3 GFRP Segment to Dominate the Market of Structural Core Materials
Figure 4 Aerospace to Be the Largest End-Use Industry of Structural Core Materials
Figure 5 Asia-Pacific to Be the Fastest-Growing Market for Structural Core Materials
Figure 6 Growing Demand From the Wind Energy Industry is Driving the Market of Structural Core Materials
Figure 7 Foam to Be the Largest and Fastest-Growing Structural Core Material Type Between 2017 and 2022
Figure 8 CFRP to Be the Fastest-Growing Outer Skin Type Between 2017 and 2022
Figure 9 Asia-Pacific Lead the Market of Structural Core Materials in 2016
Figure 10 China to Be the Fastest-Growing Market Between 2017 and 2022
Figure 11 Factors Governing the Market of Structural Core Materials
Figure 12 Market: Porter�s Five Forces Analysis
Figure 13 Trends and Forecast of GDP, By Country, 2016 (USD Billion)
Figure 14 CFRP to Be the Fastest-Growing Outer Skin Type of Structural Core Materials
Figure 15 Asia-Pacific to Be the Fastest-Growing Market for GFRP Outer Skin Structural Core Materials
Figure 16 North America to Account for the Major Market Share in the CFRP Outer Skin Structural Core Materials
Figure 17 Foam to Be the Fastest-Growing Type in the Market of Structural Core Materials
Figure 18 Asia-Pacific to Be the Fastest-Growing Structural Foam Core Materials Market
Figure 19 North America to Be the Largest Market for Structural Honeycomb Core Materials During the Forecast Period
Figure 20 Asia-Pacific to Account for the Largest Share in the Structural Balsa Core Materials Market
Figure 21 Wind Energy to Be the Fastest-Growing End-Use Industry of Structural Core Materials During the Forecast Period
Figure 22 North America to Dominate the Market of Structural Core Materials in the Aerospace Industry
Figure 23 Asia-Pacific Accounts for the Major Market Share in Structural Core Materials in the Wind Energy Industry
Figure 24 Asia-Pacific to Be the Fastest-Growing Market of Structural Core Materials in the Marine Industry
Figure 25 Europe Leads the Market of Structural Core Materials in the Transportation Industry
Figure 26 Chinese Market of Structural Core Materials to Be the Global Hotspot, in Terms of Value, Between 2017 and 2022
Figure 27 North America: Market Snapshot of Structural Core Materials
Figure 28 Europe: Market Snapshot of Structural Core Materials
Figure 29 Asia-Pacific: Market Snapshot of Structural Core Materials
Figure 30 Wind Energy to Be the Fastest-Growing End-Use Industry for Structural Core Materials in MEA
Figure 31 Aerospace to Be the Fastest-Growing End-Use Industry in Latin America
Figure 32 Companies Adopted Expansion as the Key Growth Strategy, 2013�2017
Figure 33 Diab Group: Company Snapshot
Figure 34 Evonik Industries: Company Snapshot
Figure 35 Gurit Holding: Company Snapshot
Figure 36 Schweiter Technologies: Company Snapshot
Figure 37 Hexcel Corporation: Company Snapshot
Figure 38 Armacell International: Company Snapshot


Growth opportunities and latent adjacency in Structural Core Materials Market
Structural Core Materials Market report