Styrenics Market - Polystyrene (Expanded, GPPS), Acrylonitrile Butadiene Styrene, SBR, UPR - Global Trends & Forecasts to 2018


[317 Pages Report] The styrenics polymers consumption is estimated to be 35,007 kilotons in 2013 and will grow by 4.81% annually till 2018. The increasing demand of styrenics polymers in Asia-Pacific, especially in China, and growth in end-user applications such as construction and automotive industry are key factors driving the global styrenic polymers market.
Polystyrene (PS) is the major polymer which is largely consumed, followed by Acrylonitrile Butadiene Styrene (ABS) and Expanded Polystyrene (EPS). Properties of PS and EPS make it suitable for a wide variety of applications such as construction, packaging, consumer goods, etc. Automotive industry is the major consumer of Styrene Butadiene Rubber (SBR) particularly in tire manufacturing. Unsaturated Polyester Resin (UPR) has its applications in pipes & tanks, marine accessories, wind energy, etc.
Asia-Pacific is driving the styrenics polymers market contributing more than 50% of the global demand. The other drivers include high growth in wind energy applications of UPR and increased SBR demand due to tire labeling regulations. Due to cost and performance advantages, UPR is widely used in the manufacturing of wind blades, rotors, ventilators, etc., thus ensuring high growth in wind energy applications. Similarly, tire labeling regulations, being adopted by different countries such as Germany, Japan, etc., has led to an increased SBR demand worldwide, especially in the automobile industry.
Increasing environmental and health concerns due to usage of styrene and acceptance of other resins as substitute to Unsaturated Polyester Resin (UPR) were identified as major restraints. At present, their impact on the market is relatively high. However, emerging economies and innovations in products will create growth opportunities for styrenics polymers in the near future.
Companies producing or planning to produce styrenics polymers in the near future are opting for expansion by introducing new facilities and increase in capacity. The styrenic polymers market is a highly diversified market consisting of different types of polymers, each having wide range of applications. Due to this, there are large numbers of players operating in the market engaged in the manufacturing of different styrene-based products for different applications.
The report covers the global styrenics polymers market in the Asia-Pacific, Europe, North America, and Rest of the World under major types of polymers such as Polystyrene (PS), Expanded Polystyrene (EPS), Acrylonitrile Butadiene Styrene (ABS), etc. Market estimations have been provided in terms of consumption volume (kilotons) and market revenue ($million). The styrenics polymers have also been segmented by their respective applications.
For this report, various secondary sources such as chemical magazines, encyclopedia, directories, technical handbooks, company annual reports, industry association publications, articles, trade websites, and databases have been referred to identify and collect information useful for this extensive commercial study. The primary sources � experts from related industries and suppliers � have been interviewed to obtain and verify critical information as well as to assess the future prospects and market estimations.
This report analyzes various marketing trends and establishes the most effective growth strategy in the market. It identifies market dynamics such as drivers, restraints, opportunities, burning issues, and winning imperatives. Major companies such as BASF (Germany), SABIC (Saudi Arabia), Lanxess AG (Germany), The Dow Chemical Company (U.S.), Total S.A. (France), etc. have also been profiled in this report.
Scope of the report:
On the basis of polymer types:
- Polystyrene (PS)
- Expanded Polystyrene (EPS)
- Acrylonitrile Butadiene Styrene (ABS)
- Styrene Butadiene Rubber (SBR)
- Unsaturated Polyester Resin (UPR)
- Other Polymers
On the basis of applications:
The styrenics polymers market consists of different types of polymers each having different applications. Some of the major applications are building & construction, packaging, automotive, appliances, marine accessories, wind energy, etc.
On the basis of geography:
- Asia-Pacific
- Europe
- North America
- ROW
The global market is witnessing high growth on account of the emerging construction and packaging industry. This has resulted from increasing demand for infrastructure facilities and consumer goods, especially in regions such as the Asia-Pacific.
Styrenics Market Share, by Geography, 2012
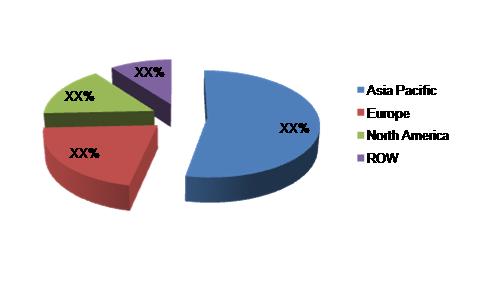
Source: MarketsandMarkets Analysis
The styrenics market is a diversified market with large number of players operating in different regions. Polystyrene (PS), Expanded Polystyrene (EPS), Acrylonitrile Butadiene Styrene (ABS), Styrene Butadiene Rubber (SBR), and Unsaturated Polyester Resin (UPR) are the main styrenics showing high growth potential. Other polymers such as Extruded Polystyrene (XPS), Styrene Acrylonitrile (SAN), Styrene Butadiene Latex (SBL), etc. have limited applications and are set to record a lower growth rate.
Styrene is highly volatile and when exposed, can be hazardous causing irritation to eyes, skin, respiratory system problems, dizziness, nervous system depression, etc. On incomplete combustion, it produces carbon monoxide and emits hazardous vapors on decomposition. The styrene-based polymers are non-biodegradable and need to be burned which can increase the explosion risks. These environmental and health concerns are the major restraints for market. However, absence of competitive substitutes which can replace styrenics is motivating the companies to continuously invest in this market.
Asia-Pacific is identified as the largest market as well as the highest growing in the next five years among all the regional markets. Europe and North America accounted for the second and the third largest markets respectively for styrenics consumption.
The growing demand for styrenics has prompted many companies to expand their production capacities so as to improve their market shares. Thus, most of the companies are focused on expansion as their major growth strategy. The other growth opportunities such as new product developments, agreements, and collaborations are also adopted for intensifying the penetration in market. Major players in this market are BASF (Germany), SABIC (Saudi Arabia), Lanxess AG (Germany), The Dow Chemical Company (U.S.), and Total S.A. (France).
 Exclusive indicates content/data unique to MarketsandMarkets and not available with any competitors.
Table Of Contents
1 Introduction (Page No. - 23)
1.1 Key Take Aways
1.2 Report Description
1.3 Markets Covered
1.4 Stake Holders
1.5 Research Methodology
1.5.1 Styrenics Market Size
1.5.2 Key Data Points Taken From Secondary Sources
1.5.3 List Of Secondary Data Sources
1.5.4 Key Data Points Taken From Primary Sources
1.5.5 Assumptions Made For This Report
2 Executive Summary (Page No. - 29)
3 Premium Insights (Page No. - 31)
3.1 Market Segmentation
3.2 Asia-Pacific � Best Market To Invest
3.3 Market Revenue Trends, By Geography
3.4 Polystyrene (Ps) � Important Styrenics Type
3.5 Market Share Of Styrenics, By Applications
3.6 Maximum Number Of Developments In 2012
3.7 Maximum Patents Registered In Japan
3.8 Top 4 Companies Focusing On Developing New & Improved Products
4 Styrenics Market Overview (Page No. - 41)
4.1 Introduction
4.2 Types Of Styrenics
4.2.1 Polystyrene (PS)
4.2.2 Expanded Polystyrene (EPS)
4.2.3 Acrylonitrile Butadiene Styrene (ABS)
4.2.4 Styrene Butadiene Rubber (SBR)
4.2.5 Unsaturated Polyester Resin (UPR)
4.2.6 Others
4.3 Value Chain Analysis
4.4 Burning Issue
4.4.1 Volatility In Raw Material Prices
4.5 Winning Imperatives
4.5.1 Expansion Into New & Emerging Markets
4.5.2 Focus On Product Developments & Innovations
4.6 Market Dynamics
4.6.1 Drivers
4.6.1.1 Asia-Pacific To Drive Styrenics Demand
4.6.1.2 Growth In End-Use Industries
4.6.1.3 High Growth In Wind Energy Applications Of UPR
4.6.1.4 UPR: Economical Over Others
4.6.1.5 Increased SBR Demand Due To Tire Labeling Regulations
4.6.2 Restraints
4.6.2.1 Increasing Environmental And Health Concerns Due To Usage Of Styrene
4.6.2.2 Acceptance Of Other Resins As Substitute To UPR
4.6.3 Opportunities
4.6.3.1 Emerging Economies And Their Future Growth
4.6.3.2 Innovation In Applications And Products
4.7 Regulations
4.7.1 Europe
4.7.2 North America
4.7.2.1 U.S.
4.7.2.2 Canada
4.7.3 Asia-Pacific
4.8 Raw Material Analysis
4.8.1 Styrene Monomer
4.8.2 Butadiene
4.8.3 Acrylonitrile
4.8.4 Poly Functional Alcohols
4.8.5 Unsaturated & Saturated Acids
4.9 Demand For Styrenics
4.10 Porter�s Five Forces Analysis
4.10.1 Degree Of Competition
4.10.2 Suppliers� Power
4.10.3 Buyers� Power
4.10.4 Threat Of Substitutes
4.10.5 Threat Of New Entrants
4.11 Company Analysis
4.11.1 Company Presence, By Styrenics Type
4.11.2 Company Presence, By Geography
4.12 Patent Analysis
5 Polystyrene (PS) & Expanded Polystyrene (EPS) (Page No. - 80)
5.1 Introduction
5.2 Polystyrene (PS)
5.2.1 PS Demand To Fall In 2013
5.2.2 PS Prices
5.2.3 Packaging: Important Application Of Polystyrene
5.3 Expanded Polystyrene (EPS)
5.3.1 Consumption Share, By Geography
5.3.2 Asia-Pacific: The Largest Consumer
5.3.3 EPS Prices
5.3.4 Building & Construction Industry Driving The Market
5.3.5 Regional Market Trends
5.3.5.1 Asia-Pacific
5.3.5.2 Europe
5.3.5.3 North America
5.3.5.4 Row
6 Acrylonitrile Butadiene Styrene (ABS) (Page No. - 104)
6.1 Introduction
6.2 Global ABS Production Capacity
6.3 Market Analysis & Forecast
6.3.1 Asia-Pacific Dominates ABS Consumption
6.3.2 ABS Prices
6.3.3 ABS Revenue, By Geography
7 Styrene Butadiene Rubber (SBR) (Page No. - 111)
7.1 Introduction
7.2 Production Capacity
7.2.1 China Leads SBR Production
7.2.2 Increase In Global SBR Production Capacity
7.3 Market Analysis & Forecast
7.3.1 Asia-Pacific To Remain Top SBR Consumer
7.3.2 SBR Prices
7.3.3 Growth In Tire Industry Driving SBR Market
7.3.3.1 SBR Composition In Tire
7.3.3.2 SBR Market, By Applications
8 Unsaturated Polyester Resin (UPR) (Page No. - 122)
8.1 Introduction
8.2 Market Analysis & Forecast
8.2.1 Asia-Pacific: Leading Consumer Of UPR
8.2.2 UPR Prices
8.2.3 Building & Construction Industry To Drive Global UPR Consumption
8.2.4 Regional Market Trends
8.2.4.1 Asia-Pacific
8.2.4.1.1 Marine Accessories Segment To Have Highest Growth Potential In Asia-Pacific
8.2.4.2 Europe
8.2.4.2.1 Europe To Have Moderate Growth Rate
8.2.4.3 North America
8.2.4.3.1 North America: Second Largest UPR Market
8.2.4.4 Row
8.2.4.4.1 Row To Show Promising UPR Consumption
9 Styrenics Market, By Geography (Page No. - 142)
9.1 Introduction
9.2 Consumption Share, By Geography
9.3 Styrenics Market Analysis & Forecast
9.3.1 Asia-Pacific To Drive Global Market
9.3.2 Styrenics Market Revenue, By Geography
9.3.3 Asia-Pacific
9.3.3.1 Household Appliances Production
9.3.3.2 Automotive Industry Driving ABS And SBR Demand
9.3.3.3 ABS Will Have Highest Revenue Growth
9.3.4 Europe
9.3.4.1 Moderate Growth In Europe
9.3.4.2 EPS Generating Highest Revenue
9.3.5 North America
9.3.5.1 Tire Labeling Regulations Driving SBR Demand
9.3.5.2 UPR Will Have The Highest Revenue Growth
9.3.6 Row
9.3.6.1 Styrenics Consumption In Row
9.3.6.2 Styrenics Market Revenue
10 Competitive Landscape (Page No. - 158)
10.1 Strategic Developments
10.1.1 Maximum Developments In 2012
10.1.2 Expansion: Most Popular Growth Strategy
10.1.3 New Products Launch/Developments
10.1.4 Agreements
10.1.5 Mergers & Acquisitions/Joint Ventures/Partnerships
10.1.6 Other Developments
11 Company Profiles (Overview, Financials*, Products & Services, Strategy, And Developments) (Page No. - 182)
11.1 Alpek SAB DE CV
11.2 Asahi Kasei Corporation
11.3 Ashland Inc.
11.4 BASF
11.5 Bayer Materialscience
11.6 CCP Composites
11.7 ENI S.P.A
11.8 Ineos Group AG
11.9 Lanxess AG
11.10 Nizhnekamskneftekhim OAO
11.11 Nova Chemicals Corporation
11.12 Reichhold Inc.
11.13 Repsol SA
11.14 Royal DSM
11.15 Sabic
11.16 Sibur
11.17 Styrolution Group GMBH
11.18 Styron LIC
11.19 Synthos S.A.
11.20 The Dow Chemical Company
11.21 Total SA
*Details Might Not Be Captured In Case Of Unlisted Companies.
Appendix (Page No. - 269)
U.S. Patents (Jan 2011 To Jun 2013)
Europe Patents (Jan 2011 To Jun 2013)
Japan Patents (Jan 2011 To Feb 2013)
List Of Tables (116 Tables)
Table 1 Expansion Strategy, By Major Players
Table 2 Common Strategy Followed By Companies: New Product Developments
Table 3 Properties: Epoxy, Acrylic, Polyurethane & UPR In Coatings
Table 4 Europe: Styrene Exposure Limit
Table 5 North America: Styrene Exposure Limit
Table 6 Difference Between Raw Materials, By Types
Table 7 Styrenics: Market Volume, By Polymer Types,2011 � 2018 (Kt)
Table 8 Styrenics: Market Revenue, By Polymer Types,2011 � 2018 ($Million)
Table 9 Substitutes Of Styrenics
Table 10 Company Analysis, By Styrenics Type
Table 11 Company Analysis, By Geography
Table 12 PS & EPS: Market Volume, 2011 � 2018 (KT)
Table 13 PS & EPS: Market Revenue, 2011 � 2018 ($Million)
Table 14 Polystyrene (PS), Properties
Table 15 PS: Market Volume, By Geography, 2011 � 2018 (KT)
Table 16 PS Prices, By Geography, 2011 � 2018 ($/Ton)
Table 17 PS: Market Revenue, By Geography, 2011 � 2018 ($Million)
Table 18 PS: Market Volume, By Applications, 2011 � 2018 (KT)
Table 19 PS: Market Revenue, By Applications, 2011 � 2018 ($Million)
Table 20 Expanded Polystyrene (EPS), Properties
Table 21 EPS Consumption, By Countries, 2012
Table 22 EPS: Market Volume, By Geography, 2011 � 2018 (KT)
Table 23 EPS Prices, By Geography, 2011 � 2018 ($/Ton)
Table 24 EPS: Market Revenue, By Geography, 2011 � 2018 ($Million)
Table 25 EPS: Market Volume, By Applications, 2011 � 2018 (KT)
Table 26 EPS: Market Revenue, By Applications, 2011 � 2018 ($Million)
Table 27 Asia-Pacific: EPS Market Volume, By Applications,2011 � 2018 (KT)
Table 28 Asia-Pacific: EPS Market Revenue, By Applications,2011 � 2018 ($Million)
Table 29 Europe: EPS Market Volume, By Applications, 2011 � 2018 (KT)
Table 30 Europe: EPS Market Revenue, By Applications,2011 � 2018 ($Million)
Table 31 North America: EPS Market Volume, By Applications,2011 � 2018 (KT)
Table 32 North America: EPS Market Revenue, By Applications,2011 � 2018 ($Million)
Table 33 Row: EPS Market Volume, By Applications, 2011 � 2018 (KT)
Table 34 Row: EPS Market Revenue, By Applications,2011 � 2018 ($Million)
Table 35 Acrylonitrile Butadiene Styrene (ABS), Properties
Table 36 ABS Production Capacity (KT)
Table 37 ABS: Market Volume, By Geography, 2011 � 2018 (KT)
Table 38 ABS Prices, By Geography, 2011 � 2018 ($/Ton)
Table 39 ABS: Market Revenue, By Geography, 2011 � 2018 ($Million)
Table 40 Styrene Butadiene Rubber (SBR), Properties
Table 41 SBR Production Share, By Countries, 2012
Table 42 SBR Present & Projected Production Capacity,By Companies (KT)
Table 43 SBR: Market Volume, By Geography, 2011 � 2018 (KT)
Table 44 SBR Prices, By Geography, 2011 � 2018 ($/Ton)
Table 45 SBR: Market Revenue, By Geography, 2011 � 2018 ($Million)
Table 46 Tire: Raw Material Cost Break-Up
Table 47 SBR: Market Volume, By Applications, 2011 � 2018 (KT)
Table 48 SBR: Market Revenue, By Applications, 2011 � 2018 ($Million)
Table 49 UPR Resin Types: Comparison Of Properties
Table 50 UPR: Market Volume, By Geography, 2011 � 2018 (KT)
Table 51 UPR Prices, By Geography, 2011 � 2018 ($/Ton)
Table 52 UPR: Market Revenue, By Geography, 2011 � 2018 ($Million)
Table 53 UPR: Market Volume, By Applications, 2011 � 2018 (KT)
Table 54 UPR: Market Revenue, By Applications, 2011 � 2018 ($Million)
Table 55 Asia-Pacific: Companies, By Locations
Table 56 Asia-Pacific: UPR Market Volume, By Applications,2011 � 2018 (KT)
Table 57 Asia-Pacific: UPR Market Revenue, By Applications,2011 � 2018 ($Million)
Table 58 Europe: Companies, By Subsidiaries
Table 59 Europe: UPR Market Volume, By Applications, 2011 � 2018 (KT)
Table 60 Europe: UPR Market Revenue, By Applications,2011 � 2018 ($Million)
Table 61 U.S: Companies & Their Subsidiaries
Table 62 North America: UPR Market Volume, By Applications,2011 � 2018 (KT)
Table 63 North America: UPR Market Revenue, By Applications,2011 � 2018 ($Million)
Table 64 Row: Companies, By Locations
Table 65 Row: UPR Market Volume, By Applications, 2011 � 2018 (KT)
Table 66 Row: UPR Market Revenue, By Applications, 2011 � 2018 ($Million)
Table 67 Styrenics: Market Volume, By Geography,2011 � 2018 (KT)
Table 68 Styrenics: Market Revenue, By Geography,2011 � 2018 ($Million)
Table 69 Household Appliances: Production Share, By Geography,2012 (%)
Table 70 Asia-Pacific: Styrenics Market Volume, By Types,2011 � 2018 (KT)
Table 71 Asia-Pacific: Styrenics Market Revenue, By Types, 2011 � 2018 ($Million)
Table 72 Europe: Styrenics Market Volume, By Types,2011 � 2018 (KT)
Table 73 Europe: Styrenics Market Revenue, By Types,2011 � 2018 ($Million)
Table 74 North America: Styrenics Market Volume, By Types, 2011 � 2018 (KT)
Table 75 North America: Styrenics Market Revenue, By Types, 2011 � 201 ($Million)
Table 76 Row: Styrenics Market Volume, By Types,2011 � 2018 (KT)
Table 77 Row: Styrenics Market Revenue, By Types,2011 � 2018 ($Million)
Table 78 Expansion, 2010 � 2013
Table 79 New Products Launch/Developments, 2010 � 2013
Table 80 Agreements, 2010 � 2013
Table 81 Mergers & Acquisitions/Joint Ventures/Partnerships,2010 � 2012
Table 82 Other Developments, 2010 - 2013
Table 83 Alpek: Products & Its Applications
Table 84 Asahi Kasei: Products & Its Applications
Table 85 Ashland: Products & Its Applications
Table 86 Ashland: Total Revenue, By Business Segments,2011 � 2012 ($Million)
Table 87 Ashland: Total Revenue, By Geography, 2011 � 2012 ($Million)
Table 88 BASF: Products & Its Applications
Table 89 BASF: Annual Revenue, By Business Segments,2011 � 2012 ($Million)
Table 90 BASF: Annual Revenue, By Plastic Segments,2011 � 2012 ($Million)
Table 91 Bayer Materialscience: Products & It Applications
Table 92 CCP Composites: Products & Its Applications
Table 93 ENI: Products & Its Applications
Table 94 ENI: Annual Revenue, By Business Segments,2011 - 2012 ($Million)
Table 95 Ineos Abs: Products & Its Applications
Table 96 Ineos Styrenics: Products & Its Applications
Table 97 Lanxess: Products & Its Applications
Table 98 Lanxess: Annual Revenue, By Business Segments,2011 - 2012 ($Million)
Table 99 Nizhnekamskneftekhim OAO: Product Specification
Table 100 Nova Chemicals: Products & Its Applications
Table 101 Nova Chemicals: Annual Revenue, By Business Segments,2011 - 2012 ($Million)
Table 102 Reichhold: Products & Its Applications
Table 103 Repsol: Products & Its Applications
Table 104 Royal DSM: Products & Its Applications
Table 105 Sabic: Products & Its Applications
Table 106 Sibur: Products & Its Applications
Table 107 Sibur: Annual Revenue, By Business Segments,2011 - 2012 ($Million)
Table 108 Styrolution: Products & Its Applications
Table 109 Styrolution: Annual Revenue, By Products,2011 � 2012 ($Million)
Table 110 Styron: Products & Its Applications
Table 111 Synthos: Products & Its Applications
Table 112 Synthos: Annual Revenue, By Business Segments,2011 - 2012 ($Million)
Table 113 Dow: Products & Its Applications
Table 114 Dow: Total Revenue, By Business Segments,2011 � 2012 ($Million)
Table 115 Total: Products & Its Applications
Table 116 Total: Annual Revenue, By Business Segments,2011 - 2012 ($Million)
List Of Figures (36 Figure)
Figure 1 Styrenics Market Volume, By Polymer Types & Geography, 2012 (Kt)
Figure 2 Styrenics Market Segmentation
Figure 3 Styrenics Market Scenario, By Geography,2013 � 2018
Figure 4 Styrenics Market Forecast To 2018
Figure 5 Styrenics Market Revenue Trend, By Geography,2011 � 2018 ($Million)
Figure 6 Styrenics Market Volume, By Polymer Types & Geography, 2013 (Kt)
Figure 7 Styrenics Market Share, By Applications, 2012
Figure 8 Year Wise Strategic Developments
Figure 9 Number Of Patents, By Geography, 2011 � 2013
Figure 10 Growth Strategies Of Top 4 Companies, 2010 � 2013
Figure 11 Types Of Styrenics
Figure 12 Value Chain For Styrenics Market
Figure 13 Oil Import Price Estimates, 2000 � 2030
Figure 14 Impact Of Drivers On Styrenics Market
Figure 15 Global Cumulative Installed Wind Capacity,2005 � 2012
Figure 16 Price & Performance Analysis Of Resins
Figure 17 Impact Of Restraints On Styrenics Market
Figure 18 Impact Of Opportunities On Styrenics Market
Figure 19 Investment In Infrastructure Development: Emerging Economies, 2008 � 2017
Figure 20 Butadiene Consumption, By Geography, 2012
Figure 21 Acrylonitrile Consumption, By End Products, 2012
Figure 22 Styrenics Market: Porter�s Five Forces
Figure 23 Patent Analysis, By Geography, 2011 � 2018
Figure 24 Patent Analysis, By Years, 2011 � 2013
Figure 25 Number Of Patents, By Companies, 2011 � 2013
Figure 26 Styrenics Market, By Geography
Figure 27 Styrenics: Market Consumption Share, By Geography, 2012
Figure 28 Styrenics: Market Developments, By Companies,2010 � 2013
Figure 29 Styrenics: Market Developments, By Types,2010 � 2013
Figure 30 Styrenics: Market Developments, By Years,2010 � 2013
Figure 31 Expansions, 2010 � 2013
Figure 32 New Products Launch/Developments, 2010 � 2013
Figure 33 Agreements, 2010 � 2013
Figure 34 Mergers & Acquisitions/Joint Ventures/Partnerships,2010 � 2012
Figure 35 Sibur: Business Segments & Products
Figure 36 Styrolution: Market Share, By Geography, 2012


Growth opportunities and latent adjacency in Styrenics Market