Transfection Reagents and Equipment Market by Method (Biochemical (Calcium Phosphate, Lipofection, Dendrimers), Physical (Electroporation, Nucleofection), Viral)), Application (Biomedical, Protein Production), End User - Global Forecast to 2021


[209 Pages Report] The global transfection reagent market includes forecast from 2016 to 2021. This market is expected to reach USD 1.02 Billion by 2021 from USD 715.4 Million in 2016, at a CAGR of 7.5% during the forecast period. This growth can be attributed to factors such as advancements in transfection technology, global alliances among leading research institutes to trigger drug discovery, increase in R&D spending and research activities by pharmaceutical and biotechnology companies, increase in demand for synthetic genes, and rising incidence of cancer. Moreover, development of large scale transfections, rising demand of protein therapeutics, and emerging markets across India and China are likely to create opportunities for players operating in the market.
The global transfection equipment market is segmented on the basis of product, method, application, end user, and region. Based on product, the market is segmented into reagents and instruments. In 2016, the reagents segment is estimated to account for the largest share of the market. However, the instruments segment is expected to grow at the highest CAGR during the forecast period.
On the basis of end user, the transfection reagent market is segmented into academic & research institutes and pharmaceutical & biotechnologies companies. In 2016, the academic & research institutes segment is expected to account for the largest share of the market. On the basis of method, the market is segmented into biochemical, physical, and viral methods. In 2016, the biochemical method segment is expected to account for the largest share of the market, while the viral method segment is expected to grow at the highest CAGR during the forecast period. The biochemical method segment is further classified into calcium phosphate, lipofection DEAE-dextran, and dendrimer. Whereas, the physical method segment is further divided into electroporation, nucleofection, and others (gengun, sonoporation, magnetofection, and optoinjection).
On basis of application, the transfection equipment market is segmented into biomedical research, protein production, and therapeutic delivery. In 2016, the biomedical research segment is estimated to account for the largest share of the transfection reagent market.
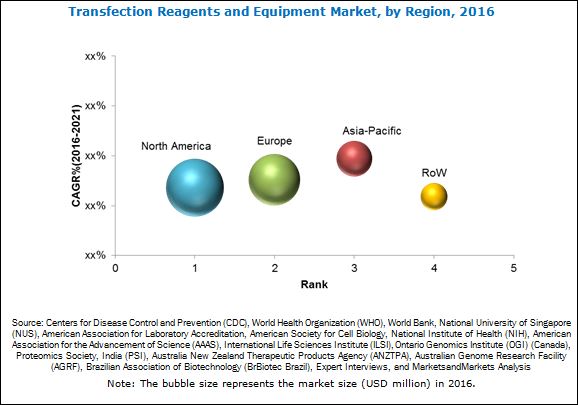
North America is expected to account for the largest share of the transfection reagent market, followed by Europe and Asia-Pacific. The largest share can be attributed to the increase in bio-based drug research, increase in demand for protein therapeutics, and increasing investment for development of biologics in the country. The Asia-Pacific transfection reagent market is slated to grow at the highest CAGR during the forecast period and serve as a major revenue pocket for companies offering transfection reagents and equipment.
Some of the prominent players in the transfection reagent market include Thermo Fisher Scientific Inc. (U.S.), Promega Corporation (U.S.), Hoffmann-La Roche Ltd. (Switzerland), QIAGEN N.V. (Netherlands). Polyplus-transfection SA (France), Bio-Rad Laboratories (U.S.), Lonza Group (Switzerland), Sigma-Aldrich Corporation (U.S.), Mirus Bio LLC (U.S.), and MaxCyte Inc. (U.S.).
Target Audience
- Biopharmaceutical companies
- Biotechnology companies
- Transfection equipment, reagent, and kit manufacturing companies
- Suppliers and distributors of transfection reagents
- Research institutes
- Academic centers
- Venture capitalists
To know about the assumptions considered for the study, download the pdf brochure
Scope of the Report:
This research report categorizes the transfection reagent market into the following segments:
Transfection Reagent Market, by Product
- Reagents
- Instruments
Transfection Reagent Market, by Method
- Biochemical
- Calcium Phosphate
- Lipofection
- DEAE-dextran
- Dendrimers
- Physical
- Electroporation
- Nucleofection
- Others (Genegun, Sonoporation, Magnetofection, and Optoinjection)
- Viral
Transfection Reagent Market, by Application
- Biomedical Research
- Gene Expression Studies
- Cancer Research
- Transgenic Model
- Protein Production
- Therapeutic Deli very
Transfection Reagent Market, by End User
- Academic & Research Institutes
- Pharmaceutical & Biotechnology Companies
Transfection Reagent Market, by Region
-
North America
- U.S.
- Canada
-
Europe
- Germany
- U.K.
- Rest of Europe (RoE)
-
Asia-Pacific
- Japan
- China
- India
- Rest of APAC (RoAPAC)
-
Rest of the World (RoW)
- Latin America
- Middle East and Africa
Available Customizations
- With the given market data, MarketsandMarkets offers customizations as per the company’s specific needs. The following customization option is available for the report:
Portfolio Assessment
- Product Matrix, which gives a detailed comparison of the product portfolios of the top three companies in the market.
The global transfection reagent market is expected to reach USD 1.02 Billion by 2021 from USD 715.4 Million in 2016, at a CAGR of 7.5% during the forecast period. The key factors driving the growth of this market are technology advancements in transfections, global alliances among leading research institutes to trigger drug discovery, increase in R&D spending and research activities by pharmaceutical and biotechnology companies, increase in demand for synthetic genes, and rising incidence of cancer. On the other hand, factors such as selective effectiveness of transfection reagents, home brew reagents by researchers, and high cost of transfection reagents are expected to limit the growth of the transfection reagent market.
The global transfection equipment market is segmented on the basis of product, method, application, end user, and region. On the basis of product, the market is segmented into reagents and instruments. In 2016, the reagents segment is estimated to account for the largest share of the transfection reagent market. However, the instruments segment is expected to grow at the highest CAGR during the forecast period.
On the basis of method, the transfection reagent market is segmented into biochemical, physical, and viral. In 2016, the biochemical method segment is expected to command the largest share of the market. However, the viral method segment is projected to grow at the highest CAGR during the forecast period. The biochemical method segment is further divided into calcium phosphate, lipofection, DEAE-dextran, and dendrimer. In 2016, the lipofection segment is likely to account for the largest share of the transfection reagent market. Similarly, the physical method segment is classified into electroporation, nucleofection, and others (genegun, sonoporation, magnetofection, and optoinjection). In 2016, the electroporation segment is projected to account for the highest share of the market.
On the basis of end user, the transfection equipment market is segmented into academic & research institutes and pharmaceutical & biotechnologies companies. In 2016, the academic & research institutes is expected to account for the largest share of the market. However, the pharmaceutical & biotechnologies companies segment is projected to grow at the highest CAGR during the forecast period.
On the basis of application, the transfection reagent market is segmented into biomedical research, protein production, and therapeutic delivery. In 2016, the biomedical research segment is poised to account for the largest share of the transfection reagent market. However, the therapeutic delivery segment is expected to grow at the highest CAGR during the forecast period.
On the basis of region, the global transfection reagent market is segmented into North America, Europe, Asia-Pacific, and RoW. In 2016, North America is poised to account for the largest share of the market, followed by Europe and Asia-Pacific. However, the Asia-Pacific market is slated to grow at the highest CAGR during the forecast period and serve as a major revenue pocket for companies offering transfection reagents and equipment.
Some of the major players in the global transfection reagent market include Thermo Fisher Scientific, Inc. (U.S.), Promega Corporation (U.S.), Hoffmann-La Roche Ltd. (Switzerland), QIAGEN N.V. (Netherlands), Polyplus-transfection SA (France), Bio-Rad Laboratories (U.S.), Lonza Group (Switzerland), Sigma-Aldrich Corporation (U.S.), Mirus Bio LLC (U.S.), and MaxCyte Inc.(U.S.).
To speak to our analyst for a discussion on the above findings, click Speak to Analyst
 Exclusive indicates content/data unique to MarketsandMarkets and not available with any competitors.
Table of Contents
1 Introduction (Page No. - 19)
1.1 Objectives of the Study
1.2 Transfection Reagent Market Definition
1.3 Transfection Reagent Market Scope
1.3.1 Markets Covered
1.3.2 Years Considered for the Study
1.4 Currency
1.5 Limitations
1.6 Stakeholders
2 Research Methodology (Page No. - 22)
2.1 Research Methodology Steps
2.2 Secondary and Primary Research Methodology
2.2.1 Secondary Research
2.2.1.1 Key Data From Secondary Sources
2.2.2 Primary Research
2.2.2.1 Key Data From Primary Sources
2.2.2.2 Key Insights From Primary Sources
2.2.2.3 Key Industry Insights
2.3 Transfection Reagent Market Size Estimation Methodology
2.3.1 Market Forecast Methodology
2.4 Market Data Validation and Triangulation
2.5 Assumptions
3 Executive Summary (Page No. - 32)
3.1 Introduction
3.2 Conclusion
4 Premium Insights (Page No. - 37)
4.1 Global Transfection Technologies Market
4.2 Transfection Technologies Market, By Application & Region
4.3 Geographic Snapshot: Transfection Technologies Market
4.4 Transfection Technologies Market, By Product (2016 vs 2021)
4.5 Transfection Technologies Market, By End User, 2016 vs 2021 (USD Million)
5 Market Overview (Page No. - 41)
5.1 Introduction
5.2 Transfection Reagent Market Dynamics
5.2.1 Drivers
5.2.1.1 Technological Advancements in Transfection Technology
5.2.1.1.1 Crispr-Cas9
5.2.1.1.2 Car-T
5.2.1.1.3 Three Dimension (3D) Transfection Technology
5.2.1.2 Global Alliances Among Leading Research Institutes to Trigger Drug Discovery
5.2.1.3 Increase in R&D Spending and Research Activities By Pharmaceutical and Biotech Companies
5.2.1.4 Growing Research Activities in Cell Science
5.2.1.5 Increase in Demand for Synthetic Genes
5.2.1.6 Rising Incidence of Cancer Worldwide
5.2.2 Restraints
5.2.2.1 Selective Effectiveness of Transfection Reagents
5.2.2.2 Home Brew Reagents Restrict Sale of Commercial Kits
5.2.2.3 High Cost of Transfection Reagents
5.2.3 Opportunities
5.2.3.1 Large-Scale Transfections
5.2.3.2 High-Growth Opportunities in Asian Market
5.2.3.2.1 India
5.2.3.2.2 China
5.2.4 Challenges
5.2.4.1 Transfection in Hard-To-Transfect Cells
5.2.4.2 Cytotoxicity in Transfection - A Major Concern
6 Transfection Technologies Market, By Product (Page No. - 51)
6.1 Introduction
6.2 Reagents
6.3 Equipment
7 Transfection Technologies Market, By Method (Page No. - 56)
7.1 Introduction
7.2 Biochemical Methods
7.2.1 Lipofection
7.2.1.1 Advantages
7.2.1.2 Disadvantages
7.2.2 Calcium Phosphate
7.2.2.1 Advantages
7.2.2.2 Disadvantages
7.2.3 Deae-Dextran
7.2.3.1 Advantages
7.2.3.2 Disadvantages
7.2.4 Dendrimers
7.2.4.1 Advantages
7.2.4.2 Disadvantages
7.3 Physical
7.3.1 Electroporation
7.3.1.1 Advantages
7.3.1.2 Disadvantages
7.3.2 Nucleofection
7.3.2.1 Advantages
7.3.2.2 Disadvantages
7.3.3 Other Methods
7.3.3.1 Sonoporation
7.3.3.2 Genegun
7.3.3.2.1 Advantages
7.3.3.2.2 Disadvantages
7.3.3.3 Magnetofection
7.3.3.3.1 Advantages
7.3.3.3.2 Disadvantages
7.3.3.4 Optoinjection
7.3.3.4.1 Advantages
7.3.3.4.2 Disadvantages
7.4 Viral Methods
7.4.1 Adenoviruses
7.4.2 Retroviruses
7.4.3 Adenoassociated Viruses (AAV)
8 Transfection Technologies Market, By Application (Page No. - 73)
8.1 Introduction
8.2 Biomedical Research
8.2.1 Gene Expression Studies
8.2.2 Cancer Research
8.2.3 Transgenic Models
8.3 Protein Production
8.4 Therapeutic Delivery
9 Transfection Technologies Market, By End User (Page No. - 83)
9.1 Introduction
9.2 Academics & Research Institutes
9.3 Pharmaceutical & Biotechnology Companies
10 Transfection Technologies Market, By Region (Page No. - 88)
10.1 Introduction
10.2 North America
10.2.1 U.S.
10.2.1.1 Increase in Bio-Based Drug Research
10.2.1.2 Growing Demand for Protein-Based Therapeutics Triggers the Growth of U.S. Market
10.2.1.3 Increasing Funding for Biotechnology and for Development of Protein-Based Biologics
10.2.1.4 Conferences/Meetings/Symposiums/Workshops
10.2.2 Canada
10.2.2.1 Government Support for Development of Protein Drugs is Expected to Drive the Market for Transfection Technologies
10.2.2.2 Increasing Investments By the Canadian Government on Regenerative Medicine to Drive Market Growth
10.2.2.3 Increasing Funding for Genome Engineering in Canada Likely to Boost Transfection Technologies Market
10.3 Europe
10.3.1 Germany
10.3.1.1 Growing Biotech Industry and Research Funding in Germany
10.3.1.2 Collaboration Among Bio-Pharmaceutical and Biotechnology Companies for the Development of New Vaccines is Likely to Drive the Market Growth
10.3.1.3 Conferences and Meetings/Workshops in Germany
10.3.1.4 Availability of Funding for Life Science Research in Germany
10.3.2 U.K.
10.3.2.1 10,000 Genome Project Initiative in U.K.
10.3.2.2 Initiative to Increase R&D Investments in U.K.
10.3.3 Rest of Europe
10.3.3.1 Growing Biotechnology and Pharma Industry in Italy
10.3.3.2 Focus on Research in Spain
10.3.3.3 Investments and Funding for Life Sciences to Drive the Transfection Technologies Market
10.3.3.4 Growing Research Investments in Sweden & Denmark
10.4 Asia-Pacific
10.4.1 Japan
10.4.1.1 Rise in Biomedical Research in Japan
10.4.2 China
10.4.2.1 Chinese Government Initiatives for Life Sciences R&D Likely to Boost the Market
10.4.2.2 Industry Initiative to Boost Transfection Technology Market in China
10.4.3 India
10.4.3.1 Booming Pharmaceutical and Biotechnology Industries
10.4.3.2 Development of Bio-Clusters in India
10.4.4 Rest of Asia-Pacific
10.4.4.1 Federal Collaborations in Australia
10.4.4.2 Funding for Research on Proteomics and Genomics in Australia
10.4.4.3 Rising Pharmaceutical and Biotechnology R&D Activities in South Korea
10.4.4.4 Government Support for Strong Academic and Commercial R&D Activities in Taiwan
10.4.4.5 Genome Asia 100k Initative
10.5 Rest of the Word (RoW)
10.5.1 Latin America
10.5.1.1 Increasing Investment in Brazil and Mexico
10.5.1.2 Brazil: Investment in Research and Innovation Centers and Conferences & Workshops
10.5.2 Middle East & Africa
10.5.2.1 Increasing Focus of Major Pharmaceutical, Biopharmaceutical, and Biotechnology Firms in Saudi Arabia and the United Arab Emirates (UAE) and African Regions
10.5.2.2 Genetic Testing and Genomic Analysis in the Middle East
11 Competitive Landscape (Page No. - 161)
11.1 Overview
11.2 Transfection Reagent Market Share Analysis
11.2.1 Introduction
11.2.2 Thermo Fisher Scientific Inc.
11.2.3 Promega Corporation
11.2.4 F. Hoffmann-La Roche Ltd
11.2.5 Qiagen N.V.
11.3 Competitive Situation and Trends
11.4 Agreements, Collaborations and Partnerships
11.5 New Product Launches
11.6 Expansions
11.7 Acquisitions
11.8 Other Strategies
12 Company Profiles (Page No. - 172)
(Overview, Products and Services, Financials, Strategy & Development)*
12.1 Thermo Fisher Scientific Inc. (Life Technologies)
12.2 Promega Corporation
12.3 Qiagen N.V.
12.4 F. Hoffmann-La Roche Ltd
12.5 Bio–Rad Laboratories, Inc.
12.6 Maxcyte, Inc.
12.7 Lonza Group Ltd.
12.8 Merck KGaA
12.9 Polyplus-Transfection Sa (Subsidary of Archimed)
12.10 Mirus Bio LLC.
*Details on Overview, Products and Services, Financials, Strategy & Development Might Not Be Captured in Case of Unlisted Companies.
13 Appendix (Page No. - 198)
13.1 Discussion Guide
13.2 Other Developments
13.2.1 Maxcyte Inc.
13.2.2 Lonza Group Ltd.
13.2.3 Qiagen N.V.
13.3 Knowledge Store: Marketsandmarkets’ Subscription Portal
13.4 Introducing RT: Real-Time Market Intelligence
13.5 Available Customizations
13.6 Related Reports
13.7 Author Details
List of Tables (134 Tables)
Table 1 Indicative List of Cell-Based Research Studies
Table 2 Transfection Technologies Market Size, By Product, 2014–2021 (USD Million)
Table 3 Transfection Reagent Market Size, By Region, 2014–2021 (USD Million)
Table 4 Transfection Instruments Market Size, By Region, 2014–2021 (USD Million)
Table 5 Transfection Technologies Market Size, By Method, 2014–2021 (USD Million)
Table 6 Biochemical Transfection Technology Market Size, By Type, 2014–2021 (USD Million)
Table 7 Biochemical Transfection Technologies Market Size, By Region, 2014–2021 (USD Million)
Table 8 Lipofection Transfection Technologies Market Size, By Region, 2014–2021 (USD Million)
Table 9 Transfection Technologies Market Size for Calcium Phosphate Method, By Region, 2014–2021 (USD Million)
Table 10 Deae-Dextran Transfection Technologies Market Size, By Region, 2014–2021 (USD Million)
Table 11 Dendrimer Transfection Technologies Market Size, By Region, 2014–2021 (USD Million)
Table 12 Physical Transfection Technology Market Size, By Type, 2014–2021 (USD Million)
Table 13 Physical Transfection Technologies Market Size, By Region, 2014–2021 (USD Million)
Table 14 Electroporation Transfection Technologies Market Size, By Region, 2014–2021 (USD Million)
Table 15 Nucleofection Transfection Technologies Market Size, By Region, 2014–2021 (USD Million)
Table 16 Other Physical Transfection Technologies Market Size, By Region, 2014–2021 (USD Million)
Table 17 Viral Systems
Table 18 Viral Transfection Technologies Market Size, By Region, 2014–2021 (USD Million)
Table 19 Transfection Technology Market Size, By Application, 2014–2021 (USD Million)
Table 20 Transfection Technologies Market Size for Biomedical Research, By Type, 2014-2021 (USD Million)
Table 21 Transfection Technologies Market Size for Biomedical Research, By Region, 2014-2021 (USD Million)
Table 22 Transfection Reagent Market Size for Gene Expression Studies, By Region, 2014-2021 (USD Million)
Table 23 Transfection Technologies Market Size for Cancer Research, By Region, 2014-2021 (USD Million)
Table 24 Transfection Technologies Market Size for Transgenic Models, By Region, 2014-2021 (USD Million)
Table 25 Indicative List of Few Recombinant Proteins, Vaccines From Different Cell Types
Table 26 Transfection Technologies Market Size for Protein Production, By Region, 2014-2021 (USD Million)
Table 27 Indicative List of Drug Delivery Systems for Various Disease Conditions
Table 28 Transfection Technology Market Size for Therapeutic Delivery, By Region, 2014-2021 (USD Million)
Table 29 Transfection Technologies Market Size, By End User, 2014–2021 (USD Million)
Table 30 Transfection Technologies Market Size for Academics & Research Institutes, By Region, 2014–2021 (USD Million)
Table 31 Transfection Reagent Market Size for Pharmaceutical & Biotechnology Companies, By Region, 2014–2021 (USD Million)
Table 32 Transfection Technologies Market Size, By Region, 2014-2021 (USD Million)
Table 33 North America: Transfection Technology Market Size, By Country, 2014–2021 (USD Million)
Table 34 North America: Transfection Technologies Market Size, By Product, 2014-2021 (USD Million)
Table 35 North America: Transfection Technologies Market Size, By Method, 2014-2021 (USD Million)
Table 36 North America: Biochemical Transfection Technologies Market Size, By Type, 2014-2021 (USD Million)
Table 37 North America: Physical Transfection Technologies Market Size, By Type, 2014-2021 (USD Million)
Table 38 North America: Transfection Technologies Market Size, By Application, 2014-2021 (USD Million)
Table 39 North America: Transfection Reagent Market Size for Biomedical Research, By Type, 2014-2021 (USD Million)
Table 40 North America: Transfection Technologies Market Size, By End User, 2014-2021 (USD Million)
Table 41 List of Monoclonal Antibodies Approved By Fda in 2015
Table 42 Indicative List of Upcoming Events in the U.S.
Table 43 U.S.: Transfection Technology Market Size, By Product, 2014-2021 (USD Million)
Table 44 U.S.: Transfection Technologies Market Size, By Method, 2014-2021 (USD Million)
Table 45 U.S.: Biochemical Transfection Technologies Market Size, By Type, 2014-2021 (USD Million)
Table 46 U.S.: Physical Transfection Technologies Market Size, By Type, 2014-2021 (USD Million)
Table 47 U.S.: Transfection Technologies Market Size, By Application, 2014-2021 (USD Million)
Table 48 U.S.: Transfection Technologies Market Size for Biomedical Research, By Type, 2014-2021 (USD Million)
Table 49 U.S.: Transfection Reagent Market Size, By End User, 2014-2021 (USD Million)
Table 50 Canada: Transfection Technology Market Size, By Product, 2014-2021 (USD Million)
Table 51 Canada: Transfection Technologies Market Size, By Method, 2014-2021 (USD Million)
Table 52 Canada: Biochemical Transfection Technologies Market Size, By Type, 2014-2021 (USD Million)
Table 53 Canada: Physical Transfection Technologies Market Size, By Type, 2014-2021 (USD Million)
Table 54 Canada: Transfection Technologies Market Size, By Application, 2014-2021 (USD Million)
Table 55 Canada: Transfection Technologies Market Size for Biomedical Research, By Type, 2014-2021 (USD Million)
Table 56 Canada: Transfection Reagent Market Size, By End User, 2014-2021 (USD Million)
Table 57 Europe: Transfection Technology Market Size, By Country, 2014–2021 (USD Million)
Table 58 Europe: Transfection Technologies Market Size, By Product, 2014–2021 (USD Million)
Table 59 Europe: Transfection Technologies Market Size, By Method, 2014–2021 (USD Million)
Table 60 Europe: Transfection Technologies Market Size for Biochemical Method, By Type, 2014–2021 (USD Million)
Table 61 Europe: Transfection Technologies Market Size for Physical Method, By Type, 2014–2021 (USD Million)
Table 62 Europe: Transfection Technologies Market Size, By Application, 2014–2021 (USD Million)
Table 63 Europe: Transfection Technologies Market Size for Biomedical Research, By Type, 2014–2021 (USD Million)
Table 64 Europe: Transfection Reagent Market Size, By End User, 2014–2021 (USD Million)
Table 65 Indicative List of Upcoming Events in Germany
Table 66 Germany: Transfection Technology Market Size, By Product, 2014–2021 (USD Million)
Table 67 Germany: Transfection Technologies Market Size, By Method, 2014–2021 (USD Million)
Table 68 Germany: Transfection Technologies Market Size for Biochemical Method, By Type, 2014–2021 (USD Million)
Table 69 Germany: Transfection Technologies Market Size for Physical Method, By Type, 2014–2021 (USD Million)
Table 70 Germany: Transfection Technologies Market Size, By Application, 2014–2021 (USD Million)
Table 71 Germany: Transfection Technologies Market Size for Biomedical Research, By Type, 2014–2021 (USD Million)
Table 72 Germany: Transfection Reagent Market Size, By End User, 2014–2021 (USD Million)
Table 73 U.K.: Transfection Technology Market Size, By Product, 2014–2021 (USD Million)
Table 74 U.K.: Transfection Technologies Market Size, By Method, 2014–2021 (USD Million)
Table 75 U.K.: Transfection Technologies Market Size Biochemical Method, By Type 2014–2021 (USD Million)
Table 76 U.K.: Transfection Technologies Market Size Physical Method, By Type 2014–2021 (USD Million)
Table 77 U.K.: Transfection Technologies Market Size, By Application, 2014–2021 (USD Million)
Table 78 U.K.: Transfection Technologies Market Size for Biomedical Research, By Type, 2014–2021 (USD Million)
Table 79 U.K.: Transfection Reagent Market Size, By End User, 2014–2021 (USD Million)
Table 80 Rest of Europe: Transfection Technology Market Size, By Product, 2014–2021 (USD Million)
Table 81 Rest of Europe: Transfection Technologies Market Size, By Method, 2014–2021 (USD Million)
Table 82 Rest of Europe: Transfection Technologies Market Size for Biochemical Method, By Type, 2014–2021 (USD Million)
Table 83 Rest of Europe: Transfection Technologies Market Size for Physical Method, By Type, 2014–2021 (USD Million)
Table 84 Rest of Europe: Transfection Technologies Market Size, By Application, 2014–2021 (USD Million)
Table 85 Rest of Europe: Transfection Technologies Market Size for Biomedical Research, By Type, 2014–2021 (USD Million)
Table 86 Rest of Europe: Transfection Reagent Market Market Size, By End User, 2014–2021 (USD Million)
Table 87 Asia-Pacific: Transfection Technology Market Size, By Country, 2014–2021 (USD Million)
Table 88 Asia-Pacific: Transfection Technologies Market Size, By Product, 2014–2021 (USD Million)
Table 89 Asia-Pacific: Transfection Technologies Market Size, By Method, 2014–2021 (USD Million)
Table 90 Asia-Pacific: Biochemical Transfection Technologies Market Size, By Type, 2014–2021 (USD Million)
Table 91 Asia-Pacific: Physical Transfection Technologies Market Size, By Type, 2014–2021 (USD Million)
Table 92 Asia-Pacific: Transfection Technologies Market Size, By Application, 2014–2021 (USD Million)
Table 93 Asia-Pacific: Transfection Technologies Market Size for Biomedical Research, By Type, 2014–2021 (USD Million)
Table 94 Asia-Pacific: Transfection Reagent Market Size, By End User, 2014–2021 (USD Million)
Table 95 Japan: Transfection Technology Market Size, By Product, 2014–2021 (USD Million)
Table 96 Japan: Transfection Technologies Market Size, By Method, 2014–2021 (USD Million)
Table 97 Japan: Biochemical Transfection Technologies Market Size, By Type, 2014–2021 (USD Million)
Table 98 Japan: Physical Transfection Technologies Market Size, By Type, 2014–2021 (USD Million)
Table 99 Japan: Transfection Technologies Market Size, By Application, 2014–2021 (USD Million)
Table 100 Japan: Transfection Technologies Market Size for Biomedical Research, By Type, 2014–2021 (USD Million)
Table 101 Japan: Transfection Reagent Market Size, By End User, 2014–2021 (USD Million)
Table 102 China: Transfection Technology Market Size, By Product, 2014–2021 (USD Million)
Table 103 China: Transfection Technologies Market Size, By Method, 2014–2021 (USD Million)
Table 104 China: Biochemical Transfection Technologies Market Size, By Type, 2014–2021 (USD Million)
Table 105 China: Physical Transfection Technologies Market Size, By Type, 2014–2021 (USD Million)
Table 106 China: Transfection Technologies Market Size, By Application, 2014–2021 (USD Million)
Table 107 China: Transfection Technologies Market Size for Biomedical Research, By Type, 2014–2021 (USD Million)
Table 108 China: Transfection Reagent Market Size, By End User, 2014–2021 (USD Million)
Table 109 India: Transfection Technology Market Size, By Product, 2014–2021 (USD Million)
Table 110 India: Transfection Technologies Market Size, By Method, 2014–2021 (USD Million)
Table 111 India: Transfection Technologies Market Size for Biochemical Method, By Type, 2014–2021 (USD Million)
Table 112 India: Physical Transfection Technologies Market Size, By Type, 2014–2021 (USD Million)
Table 113 India: Transfection Technologies Market Size, By Application, 2014–2021 (USD Million)
Table 114 India: Transfection Technologies Market Size for Biomedical Research, By Type, 2014–2021 (USD Million)
Table 115 India: Transfection Reagent Market Size, By End User, 2014–2021 (USD Million)
Table 116 Rest of Asia-Pacific: Transfection Technology Market Size, By Product, 2014–2021 (USD Million)
Table 117 Rest of Asia-Pacific: Transfection Technologies Market Size, By Method, 2014–2021 (USD Million)
Table 118 Rest of Asia-Pacific: Biochemical Transfection Technologies Market Size, By Type, 2014–2021 (USD Million)
Table 119 Rest of Asia-Pacific: Physical Transfection Technologies Market Size, By Type, 2014–2021 (USD Million)
Table 120 Rest of Asia-Pacific: Transfection Technologies Market Size, By Application, 2014–2021 (USD Million)
Table 121 Rest of Asia-Pacific: Transfection Technologies Market Size for Biomedical Research, By Type, 2014–2021 (USD Million)
Table 122 Rest of Asia-Pacific: Transfection Reagent Market Size, By End User, 2014–2021 (USD Million)
Table 123 RoW: Transfection Technology Market Size, By Product, 2014–2021 (USD Million)
Table 124 RoW: Transfection Technologies Market Size, By Method, 2014–2021 (USD Million)
Table 125 RoW: Transfection Technologies Market Size for Biochemical Method, By Type, 2014–2021 (USD Million)
Table 126 RoW: Transfection Technologies Market Size for Physical Method, By Type, 2014–2021 (USD Million)
Table 127 RoW: Transfection Technologies Market Size, By Application, 2014-2021 (USD Million)
Table 128 RoW: Transfection Technologies Market Size for Biomedical Research, By Type, 2014-2021 (USD Million)
Table 129 RoW: Transfection Reagent Market Size, By End User, 2014-2021 (USD Million)
Table 130 Agreements, Collaborations, and Partnerships 2013–2016
Table 131 New Product Launches, 2013-2016
Table 132 Expansions, 2013–2016
Table 133 Acquisitions, 2013–2016
Table 134 Other Strategies, 2013–2016
List of Figures (43 Figures)
Figure 1 Research Methodology: Global Transfection Reagent Market
Figure 2 Break Down of Primary Interviews: By Company Type, Designation, and Region
Figure 3 Sampling Frame: Primary Research
Figure 4 Transfection Reagent Market Size Estimation Methodology: Bottom-Up Approach
Figure 5 Market Size Estimation Methodology: Top-Down Approach
Figure 6 Research Design: Global Transfection Technologies Market
Figure 7 Data Triangulation Methodology
Figure 8 Transfection Technologies Market, By Method (2016)
Figure 9 Transfection Technologies Market, By Product (2016–2021)
Figure 10 Transfection Reagent Market, By End User, 2016 vs 2021
Figure 11 Transfection Technologies Market, By Application, 2016 vs 2021 (USD Million)
Figure 12 Asia-Pacific is Projected to Witness the Highest Growth in the Transfection Technologies Market During the Forecast Period
Figure 13 North America is Estimated to Account for the Largest Market Share in 2016
Figure 14 Biomedical Research Segment to Dominate the Transfection Technologies Market in 2016
Figure 15 Asia-Pacific is Projected to Witness the Highest Growth Rate During the Forecast Period
Figure 16 Reagents Segment is Projected to Account for the Largest Share Through 2021
Figure 17 Academic & Research Institutes Segment is Expected to Dominate the Market Through 2021
Figure 18 Transfection Reagent Market Dynamics
Figure 19 Transfection Technology Market Size, By Product, 2016–2021 (USD Million)
Figure 20 Transfection Technologies Market, By Method, 2016 vs 2021 (USD Million)
Figure 21 Transfection Technology Market: By Application
Figure 22 Transfection Technologies Market Size, By End User, 2016 vs 2021 (USD Million)
Figure 23 Transfection Reagent Market: By Region, 2016-2021
Figure 24 North America: Transfection Reagent Market Snapshot
Figure 25 Europe : Transfection Reagent Market Snapshot
Figure 26 Asia-Pacific: Transfection Reagent Market Snapshot
Figure 27 Agreements, Collaborations, and Partnerships, are the Major Strategies Adopted By the Key Players, 2013–2016
Figure 28 Global Transfection Reagent Market Share, By Key Player, 2015
Figure 29 Agreements,Collaborations, and Partnerships: Key Strategy Adopted By Players (2013–2016)
Figure 30 Agreements, Collaborations and Partnerships, By Company (2013–2016)
Figure 31 New Product Launches, By Company (2013–2016)
Figure 32 Expansions, By Company (2013–2016)
Figure 33 Acquisition, By Company (2013–2016)
Figure 34 Other Strategies, By Company (2013–2016)
Figure 35 Thermo Fisher Scientific Inc.: Company Snapshot
Figure 36 Promega Corporation: Company Snapshot
Figure 37 Qiagen N.V.: Company Snapshot
Figure 38 Roche: Company Snapshot
Figure 39 Bio-Rad Laboratories: Company Snapshot
Figure 40 Maxcyte Inc.: Company Snapshot
Figure 41 Lonza Group: Company Snapshot
Figure 42 Merck KGaA : Company Snapshot
Figure 43 Sigma Aldrich Corporation : Company Snapshot

 Generating Response ...


Growth opportunities and latent adjacency in Transfection Reagents and Equipment Market