Unmanned Composites Market by Application (Interior, Exterior), Platform (UAV, USV, UGV, AUV, ROV, Passenger Drones, Autonomous Ships), Type (CFRP, GFRP, AFRP, BFRP), Subtype (Fiber, Matrix) and Region - Global Forecast From 2025 to 2035


The global unmanned composites market is witnessing transformative growth driven by the convergence of advanced materials, autonomous systems, and defense modernization programs. With an expanding range of applications across unmanned aerial, surface, and underwater platforms, composites are becoming central to achieving superior strength to weight ratios, stealth features, and endurance in mission critical environments. Between 2025 and 2035, the market will evolve rapidly as demand for lighter, more fuel efficient, and high performance materials surges across both military and commercial domains.
Download PDF Brochure: https://www.marketsandmarkets.com/pdfdownloadNewNew.asp?id=242948844
Market Overview: A Lightweight Revolution for Unmanned Systems
The unmanned composites market is an essential enabler of next generation unmanned systems. Composites, especially carbon fiber reinforced polymers (CFRP) and glass fiber reinforced polymers (GFRP), provide high structural integrity with minimal weight, allowing extended operational range and payload capacity. This advantage has made them indispensable in the manufacturing of UAVs (unmanned aerial vehicles), USVs (unmanned surface vehicles), UGVs (unmanned ground vehicles), AUVs (autonomous underwater vehicles), and ROVs (remotely operated vehicles).
The integration of composites in unmanned systems also aligns with broader aerospace and defense trends emphasizing sustainability, fuel efficiency, and modular design. The rising adoption of passenger drones and autonomous ships is further broadening the market’s horizon, creating a lucrative landscape for composite manufacturers.
Technological Advancements Driving Market Growth
Between 2025 and 2035, continuous technological evolution will redefine the design, manufacturing, and performance of composite materials. Innovations in additive manufacturing, nano engineered resins, and fiber architectures are allowing composite structures to achieve unprecedented stiffness, resilience, and thermal stability.
Manufacturers are leveraging digital twins and AI driven predictive modeling to optimize composite layouts and reduce development cycles. The adoption of hybrid composites combining carbon, glass, and aramid fibers is addressing the need for multi functional materials that can simultaneously handle stress, vibration, and temperature variations.
Market Segmentation by Application: Interior vs. Exterior
Interior Applications
Composites are playing an increasingly vital role in the interior design of unmanned platforms. For UAVs and autonomous aircraft, interior composite panels are utilized to reduce weight while maintaining rigidity. Lightweight materials also enable better energy efficiency and accommodate advanced avionics systems. In underwater and ground platforms, composite interiors contribute to improved insulation, noise dampening, and vibration control.
Exterior Applications
The majority of market demand originates from exterior applications where composites must endure extreme weather, pressure, and impact conditions. CFRP and GFRP are predominantly used for fuselage skins, hulls, propeller blades, and structural frames. For UAVs and passenger drones, composite exteriors enhance aerodynamic performance, stealth, and corrosion resistance. Naval platforms such as USVs and AUVs benefit from composites’ anti corrosion and pressure resilient properties, ensuring long operational lifetimes in saline and high pressure environments.
Market Segmentation by Platform
Unmanned Aerial Vehicles (UAVs)
UAVs represent the largest and most dynamic platform segment. The widespread use of drones in military surveillance, mapping, logistics, and commercial deliveries is accelerating demand for carbon and glass composites. Lightweight composite airframes improve flight time and payload capacity while maintaining structural strength and radar absorption characteristics for stealth missions.
Unmanned Surface Vehicles (USVs)
In the maritime defense and research domains, USVs rely on composite hulls for hydrodynamic performance and long term durability. CFRP and AFRP (aramid fiber reinforced polymers) provide a balance between strength and impact resistance, crucial for high speed and endurance based operations.
Unmanned Ground Vehicles (UGVs)
UGVs are increasingly used in defense, mining, and hazardous environments. Composites enable these vehicles to reduce weight, increase agility, and withstand rugged terrain. The thermal resistance of composites also supports the integration of sensors and weapon systems without compromising performance.
Autonomous Underwater Vehicles (AUVs) and Remotely Operated Vehicles (ROVs)
Underwater platforms face unique challenges of pressure, corrosion, and buoyancy. Composite materials are ideal for these systems because they can maintain structural integrity at depth while reducing overall vehicle mass. The use of GFRP and hybrid composites enables efficient underwater maneuverability and longer mission durations.
Passenger Drones and Autonomous Ships
The introduction of electric vertical takeoff and landing (eVTOL) passenger drones is opening new avenues for composite applications. Lightweight and durable materials are essential to ensure safety, efficiency, and sustainability in urban air mobility systems. Similarly, autonomous ships utilize advanced composites for hull and deck structures to enhance efficiency, reduce emissions, and enable modular upgrades.
Market Segmentation by Type
Carbon Fiber Reinforced Polymer (CFRP)
CFRP dominates the unmanned composites market due to its superior tensile strength, stiffness, and lightweight characteristics. The aerospace and defense sectors prefer CFRP for applications requiring durability and stealth capabilities. High production costs and recycling challenges remain key barriers to mass adoption.
Glass Fiber Reinforced Polymer (GFRP)
GFRP serves as a cost effective alternative to carbon composites. It offers good strength, corrosion resistance, and flexibility, making it suitable for naval and underwater platforms. GFRP is extensively used in ROVs and AUVs where weight to cost ratio plays a critical role.
Aramid Fiber Reinforced Polymer (AFRP)
AFRP materials are favored for their exceptional impact and abrasion resistance. They are particularly suitable for ground and combat oriented unmanned platforms where armor protection is required alongside mobility.
Basalt Fiber Reinforced Polymer (BFRP)
BFRP is gaining traction as a sustainable composite option, leveraging natural basalt fibers to deliver strength and thermal resistance comparable to glass fibers but with improved eco friendliness and cost efficiency.
Market Segmentation by Subtype: Fiber and Matrix
Fiber Segment
Fiber technologies are at the core of composite innovation. Continuous fiber manufacturing techniques, including automated fiber placement (AFP), are enabling large scale, high precision composite structures. Advances in carbon nanotube infused fibers are improving electrical conductivity and damage tolerance, expanding their usability in next generation unmanned systems.
Matrix Segment
The matrix, responsible for binding fibers and distributing loads, is evolving through innovations in resin chemistry. Thermoplastic and thermoset matrices are being refined for higher heat resistance, faster curing, and recyclability. Hybrid matrix systems are also being explored to create multi phase composites with tunable mechanical and thermal properties.
Regional Outlook (2025–2035)
North America will continue to dominate the global unmanned composites market due to strong defense investment, a mature aerospace ecosystem, and the presence of key players such as Boeing, Lockheed Martin, and General Atomics. The U.S. Department of Defense is increasingly emphasizing lightweight composite adoption in UAV and naval programs.
Europe follows closely, driven by stringent environmental regulations and R&D in sustainable composite manufacturing. The European Union’s focus on green materials is spurring innovations in BFRP and recyclable CFRP solutions.
Asia Pacific is emerging as a fast growing region, with countries like China, Japan, and India expanding domestic unmanned systems production. The rise of commercial drone industries and autonomous shipping initiatives in the region will further boost demand.
The Middle East and Africa are gradually adopting composite based unmanned platforms for surveillance and oil & gas monitoring applications. Latin America is also witnessing growth through agricultural and infrastructure applications of drones and UGVs.
Competitive Landscape and Key Players
The global unmanned composites market is characterized by technological partnerships, mergers, and innovation driven competition. Major composite material suppliers and unmanned system manufacturers are integrating vertically to streamline design and production processes.
Leading players include Hexcel Corporation, Toray Industries, Teijin Limited, and Solvay S.A., all investing heavily in advanced resin systems and carbon fiber technologies. Companies such as Northrop Grumman, Airbus, and BAE Systems are integrating these composites into new generations of UAVs and autonomous vehicles.
The growing emphasis on sustainability is driving new entrants to develop eco friendly composites, focusing on recyclability and reduced life cycle emissions. Collaborations between material scientists, AI engineers, and unmanned system developers are fostering innovation across the ecosystem.
Market Drivers and Opportunities
The increasing adoption of unmanned systems across military, commercial, and civil applications is a primary growth driver. Defense modernization programs worldwide prioritize autonomous technologies, which in turn elevate the need for lightweight and durable composite materials.
Emerging opportunities include the integration of smart composites capable of self healing and structural health monitoring. These materials can detect and respond to stress or damage autonomously, enhancing reliability and operational safety.
The shift toward electrification and hybrid propulsion in UAVs and drones will further stimulate demand for high performance composites that can accommodate battery integration without structural compromise.
Challenges and Future Outlook
Despite robust growth prospects, the unmanned composites market faces challenges such as high production costs, complex recycling processes, and limited standardization. Manufacturers must balance performance with cost efficiency to support the mass adoption of autonomous systems.
Over the next decade, research efforts will focus on improving composite manufacturability through automation, AI based design optimization, and scalable production techniques. By 2035, sustainable and multifunctional composites will define the next era of unmanned systems, blending strength, intelligence, and environmental responsibility.
The Future of Unmanned Systems Lies in Composites
The period from 2025 to 2035 marks a transformative decade for the unmanned composites market. As autonomy, AI, and advanced materials converge, composites will serve as the structural and functional backbone of future unmanned platforms across air, land, sea, and underwater domains. The ongoing pursuit of lightweight efficiency, durability, and sustainability will redefine global defense, logistics, and transportation ecosystems.
The unmanned composites market is not merely an extension of aerospace materials technology it is the foundation of an interconnected, intelligent, and sustainable autonomous future.
 Exclusive indicates content/data unique to MarketsandMarkets and not available with any competitors.
Table of Contents
1 Introduction (Page No. - 24)
1.1 Objectives of the Study
1.2 Market Definition
1.3 Market Scope
1.3.1 Regional Scope
1.3.2 Years Considered for the Study
1.4 Currency
1.5 Limitations
1.6 Stakeholders
2 Research Methodology (Page No. - 28)
2.1 Research Data
2.1.1 Secondary Data
2.1.1.1 Key Data From Secondary Sources
2.1.2 Primary Data
2.1.2.1 Key Data From Primary Sources
2.1.3 Market Definition & Scope
2.2 Research Approach & Methodology
2.2.1 Step By Step Approach
2.2.2 Bottom-Up Approach
2.2.3 Top-Down Approach
2.3 Triangulation & Validation
2.3.1 Triangulation Through Secondary
2.3.2 Triangulation Through Primaries
2.4 Research Assumptions
2.4.1 Market Sizing and Market Forecasting
2.5 Risks Analysis
3 Executive Summary (Page No. - 37)
4 Premium Insights (Page No. - 40)
4.1 Attractive Opportunities in the Unmanned Composites Market From 2019 to 2025
4.2 Unmanned Composites Market, By Type
4.3 Unmanned Composites Market, By Platform
4.4 Unmanned Composites Market, By Country
5 Market Overview (Page No. - 42)
5.1 Introduction
5.2 Market Dynamics
5.2.1 Drivers
5.2.1.1 Increasing Need for Weight Reduction in Unmanned Systems
5.2.1.2 Improved Performance of Unmanned Systems Using Composite Materials
5.2.1.3 Increased Reliability & Durability of Composite Materials
5.2.2 Restraints
5.2.2.1 High Manufacturing Cost of Unmanned Systems Using Composite Materials
5.2.2.2 Lack of Standardization in Composite Materials
5.2.3 Opportunities
5.2.3.1 Growing Demand for Unmanned Systems in the Commercial Sector
5.2.3.2 Increased Spending By Manufacturers of Unmanned Systems in Composite Materials
5.2.4 Challenges
5.2.4.1 Recyclability of Composite Materials
5.2.4.2 High Repairing Cost of Composite Materials
6 Industry Trends (Page No. - 46)
6.1 Introduction
6.2 Industry Trends
6.2.1 Aerospace Applications
6.2.2 Reduction in Manufacturing Cost Through Weight Reduction Achieved Using Composite Materials
6.2.3 Automotive Applications
6.2.4 Reduction in Manufacturing Cost Through Weight Reduction Achieved Using Composite Materials
6.2.5 Marine Applications
6.2.6 Reduction in Manufacturing Cost Through Weight Reduction Achieved Using Composite Materials
6.2.7 Properties of Composites and Their Advantages in Marine
6.3 Current Applications of Composite Materials, By Industry
6.3.1 Aerospace Applications of Composite Materials
6.3.2 Automotive Applications of Composite Materials
6.3.3 Utility & Power Applications of Composite Materials
6.3.4 Infrastructure Applications of Composite Materials
6.3.5 Marine Applications of Composite Materials
6.4 Composition of Composites Materials in Unmanned Systems
6.4.1 Composition of Composites Materials in Unmanned Aerial Vehicle
6.4.2 Composition of Composites Materials in Unmanned Ground Vehicle
6.4.3 Composition of Composites Materials in Unmanned Surface Vehicle
6.4.4 Composition of Composites Materials in Unmanned Underwater Vehicle
6.5 Emerging Technologies in Unmanned Composites Market
6.5.1 Cellulose-Based Carbon Fiber
6.5.2 Hybrid Smart Memory Composites
6.5.3 3D Printing Components
6.6 Emerging Innovations in Composite Materials
6.6.1 Natural Fiber Innovations
6.6.2 Carbon Fiber Innovations
6.6.3 Glass Fiber Innovations
6.6.4 Compounds Fiber Innovations
6.6.5 Resin Fiber Innovations
6.6.6 Core Materials Fiber Innovations
6.7 Weight Saving Potential of Composite Materials
7 Unmanned Composites Market, By Type (Page No. - 55)
7.1 Introduction
7.2 Carbon Fiber Reinforced Polymer By Subsegment
7.2.1 Carbon Fiber
7.2.1.1 Maximum Demand for Carbon Fiber for Commercial Use
7.2.2 Matrix
7.2.2.1 Increase in use of Matrix in Industry to Retain Strength and Shape at All Temperature
7.3 Glass Fiber Reinforced Polymer
7.3.1 Glass Fiber Reinforced Polymer, By Subsegment
7.3.1.1 Glass Fiber
7.3.1.1.1 Massive Demand of Glass Fiber for Structures of Navy, Aircraft, and Vehicles
7.3.1.2 Matrix
7.3.1.2.1 Maximum Used in Unmanned Systems Structural Components
7.4 Boron Fiber Reinforced Polymer
7.4.1 Boron Fiber Reinforced Polymer, By Subsegment
7.4.1.1 Boron Fiber
7.4.1.1.1 Increasing Adoption of Boron Fiber for Aerospace Application
7.4.1.2 Matrix
7.4.1.2.1 Graphite Epoxy Matrix is Used to Improve the Overall Fiber Properties
7.5 Aramid Fiber Reinforced Polymer
7.5.1 Aramid Fiber Reinforced Polymer, By Subsegment
7.5.1.1 Aramid Fiber
7.5.1.1.1 Aramid Fiber is a Man-Made Organic Polymer Maximally Used for Ballistic Application
7.5.1.2 Matrix
7.5.1.2.1 Epoxy Matrix is Used in BFRP Which is Comparatively Tough and Flexible Than Other Composites
8 Unmanned Composites Market, By Platform (Page No. - 64)
8.1 Introduction
8.2 UAV
8.2.1 Class II (150–600 Kg)
8.2.1.1 Rise in Demand for Long-Range Unmanned Aircraft for Military Application is Driving the Growth of Class II UAVs
8.2.2 Class III (>600 Kg)
8.2.2.1 Rise in Demand for Long Range Combat Capabilities is Driving the Growth of Class III UAVs
8.3 UAV, By Composite Type
8.3.1 Carbon Fiber Reinforced Polymer
8.3.2 Glass Fiber Reinforced Polymer
8.3.3 Boron Fiber Reinforced Polymer
8.3.4 Aramid Fiber Reinforced Polymer
8.4 UGV
8.4.1 Medium (200–500 Lbs)
8.4.1.1 Medium Land Robots Carry Out Critical Missions, Such as Isr Operations, Detection, and Monitoring
8.4.2 Large (500–1,000 Lbs)
8.4.2.1 Large Land Robots Have a High Demand for Military Applications
8.4.3 Very Large (1,000–2,000 Lbs)
8.4.3.1 Very Large Robots Have High Endurance and are Used for Long-Range Operations
8.4.4 Extremely Large (>2,000 Lbs)
8.4.4.1 Extremely Large Robots are Being Explored for use in Military as Well as Commercial Applications
8.5 UGV, By Composite Type
8.5.1 Carbon Fiber Reinforced Polymer
8.5.2 Glass Fiber Reinforced Polymer
8.5.3 Boron Fiber Reinforced Polymer
8.5.4 Aramid Fiber Reinforced Polymer
8.6 ROV
8.6.1 Small Vehicles
8.6.1.1 Underwater Inspection and Observation Applications From the Marine and Oil & Gas Industries are Driving the Demand for Small
Vehicles
8.6.2 High-Capacity Electric Vehicles
8.6.2.1 Underwater Surveillance is Driving the Demand for High-Capacity Electric Vehicles
8.6.3 Work Class Vehicles
8.6.3.1 Growth of Work Class Vehicles is Mainly Attributed to Their Increasing Applicability for Drill Support and Oceanic Surveys
8.6.4 Heavy Work Class Vehicles
8.6.4.1 Rise in Subsea Intervention Activities is Driving the Growth of Heavy Work Class Vehicles
8.7 ROV, By Composite Type
8.7.1 Carbon Fiber Reinforced Polymer
8.7.2 Glass Fiber Reinforced Polymer
8.7.3 Boron Fiber Reinforced Polymer
8.7.4 Aramid Fiber Reinforced Polymer
8.8 USV
8.8.1 Small
8.8.1.1 Small-Sized USVs are Gaining Traction in the Commercial Sector, Owing to Their Wide Range of Applications
8.8.2 Large
8.8.2.1 Large-Sized USVs are Increasingly Used for Mine Countermeasure Mission, Anti-Submarine Warfare, and Maritime Shield
8.8.3 Medium
8.8.3.1 Medium-Sized USVs are Increasingly Used for Pre-War and Post-War Maintenance and Support By Naval Forces
8.8.4 Extra Large
8.8.4.1 Extra-Large-Sized USVs are Used for Missions That Require Large Payloads and High Autonomy
8.9 USV, By Composite Type
8.9.1 Carbon Fiber Reinforced Polymer
8.9.2 Glass Fiber Reinforced Polymer
8.9.3 Boron Fiber Reinforced Polymer
8.9.4 Aramid Fiber Reinforced Polymer
8.10 AUV
8.10.1 Man-Portable Vehicles
8.10.1.1 Rise in Demand for Non-Destructive Testing is Driving the Demand for Man-Portable Vehicles
8.10.2 Lightweight Vehicles
8.10.2.1 Rise in Demand From the Oil & Gas Industry for Underwater Pipeline Inspections is Driving the Growth of Lightweight Vehicles
8.10.3 Heavyweight Vehicles
8.10.3.1 Bathymetry Surveying is Driving the Growth of the Heavyweight Vehicles Category
8.10.4 Large Vehicles
8.10.4.1 Rise in Deep-Sea Surveying Applications is Driving the Demand for Large AUVs
8.11 AUV, By Composite Type
8.11.1 Carbon Fiber Reinforced Polymer
8.11.2 Glass Fiber Reinforced Polymer
8.11.3 Boron Fiber Reinforced Polymer
8.11.4 Aramid Fiber Reinforced Polymer
8.12 Passenger Drones
8.12.1 Rise in Demand for Urban Air Mobility is Driving the Market for Passenger Drones
8.13 Passenger Drones, By Composite Type
8.13.1 Carbon Fiber Reinforced Polymer
8.13.2 Glass Fiber Reinforced Polymer
8.13.3 Boron Fiber Reinforced Polymer
8.13.4 Aramid Fiber Reinforced Polymer
8.14 Autonomous Ships
8.14.1 Increasing Investments on the Development of Autonomous Ships are Expected to Drive the Market for Unmanned Composites
8.15 Autonomous Ships, By Composite Type
8.15.1 Carbon Fiber Reinforced Polymer
8.15.2 Glass Fiber Reinforced Polymer
8.15.3 Boron Fiber Reinforced Polymer
8.15.4 Aramid Fiber Reinforced Polymer
9 Unmanned Composites Market, By Application (Page No. - 81)
9.1 Introduction
9.2 Interior
9.2.1 Cabin
9.2.1.1 UAV Cabins Made of Composites Have Resulted in 40-50% Weight Reduction
9.2.2 Sandwich Panel
9.2.2.1 Demand for High Strength Sandwich Panel is Anticipated to Rise the Demand for Unmanned Composites
9.2.3 Deck
9.2.3.1 Increased Efficiency of Unmanned Surface Vehicles Due to Composites is Expected to Drive the Demand for Unmanned Composites
9.3 Exterior
9.3.1 Fuselage
9.3.1.1 Reduce Maintenance Cost of Fuselage Made of Composites is Anticipated to Drive the Growth of Unmanned Composites During the Forecast Period
9.3.2 Engine
9.3.2.1 Composites Providing Significant Efficiency Boost to the Engine Cycle is Expected to Drive the Demand for Composites in Future
9.3.3 Wing
9.3.3.1 Need for Fuel Efficiency By UAVs is Anticipated to Increase the Demand for Unmanned Composites During the Forecast Period
9.3.4 Rotor Blade
9.3.4.1 Demand for Cost-Efficient, Reliable and Durable Rotor Blades By UAVs is Anticipated to Drive the Demand for Unmanned Composites
9.3.5 Tail Boom
9.3.5.1 Tail Booms of Rotary Wing UAVs Made With Composites are 30% Lighter Reducing the Overall Weight of UAV
9.3.6 Hull
9.3.6.1 Rise in Demand for Glass Reinforced Composites By Deep-Submergence Unmanned Vehicles is Anticipated to Drive the Demand for
Unmanned Composites
9.4 Passenger Drones, By Application
9.4.1.1 Exterior
9.4.1.2 Interior
9.5 Autonomous Ships, By Application
9.5.1.1 Exterior
9.5.1.2 Interior
10 Unmanned Composites Adjacent Market (Page No. - 90)
10.1 Aerospace Composites Market, By Fiber Type
10.1.1 Introduction
10.1.1.1 Carbon Fiber Composites
10.1.1.2 Ceramic Fiber Composites
10.1.1.3 Glass Fiber Composites
10.1.1.4 Others
10.2 Aerospace Composites Market, By Aircraft Type
10.2.1 Introduction
10.2.1.1 Commercial Aircraft
10.2.1.1.1 Single Aisle Aircraft
10.2.1.1.2 Wide Body Aircraft
10.2.1.1.3 Regional Jets
10.2.1.2 Business and General Aviation
10.2.1.2.1 Business Jet
10.2.1.2.2 Piston & Turboprop
10.2.1.3 Civil Helicopter
10.2.1.4 Military Aircraft
10.2.1.5 Others
10.2.1.5.1 Unmanned Aerial Vehicles (UAV)
10.2.1.5.2 Spacecraft
11 Unmanned Composites Market, By Region (Page No. - 93)
11.1 Introduction
11.2 North America
11.2.1 US
11.2.1.1 Rise in Demand for Unmanned Systems for Military Application is Driving the Market Growth in the US
11.2.2 Canada
11.2.2.1 In-House Development of Unmanned Systems is Driving the Market for Unmanned Composites in Canada
11.3 Europe
11.3.1 Russia
11.3.1.1 Presence of Major Companies Producing Advanced Composites Contribute to the Growth of the Market in Russia
11.3.2 UK
11.3.2.1 Key Market Players in the UK are Focusing on Collaborating With Research Institutes to Increase the Adoption of Unmanned Composites
11.3.3 Germany
11.3.3.1 Rise in Production of Unmanned Composites By Leading Vendors Drives the Market Growth in Germany
11.3.4 France
11.3.4.1 Increase in Deliveries of Unmanned Systems By Leading Oems Drives the Market Growth in France
11.3.5 Sweden
11.3.5.1 Commercialization of Drone Technology in the Country is Driving the Market for Unmanned Composites
11.3.6 Italy
11.3.6.1 Italian Civil Aviation Authority (ENAC) has Updated Regulations for Drones for Civilian & Commercial Applications
11.4 Asia Pacific
11.4.1 China
11.4.1.1 Increasing Deployment of Unmanned Systems Such as USVs and ROVs is Driving the Market for Unmanned Composites in China
11.4.2 Japan
11.4.2.1 Development of USVs and Autonomous Ships in the Country Drives the Market for Unmanned Composites in Japan
11.4.3 India
11.4.3.1 Government Initiative for Domestic Production of Unmanned Systems Through Make in India Program is Driving the Growth of Unmanned Composites Market
11.4.4 Australia
11.4.4.1 Growing use of UGVs for Search and Track Operations is Boosting the Demand for Unmanned Composites in Australia
11.4.5 South Korea
11.4.5.1 Large Capital Investments in Unmanned Technology are Driving the Unmanned Composites Market in South Korea
11.4.6 Rest of Asia Pacific
11.4.6.1 Demand for Unmanned Systems for Maritime Application is Driving the Rest of Asia Pacific Unmanned Composites Market
11.5 Middle East
11.5.1 Israel
11.5.1.1 Presence of Key Unmanned Systems Manufacturers Fuels the Market for Unmanned Composites in Israel
11.5.2 Turkey
11.5.2.1 Increased Procurement of Unmanned Systems for Homeland Security Missions Boosts the Unmanned Composites Market in Turkey
11.5.3 UAE
11.5.3.1 Commercial Application of Unmanned Systems is Driving the Demand for Unmanned Composites in the Country
11.6 Rest of the World
12 Competitive Landscape (Page No. - 131)
12.1 Overview
12.2 Competitive Analysis
12.3 Market Ranking Analysis
12.4 OEM Competitive Leadership Mapping
12.4.1 Visionary Leaders
12.4.2 Innovators
12.4.3 Dynamic Differentiators
12.4.4 Emerging Companies
12.5 Start-Up Competitive Leadership Mapping
12.5.1 Progressive Companies
12.5.2 Responsive Companies
12.5.3 Dynamic Companies
12.5.4 Starting Blocks
12.6 Competitive Scenario
12.6.1 New Product Launches and Developments
12.6.2 Contracts, Partnerships, and Agreements
12.6.3 Other Strategies
13 Company Profiles (Page No. - 144)
13.1 Introduction
13.2 Hexcel Corporation
13.2.1 Business Overview
13.2.2 Products Offered
13.2.3 Recent Developments
13.2.4 SWOT Analysis
13.2.5 MnM View
13.3 Toray Industries, Inc.
13.3.1 Business Overview
13.3.2 Products Offered
13.3.3 Recent Developments
13.3.4 SWOT Analysis
13.3.5 MnM View
13.4 Stratasys Ltd.
13.4.1 Business Overview
13.4.2 Product Offered
13.4.3 Recent Developments
13.4.4 SWOT Analysis
13.4.5 MnM View
13.5 Teledyne
13.5.1 Business Overview
13.5.2 Products Offered
13.5.3 Recent Developments
13.5.4 SWOT Analysis
13.5.5 MnM View
13.6 Gurit
13.6.1 Business Overview
13.6.2 Products Offered
13.6.3 Recent Developments
13.6.4 SWOT Analysis
13.6.5 MnM View
13.7 Solvay
13.7.1 Business Overview
13.7.2 Products Offered
13.7.3 Recent Developments
13.7.4 SWOT Analysis
13.7.5 MnM View
13.8 Owens Corning
13.8.1 Business Overview
13.8.2 Products Offered
13.8.3 Recent Developments
13.8.4 SWOT Analysis
13.8.5 MnM View
13.9 Materion Corporation
13.9.1 Business Overview
13.9.2 Products Offered
13.9.3 Recent Developments
13.9.4 MnM View
13.10 Mitsubishi Rayon Co. Ltd.
13.10.1 Business Overview
13.10.2 Products Offered
13.10.3 Recent Developments
13.10.4 MnM View
13.11 Renegade Materials Corporation
13.11.1 Business Overview
13.11.2 Products Offered
13.11.3 MnM View
13.12 Teijin Limited
13.12.1 Business Overview
13.12.2 Products Offered
13.12.3 Recent Developments
13.12.4 SWOT Analysis
13.12.5 MnM View
13.13 Unitech Aerospace
13.13.1 Business Overview
13.13.2 Products Offered
13.13.3 Recent Developments
13.14 Carbon By Design
13.14.1 Business Overview
13.14.2 Products Offered
13.14.3 Recent Developments
13.14.4 SWOT Analysis
13.15 Quantum Composites
13.15.1 Business Overview
13.15.2 Products Offered
13.15.3 Recent Developments
14 Appendix (Page No. - 180)
14.1 Discussion Guide
14.2 Knowledge Store: Marketsandmarkets’ Subscription Portal
14.3 Available Customizations
14.4 Related Reports
14.5 Author Details
List of Tables (158 Tables)
Table 1 Unmanned Composite Market Size, By Type, 2017–2025 (USD Million)
Table 2 Unmanned Composite Market Size, By Region, 2017–2025 (USD Million)
Table 3 Unmanned Composite Market Size, By Region, 2017–2025 (Kiloton)
Table 4 Carbon Fiber Reinforced Polymer Market Size, By Region, 2017–2025 (USD Million)
Table 5 Carbon Fiber Composites Market Size, By Region, 2017–2025 (Kiloton)
Table 6 Carbon Fiber Reinforced Polymer Market Size, By Subsegment, 2017–2025 (USD Million)
Table 7 Glass Fiber Reinforced Polymer Market Size, By Region, 2017–2025 (USD Million)
Table 8 Glass Fiber Reinforced Polymer Market Size, By Region, 2017–2025 (Kiloton)
Table 9 Glass Fiber Reinforced Polymer Market Size, By Subsegment, 2017–2025 (USD Million)
Table 10 Boron Fiber Reinforced Polymer Market Size, By Region, 2017–2025 (USD Million)
Table 11 Boron Fiber Reinforced Polymer Market Size, By Region, 2017–2025 (Kiloton)
Table 12 Boron Fiber Reinforced Polymer Market Size, By Subsegment, 2017–2025 (USD Million)
Table 13 Aramid Fiber Reinforced Polymer Market Size, By Region, 2017–2025 (USD Million)
Table 14 Aramid Fiber Reinforced Polymer Market Size, By Region, 2017–2025 (Kiloton)
Table 15 Aramid Fiber Reinforced Polymer Market Size, By Subsegment, 2017–2025 (USD Million)
Table 16 Unmanned Composites Market Size, By Platform, 2017–2025 (USD Million)
Table 17 Unmanned Composites Market Size, By Platform, 2017–2025 (Kiloton)
Table 18 UAV Segment, By Subtype, 2017–2025(USD Million)
Table 19 UAV Segment, By Region, 2017–2025 (USD Million)
Table 20 Unmanned Composites Market Size for UAV, By Composite Type, 2017–2025 (USD Million)
Table 21 Unmanned Composites Market Size for UAV, By Composite Type, 2017–2025 (Kiloton)
Table 22 UGV Segment, By Subtype, 2017–2025 (USD Million)
Table 23 UGV Segment, By Region, 2017–2025 (USD Million)
Table 24 UGV Segment, By Region, 2017–2025 (Kiloton)
Table 25 Unmanned Composites Market Size for UGV, By Composite Type, 2017–2025 (USD Million)
Table 26 ROV Segment, By Subtype, 2017–2025 (USD Million)
Table 27 ROV Segment, By Region, 2017–2025 (USD Million)
Table 28 ROV Segment, By Region, 2017–2025 (Kiloton)
Table 29 Unmanned Composites Market Size for ROV, By Composite Type, 2017–2025 (USD Million)
Table 30 Unmanned Composites Market Size for ROV, By Composite Type, 2017–2025 (Kiloton)
Table 31 USV Segment, By Subtype, 2017–2025 (USD Million)
Table 32 ROV Segment, By Region, 2017–2025 (USD Million)
Table 33 ROV Segment, By Region, 2017–2025 (Kiloton)
Table 34 Unmanned Composites Market Size for USV, By Composite Type, 2017–2025 (USD Million)
Table 35 Unmanned Composites Market Size for USV, By Composite Type, 2017–2025 (Kiloton)
Table 36 AUV Segment, By Subtype, 2017–2025 (USD Million)
Table 37 AUV Segment, By Subtype, 2017–2025 (USD Million)
Table 38 AUV Segment, By Subtype, 2017–2025 (Kiloton)
Table 39 Unmanned Composite Market Size for AUV, By Composite Type, 2017–2025 (USD Million)
Table 40 Unmanned Composite Market Size for AUV, By Composite Type, 2017–2025 (Kiloton)
Table 41 Major Developments in the Field of Drone Taxies
Table 42 Passenger Drones Segment, By Region, 2017–2025 (USD Million)
Table 43 Passenger Drones Segment, By Region, 2017–2025 (Kiloton)
Table 44 Unmanned Composite Market Size for Passenger Drones, By Composite Type, 2017–2025 (USD Million)
Table 45 Unmanned Composite Market Size for Passenger Drones, By Composite Type, 2017–2025 (Kiloton)
Table 46 Autonomous Ships, By Region, 2017–2025 (USD Million)
Table 47 Autonomous Ships, By Region, 2017–2025 (Kiloton)
Table 48 Unmanned Composite Market Size for Autonomous Ships, By Composite Type, 2017–2025 (USD Million)
Table 49 Unmanned Composite Market Size for Autonomous Ships, By Composite Type, 2017–2025 (Kiloton)
Table 50 Unmanned Composite Market Size, By Application, 2017–2025 (USD Million)
Table 51 Interior Segment of Unmanned Composite Market Size, By Region, 2017–2025 (USD Million)
Table 52 Interior Segment of Unmanned Composite Market Size, By Composite Type, 2017–2025 (USD Million)
Table 53 Interior Segment of Unmanned Composite Market Size, By Region, 2017–2025 (Kiloton)
Table 54 Exterior Segment of Unmanned Composite Market Size, By Region, 2017–2025 (USD Million)
Table 55 Exterior Segment of Unmanned Composite Market Size, By Composite Type, 2017–2025 (USD Million)
Table 56 Exterior Segment of Unmanned Composite Market Size, By Region, 2017–2025 (Kiloton)
Table 57 Passenger Drones Unmanned Composite Market Size, By Application, 2017–2025 (USD Million)
Table 58 Passenger Drones Unmanned Composite Market Size, By Application, 2017–2025 (Kiloton)
Table 59 Passenger Drones Unmanned Composite Market Size, By Application, 2017–2025 (Kiloton)
Table 60 Autonomous Ships Unmanned Composite Market Size, By Application, 2017–2025 (USD Million)
Table 61 Autonomous Ships Unmanned Composite Market Size, By Application, 2017–2025 (Kiloton)
Table 62 Carbon Fiber Composites Market Size, By Region, 2015–2022 (USD Million)
Table 63 Carbon Fiber Composites Market Size, By Region, 2015–2022 (Kiloton)
Table 64 Carbon Fiber Composites Market Size, By Region, 2015–2022 (Kiloton)
Table 65 Ceramic Fiber Composites Market Size, By Region, 2015–2022 (USD Million)
Table 66 Ceramic Fiber Composites Market Size, By Region, 2015–2022 (Kiloton)
Table 67 Glass Fiber Composites Market Size, By Region, 2015–2022 (USD Million)
Table 68 Other Fiber Composites Market Size, By Region, 2015–2022 (USD Million)
Table 69 Other Fiber Composites Market Size, By Region, 2015–2022 (Kiloton)
Table 70 Aerospacee Compoiste Market, By Fiber Type, 2015–2022 (USD Billion)
Table 71 Aerospace Composites Market Size, By Fiber Type, 2015–2022 (Kiloton)
Table 72 Aerospace Composite Market Size, By Aircraft Type, 2015–2022 (USD Million) 147
Table 73 Aerospace Composite Market Size, By Aircraft Type, 2015–2022 (Kiloton)
Table 74 Aerospace Composite Market in Commercial Aircraft, By Region, 2015–2022 (USD Million)
Table 75 Aerospace Composite Market in Commercial Aircraft, By Region, 2015–2022 (Kiloton)
Table 76 By Market Size in Business and General Aviation, By Region, 2015–2022 (USD Million)
Table 77 By Market Size in Business and General Aviation, By Region, 2015–2022 (Kiloton)
Table 78 Aerospace Composite Market in Civil Helicopter, By Region, 2015–2022 (USD Million)
Table 79 Aerospace Composite Market in Civil Helicopter, By Region, 2015–2022 (Kiloton)
Table 80 Aerospace Composite Market Size in Military Aircraft, By Region, 2015–2022 (USD Million)
Table 81 Aerospace Composite Market Size in Military Aircraft, By Region, 2015–2022 (Kiloton)
Table 82 Aerospace Composite Market Size in Other Aircrafts, By Region, 2015–2022 (USD Million)
Table 83 Aerospace Composite Market Size in Other Aircrafts, By Region, 2015–2022 (Kiloton)
Table 84 Unmanned Composite Market Size, By Region, 2017–2025 (USD Million)
Table 85 North America: Unmanned Composite Market Size, By Type, 2017–2025 (USD Million)
Table 86 North America: Unmanned Composite Market Size, By Application, 2017–2025 (USD Million)
Table 87 North America: Unmanned Composite Market Size, By Platform, 2017–2025 (USD Million)
Table 88 North America: Unmanned Composite Market Size, By Country, 2017–2025 (USD Million)
Table 89 US: Unmanned Composite Market Size, By Type, 2017–2025 (USD Million)
Table 90 US: Unmanned Composite Market Size, By Application, 2017–2025 (USD Million)
Table 91 US: Unmanned Composite Market Size, By Platform, 2017–2025 (USD Million)
Table 92 Canada: Unmanned Composite Market Size, By Type, 2017–2025 (USD Million)
Table 93 Canada: Unmanned Composite Market Size, By Application, 2017–2025 (USD Million)
Table 94 Canada: Unmanned Composite Market Size, By Platform, 2017–2025 (USD Million)
Table 95 Europe: Unmanned Composite Market Size, By Type, 2017–2025 (USD Million)
Table 96 Europe: Unmanned Composite Market Size, By Application, 2017–2025 (USD Million)
Table 97 Europe: Unmanned Composite Market Size, By Platform, 2017–2025 (USD Million)
Table 98 Europe: Unmanned Composite Market Size, By Country, 2017–2025 (USD Million)
Table 99 Russia: Unmanned Composite Market Size, By Type, 2017–2025 (USD Million)
Table 100 Russia: Unmanned Composite Market Size, By Application, 2017–2025 (USD Million)
Table 101 Russia: Unmanned Composite Market Size, By Platform, 2017–2025 (USD Million)
Table 102 UK: Unmanned Composite Market Size, By Type, 2017–2025 (USD Million)
Table 103 UK: Unmanned Composite Market Size, By Application, 2017–2025 (USD Million)
Table 104 UK: Unmanned Composite Market Size, By Platform, 2017–2025 (USD Million)
Table 105 Germany: Unmanned Composite Market Size, By Type, 2017–2025 (USD Million)
Table 106 Germany: Unmanned Composite Market Size, By Application, 2017–2025 (USD Million)
Table 107 Germany: Unmanned Composite Market Size, By Platform, 2017–2025 (USD Million)
Table 108 France: Unmanned Composite Market Size, By Type, 2017–2025 (USD Million)
Table 109 France: Unmanned Composite Market Size, By Application, 2017–2025 (USD Million)
Table 110 France: Unmanned Composite Market Size, By Platform, 2017–2025 (USD Million)
Table 111 Sweden: Unmanned Composite Market Size, By Type, 2017–2025 (USD Million)
Table 112 Sweden: Unmanned Composite Market Size, By Application, 2017–2025 (USD Million)
Table 113 Sweden: Unmanned Composite Market Size, By Platform, 2017–2025 (USD Million)
Table 114 Italy: Unmanned Composite Market Size, By Type, 2017–2025 (USD Million)
Table 115 Italy: Unmanned Composite Market Size, By Application, 2017–2025 (USD Million)
Table 116 Italy: Unmanned Composite Market Size, By Platform, 2017–2025 (USD Million)
Table 117 Asia Pacific: Unmanned Composite Market Size, By Type, 2017–2025 (USD Million)
Table 118 Asia Pacific: Unmanned Composite Market Size, By Application, 2017–2025 (USD Million)
Table 119 Asia Pacific: Unmanned Composite Market Size, By Country, 2017–2025 (USD Million)
Table 120 Asia Pacific: Unmanned Composite Market Size, By Platform, 2017–2025 (USD Million)
Table 121 China: Unmanned Composite Market Size, By Type, 2017–2025 (USD Million)
Table 122 China: Unmanned Composite Market Size, By Application, 2017–2025 (USD Million)
Table 123 China: Unmanned Composite Market Size, By Platform, 2017–2025 (USD Million)
Table 124 Japan: Unmanned Composite Market Size, By Type, 2017–2025 (USD Million)
Table 125 Japan: Unmanned Composite Market Size, By Application, 2017–2025 (USD Million)
Table 126 Japan: Unmanned Composite Market Size, By Platform, 2017–2025 (USD Million)
Table 127 India: Unmanned Composite Market Size, By Type, 2017–2025 (USD Million)
Table 128 India: Unmanned Composite Market Size, By Application, 2017–2025 (USD Million)
Table 129 India: Unmanned Composite Market Size, By Platform, 2017–2025 (USD Million)
Table 130 Australia: Unmanned Composite Market Size, By Type, 2017–2025 (USD Million)
Table 131 Australia: Unmanned Composite Market Size, By Application, 2017–2025 (USD Million)
Table 132 Australia: Unmanned Composite Market Size, By Platform, 2017–2025 (USD Million)
Table 133 South Korea: Unmanned Composite Market Size, By Type, 2017–2025 (USD Million)
Table 134 South Korea: Unmanned Composite Market Size, By Application, 2017–2025 (USD Million)
Table 135 South Korea: Unmanned Composite Market Size, By Platform, 2017–2025 (USD Million)
Table 136 Rest of Asia Pacific: Unmanned Composite Market Size, By Type, 2017–2025 (USD Million)
Table 137 Rest of Asia Pacific: Unmanned Composite Market Size, By Application, 2017–2025 (USD Million)
Table 138 Rest of Asia Pacific: Unmanned Composite Market Size, By Platform, 2017–2025 (USD Million)
Table 139 Middle East: Unmanned Composite Market Size, By Type, 2017–2025 (USD Million)
Table 140 Middle East: Unmanned Composite Market Size, By Application, 2017–2025 (USD Million)
Table 141 Middle East: Unmanned Composite Market Size, By Country, 2017–2025 (USD Million)
Table 142 Middle East: Unmanned Composite Market Size, By Platform, 2017–2025 (USD Million)
Table 143 Israel: Unmanned Composite Market Size, By Type, 2017–2025 (USD Million)
Table 144 Israel: Unmanned Composite Market Size, By Application, 2017–2025 (USD Million)
Table 145 Israel: Unmanned Composite Market Size, By Platform, 2017–2025 (USD Million)
Table 146 Turkey: Unmanned Composite Market Size, By Type, 2017–2025 (USD Million)
Table 147 Turkey: Unmanned Composite Market Size, By Application, 2017–2025 (USD Million)
Table 148 Turkey: Unmanned Composite Market Size, By Platform, 2017–2025 (USD Million)
Table 149 UAE: Unmanned Composite Market Size, By Type, 2017–2025 (USD Million)
Table 150 UAE: Unmanned Composite Market Size, By Application, 2017–2025 (USD Million)
Table 151 UAE: Unmanned Composite Market Size, By Platform, 2017–2025 (USD Million)
Table 152 Rest of the World: Unmanned Composite Market Size, By Type, 2017–2025 (USD Million)
Table 153 Rest of the World: Unmanned Composite Market Size, By Application, 2017–2025 (USD Million)
Table 154 Rest of the World: Unmanned Composite Market Size, By Country, 2017–2025 (USD Million)
Table 155 Rest of the World: Unmanned Composite Market Size, By Platform, 2017–2025 (USD Million)
Table 156 New Product Launches and Developments, February 2015–March 2019
Table 157 Contracts, Partnerships, and Agreements, June 2016–April 2019
Table 158 Other Strategies, January 2015–March 2019
List of Figures (42 Figures)
Figure 1 Research Process Flow
Figure 2 Research Design
Figure 3 Market Size Estimation Methodology: Bottom-Up Approach
Figure 4 Market Size Estimation Methodology: Top-Down Approach
Figure 5 Data Triangulation
Figure 6 Based on Application, Exterior Segment Projected to Lead Unmanned Composite Market During the Forecast Period
Figure 7 Based on Type, Carbon Fiber Reinforced Polymer Segment Estimated to Account for Largest Market Share in 2019
Figure 8 Based on Platform, UAV Segment Estimated to Dominate Unmanned Composite Market in 2019
Figure 9 Need for Lightweight Unmanned Systems and Improved Performance of Unmanned Systems Through Composite Materials Fueling the Growth of Unmanned Composite Market Across the Globe
Figure 10 Unmanned Composite Market, By Type, 2019 & 2025
Figure 11 Unmanned Composite Market, By Platform
Figure 12 France Unmanned Composite Market Projected to Grow at the Highest CAGR From 2019 to 2025
Figure 13 Market Dynamics of the Unmanned Composite Market
Figure 14 Weight Saving Potential of Composite Materials in Comparison With Other Materials
Figure 15 AUV Segment to Record Highest CAGR During the Forecast Period
Figure 16 Exterior Application Segment Expected to Dominate the Unmanned Composite Market During the Forecast Period
Figure 17 Global Snapshot: France has the Highest Growth Potential During the Next Five Years
Figure 18 North America Unmanned Composite Market Snapshot
Figure 19 Europe Unmanned Composite Market Snapshot
Figure 20 Asia Pacific Unmanned Composite Market Snapshot
Figure 21 Middle East Unmanned Composite Market Snapshot
Figure 22 Companies Adopted Partnerships as a Key Growth Strategy Between January 2015 and March 2019
Figure 23 Unmanned Composite Market OEM Competitive Leadership Mapping, 2019
Figure 24 Unmanned Composite Market Start-Up Competitive Leadership Mapping, 2019
Figure 25 Hexcel Corporation: Company Snapshot
Figure 26 Hexcel Corporation: SWOT Analysis
Figure 27 Toray Industries, Inc.: Company Snapshot
Figure 28 Toray Industries, Inc.: SWOT Analysis
Figure 29 Stratasys Ltd.: Company Snapshot
Figure 30 Stratasys Ltd.: SWOT Analysis
Figure 31 Teledyne: Company Snapshot
Figure 32 Teledyne.: SWOT Analysis
Figure 33 Gurit: Company Snapshot
Figure 34 Gurit.: SWOT Analysis
Figure 35 Solvay: Company Snapshot
Figure 36 Solvay: SWOT Analysis
Figure 37 Owens Corning: Company Snapshot
Figure 38 Owens Corning: SWOT Analysis
Figure 39 Materion Corporation: Company Snapshot
Figure 40 Teijin Limited: Company Snapshot
Figure 41 Teijin Limited: SWOT Analysis
Figure 42 Carbon By Design: SWOT Analysis
The study involved four major activities to estimate the current market size for unmanned composites. Exhaustive secondary research was undertaken to collect information on the market, the peer markets, and the parent market. The next step was to validate these findings, assumptions, and sizing with industry experts across the value chain through primary research. Both, top-down and bottom-up approaches were employed to estimate the complete market size. Thereafter, market breakdown and data triangulation procedures were used to estimate the market size of segments and subsegments.
Secondary Research
In the secondary research process, various secondary sources, such as D&B Hoovers, Bloomberg, BusinessWeek, and different magazines were referred for identifying and collecting information for this study. Secondary sources also included annual reports, press releases & investor presentations of companies, certified publications, articles by recognized authors, and unmanned composites databases.
Primary Research
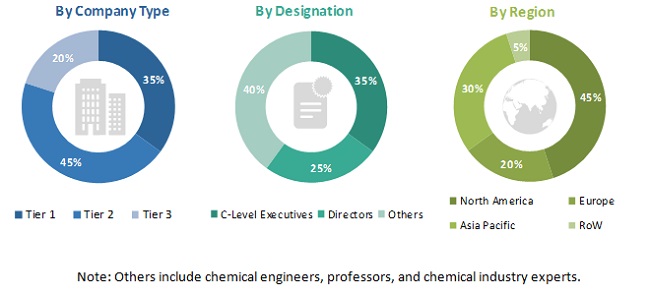
The unmanned composites market comprises several stakeholders, such as raw material suppliers, processors, end-product manufacturers, and regulatory organizations in the supply chain. The demand-side of this market is characterized by various end users, such as component manufacturers as well as facility providers and OEMs. The supply-side is characterized by technology advancements in unmanned composites and the development of unmanned composites. Various primary sources from both the supply and demand sides of the market were interviewed to obtain qualitative and quantitative information. Following is the breakdown of primary respondents:
To know about the assumptions considered for the study, download the pdf brochure
Market Size Estimation
Both, top-down and bottom-up approaches were used to estimate and validate the total size of the unmanned composites market. These methods were also used extensively to estimate the size of various subsegments of the market. The research methodology used to estimate the market size includes the following:
- Key players in the industry and markets were identified through extensive secondary research.
- The industry’s supply chain and market size, in terms of value, were determined through primary and secondary research processes.
- All percentage shares, splits, and breakdowns were determined using secondary sources and verified through primary sources.
Data Triangulation
After arriving at the overall market size—using the market size estimation process explained above—the market was split into several segments and subsegments. To complete the overall market engineering process and arrive at the exact statistics of each market segment and subsegment, data triangulation and market breakdown procedures were employed, wherever applicable. The data was triangulated by studying various factors and trends from both the demand and supply sides of the unmanned composites industry.
Report Objectives
- To identify and analyze key drivers, restraints, opportunities, and challenges influencing the growth of the unmanned composites market
- To analyze the impact of macro and micro indicators on the unmanned composites market
- To forecast the market size of segments for five regions, namely, North America, Europe, Asia Pacific, the Middle East, and Rest of the World, along with major countries in each of these regions
- To strategically analyze micromarkets with respect to individual technological trends, prospects, and their contribution to the overall market
- To strategically profile key market players and comprehensively analyze their market ranking and core competencies
- To provide a detailed competitive landscape of the unmanned composites market, along with an analysis of business and corporate strategies such as partnerships, acquisitions, and new product developments
- To identify detailed financial positions, key products, unique selling points, and key developments of leading companies in the unmanned composites market
Available Customizations
Along with the market data, MarketsandMarkets offers customizations according to a company’s specific needs.
Product Analysis
- Product matrix, which gives a detailed comparison of the product portfolio of each company
Company Information
- Detailed analysis and profiles of additional market players (up to 5)


Growth opportunities and latent adjacency in Unmanned Composites Market