Variable Air Volume Box Market by type(Single-Duct VAV, Dual-Duct VAV, Induction VAV, Fan-Powered VAV(Series Powered, Parallel Powered)), Application(Residential Building, Industrial Building, Commercial Building), and Region - Global Forecast to 2024


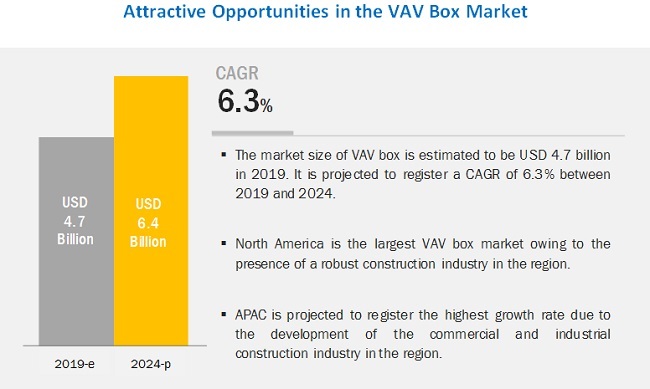
[132 Pages Report] The VAV BOX market size is estimated at USD 4.7 billion in 2019 and is projected to reach USD 6.4 billion by 2024, at a CAGR of 6.3%. The VAV BOX market is majorly driven by the growing construction activities, particularly commercial buildings in the emerging countries of APAC.
Single-Duct VAV is estimated to lead the overall VAV Box market during the forecast period.
Single-Duct VAV leads the overall VAV Box market. The cost effectiveness and the ability to control zone temperature by volumetric flow of air are the major factors driving the demand of Single-Duct VAV. Further, the increasing need for energy efficiency, is also increasing the use of Single-Duct VAV in smaller areas such as classrooms, retail stores, dormitories, and offices.
Commercial buildings is estimated to be the largest application of VAV BOX.
Commercial buildings is estimated to be the largest application of VAV Box. The usage of the VAV box with a VAV system ensure the energy efficiency of the overall system. This makes the use of VAV systems in commercial buildings highly popular. VAV systems are used in various sectors within commercial buildings, such as large office, shopping malls, hospitals, and hotels, among others including mega structures, conventions centers, shopping malls, and others.
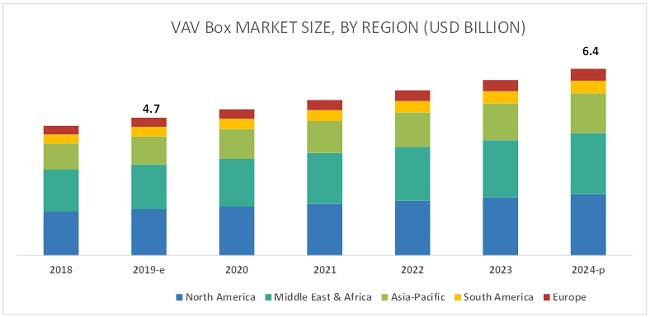
North America is projected to be the largest VAV BOX market.
North America is estimated to be the largest VAV BOX market during the forecast period. The US, Canada, and Mexico are the three main markets for VAV box in North America, with the US being the largest market in the region. The growing healthcare construction owing to the increasing aging population in North America is also expected to drive the overall construction industry. Further, the increasing spending on public and private infrastructure development will contribute to the growth of the VAV box market in the region.
Key Market Players
Ingersoll Rand PLC (Ireland), Johnson Controls (US), TROX GmbH (Germany), Spectrum Industries (India), United Technologies Corporation (US), Honeywell International Inc. (US), Daikin Industries, Ltd. (Japan), Siemens AG (Germany), Systemair AB (Sweden), Barcol-Air (Switzerland) are the key players operating in the VAV BOX market.
These companies have adopted several growth strategies to strengthen their position in the market. Expansion, new product development, and merger & acquisition are the key growth strategies adopted by these leading players to enhance their product offering and regional presence and meet the growing demand for VAV BOX from emerging economies.
Scope of the report
|
Report Metric |
Details |
|
Market size available for years |
2017�2024 |
|
Base year |
2018 |
|
Forecast period |
2019�2024 |
|
Units considered |
Value (USD), Volume (Thousand Units) |
|
Segments |
Type, Application and Region |
|
Regions |
APAC, Europe, North America, the Middle East & Africa, and South America |
|
Companies |
Ingersoll Rand PLC (Ireland), Johnson Controls (US), TROX GmbH (Germany), Spectrum Industries (India), United Technologies Corporation (US), Honeywell International Inc. (US), Daikin Industries, Ltd. (Japan), Siemens AG (Germany), Systemair AB (Sweden), Barcol-Air (Switzerland) |
This research report categorizes the VAV box market based on type, application and region.
The VAV BOX Market, By Type:
- Single-Duct VAV
- Dual-Duct VAV
- Induction VAV
- Fan-Powered VAV
- Series Fan-Powered VAV
- Parallel Fan-Powered VAV
The VAV BOX Market, By Application:
- Commercial Building
- Office
- Warehouse
- Hospitality
- Retail
- Others
- Industrial Building
- Residential Building
The VAV BOX Market, By Region:
- APAC
- Europe
- North America
- Middle East & Africa
- South America
Recent Developments
- In May 2019, The Company launched a new VAV terminal unit by the brand name TVE. The special attraction in this new terminal unit is the new damper blade which is designed to measure the volume flow. This new design allows a reduction in length and helps to ensure precise measurement results in the case of unfavorable upstream conditions.
- In March 2019, TROX GmbH signed a joint venture agreement with Egyptian air conditioning manufacturer and supplier Tiba El Manzalawi Group (Egypt). The new joint venture aims at serving the Egyptian market as well as the markets in the Middle East and in North and East Africa.
- In November 2018, TROX decided to convert its sales company TROX Mexico that was founded in 2010, into a production company. Starting in mid-2019, TROX Mexico will first produce grilles and other air terminal devices, followed by air handling units.
- In June 2017, Daikin Industries, Ltd. (Japan), through its subsidiary Daikin Australia Pty., Ltd., acquired Airmaster Corporation Pty Ltd. (Australia), a leading player of the air conditioning equipment market. With this acquisition, the company has solidified its HVAC product offering along with its position in the Australian market.
Critical questions the report answers:
- What are the upcoming hot bets for the VAV BOX market?
- What are the market dynamics for the different types of VAV BOX?
- What are the market dynamics for the different forms of VAV BOX?
- What are the market dynamics for different applications of VAV BOX?
- Who are the major manufacturers of VAV BOX?
- What are the major factors which will impact the market growth during the forecast period?
To speak to our analyst for a discussion on the above findings, click Speak to Analyst
 Exclusive indicates content/data unique to MarketsandMarkets and not available with any competitors.
Table of Contents
1 Introduction (Page No. - 14)
1.1 Objectives of the Study
1.2 Market Definition
1.3 Market Scope
1.3.1 VAV Box Market Segmentation
1.3.2 Regions Covered
1.3.3 Years Considered for the Study
1.4 Currency
1.5 Limitations
1.6 Unit Considered
1.7 Stakeholders
2 Research Methodology (Page No. - 18)
2.1 Research Data
2.1.1 Secondary Data
2.1.1.1 Key Data From Secondary Sources
2.1.2 Primary Data
2.1.2.1 Key Data From Primary Sources
2.1.2.2 Key Industry Insights
2.1.2.3 Breakdown of Primary Interviews
2.2 Market Size Estimation
2.3 Data Triangulation
2.3.1 Assumptions for the Study
3 Executive Summary (Page No. - 25)
4 Premium Insights (Page No. - 28)
4.1 Attractive Opportunities in the VAV Box Market
4.2 VAV Box Market, By Region
4.3 VAV Box Market, Developed vs Developing Economies
5 Market Overview (Page No. - 31)
5.1 Introduction
5.2 Market Dynamics
5.2.1 Drivers
5.2.1.1 Increasing Need for Energy Conservation
5.2.1.2 High Demand for HVAC Systems
5.2.1.3 Increase in Requirement for VAV Boxes Owing to Added Benefits
5.2.2 Restraints
5.2.2.1 Presence of Substitute Technologies
5.2.3 Opportunities
5.2.3.1 Increasing Global Construction Activities
5.2.4 Challenges
5.2.4.1 High Product Cost and Installation Charges
5.3 Supply Chain Analysis
5.4 Component Cost Breakup
5.4.1 Component Definition
5.5 Sales Channels
5.6 New Construction vs Retrofit
5.7 Porter�s Five Forces Analysis
5.7.1 Bargaining Power of Suppliers
5.7.2 Threat of New Entrants
5.7.3 Threat of Substitutes
5.7.4 Bargaining Power of Buyers
5.7.5 Intensity of Competitive Rivalry
5.8 Macroeconomic Indicators
5.9 Trends and Forecast of GDP at Country Level
5.10 Countries Engaging in More Than 60% Green Projects (2018 and 2021)
5.11 Sectors Having Planned Green Activity Over the Next Three Years
5.12 Construction Contribution to GDP
6 VAV Box Market, By Type (Page No. - 45)
6.1 Introduction
6.2 Single Duct VAV Box
6.2.1 Increasingly Compact Offices has Led to High Demand for Single Duct VAV Box
6.3 Fan-Powered VAV Box
6.3.1 Commercial and Industrial Buildings Toto Drive the Market for Fan-Powered VAV Box
6.3.2 Series Flow Terminals
6.3.3 Parallel Flow Terminals
6.4 Dual Duct VAV Box
6.4.1 Growth in Construction of Hospitals to Drive the Demand of Dual Duct VAV Box
6.5 Induction VAV Box
6.5.1 Demand of Induction VAV Box Driven By Its Ability to Induce Warm Air as Per Requirement
7 VAV Box Market, By Application (Page No. - 52)
7.1 Introduction
7.2 Commercial Building
7.2.1 Commercial Buildings Such as Offices, Hospitality, and Retails to Drive the Demand for VAV Box
7.2.2 Office
7.2.3 Warehouse
7.2.4 Hospitality
7.2.5 Retail
7.2.6 Others
7.3 Industrial Building
7.3.1 Increasing Industrial Construction in APAC to Drive the Demand of VAV Box
7.4 Residential Building
7.4.1 High Number of Residential Properties in MEA Drives the Use of VAV Box in Residential Buildings
8 VAV Box Market, By Region (Page No. - 59)
8.1 Introduction
8.2 North America
8.2.1 US
8.2.1.1 Strong Demand for Residential and Non-Residential Construction to Drive the VAV Box Market
8.2.2 Canada
8.2.2.1 Increasing Demand for Green Buildings to Drive the Country�s VAV Box Market
8.2.3 Mexico
8.2.3.1 Increasing Infrastructure Development to Drive the VAV Box Market
8.3 Middle East & Africa
8.3.1 UAE
8.3.1.1 Investment in New Construction Projects to Drive the Demand of VAV Box
8.3.2 Saudi Arabia
8.3.2.1 Growing Residential and Commercial Infrastructure Will Create A Huge Impact on the VAV Box Market
8.3.3 Nigeria
8.3.3.1 Government Efforts on Developing the Country�s Infrastructure Will Lead to the Demand for VAV Box
8.3.4 Rest of Middle East & Africa
8.4 APAC
8.4.1 China
8.4.1.1 Growing HVAC Market to Drive the Demand for VAV Box
8.4.2 Japan
8.4.2.1 Increasing Commercial, Industrial, and Hospitality Construction to Drive the VAV Box Market
8.4.3 India
8.4.3.1 The Rapidly Growing Construction Industry is Expected to Drive VAV Box Demand
8.4.4 South Korea
8.4.4.1 Commercial Building is Estimated to Dominate the VAV Box Market South Korea
8.4.5 Indonesia
8.4.5.1 Infrastructure Initiatives By Indonesian Government to Drive the VAV Box Demand in the Country
8.4.6 Rest of APAC
8.5 Europe
8.5.1 Germany
8.5.1.1 Growing Industrial Construction is Expected to Drive the VAV Box Market
8.5.2 UK
8.5.2.1 The Presence of Strong Commercial Real Estate Will Drive the VAV Box Market
8.5.3 France
8.5.3.1 Growing Construction and Hospitality Industry to Drive the VAV Box Market
8.5.4 Russia
8.5.4.1 Growth of Overall Construction Industry Will Drive the VAV Box Market in the Country
8.5.5 Turkey
8.5.5.1 Growth in the Construction of Office Buildings to Drive the VAV Box Market
8.5.6 Rest of Europe
8.6 South America
8.6.1 Brazil
8.6.1.1 Promotion of Energy Efficient Systems in the Country Will Lead to the Demand of VAV Box and Systems
8.6.2 Argentina
8.6.2.1 Increased Government Intervention and Aid of Imf to Promote the Construction Industry in the Country
8.6.3 Rest of South America
9 Competitive Landscape (Page No. - 98)
9.1 Introduction
9.2 Market Ranking of VAV Box Manufacturers
9.3 Competitive Situation & Trends
9.3.1 Expansion
9.3.2 New Product Development
9.3.3 Merger & Acquisition
9.3.4 Joint Venture
10 Company Profiles (Page No. - 101)
10.1 Ingersoll Rand PLC
10.1.1 Business Overview
10.1.2 Products Offered
10.1.3 SWOT Analysis
10.1.4 MnM View
10.2 Johnson Controls
10.2.1 Business Overview
10.2.2 Products Offered
10.2.3 Recent Developments
10.2.4 SWOT Analysis
10.2.5 MnM View
10.3 TROX GmbH
10.3.1 Business Overview
10.3.2 Products Offered
10.3.3 Recent Developments
10.3.4 SWOT Analysis
10.3.5 MnM View
10.4 Spectrum Industries
10.4.1 Business Overview
10.4.2 Products Offered
10.4.3 SWOT Analysis
10.4.4 MnM View
10.5 United Technologies Corporation
10.5.1 Business Overview
10.5.2 Products Offered
10.5.3 Recent Developments
10.5.4 SWOT Analysis
10.5.5 MnM View
10.6 Honeywell International Inc.
10.6.1 Business Overview
10.6.2 Products Offered
10.6.3 MnM View
10.7 Daikin Industries, Ltd.
10.7.1 Business Overview
10.7.2 Products Offered
10.7.3 Recent Developments
10.7.4 MnM View
10.8 Siemens AG
10.8.1 Business Overview
10.8.2 Products Offered
10.8.3 MnM View
10.9 Systemair AB
10.9.1 Business Overview
10.9.2 Products Offered
10.9.3 MnM View
10.10 Barcol-Air
10.10.1 Business Overview
10.10.2 Products Offered
10.10.3 MnM View
11 Additional Company Profiles (Page No. - 128)
11.1 Halton Group
11.2 Advanced Air (UK) Ltd
11.3 Waterloo Air Products PLC
11.4 Air Master Equipments Emirates LLC
11.5 KAD Airconditioning
11.6 EB Air Control Inc.
11.7 Dynacraft Air Controls
11.8 BES-Tech, Inc.
11.9 Metal Industries Inc.
11.10 Beyond & Brothers Development Co Ltd
11.11 KBE
11.12 Prolon
11.13 Betec Cad
11.14 JCC Cooling
12 Appendix (Page No. - 132)
12.1 Discussion Guide
List of Tables (77 Tables)
Table 1 Trends and Forecast of GDP at Country Level, USD Billion (2017-2024)
Table 2 Countries Engaging in More Than 60% Green Projects (2018 and 2021)
Table 3 Trends and Forecast of the Construction Industry, By Country, 2014�2021 (USD Billion)
Table 4 VAV Box Market Size, By Type , 2017�2024 (USD Million)
Table 5 Fan-Powered VAV Market Size, By Sub-Type , 2017�2024 (USD Million)
Table 6 Single Duct VAV Box Market Size, By Region, 2017�2024 (USD Million)
Table 7 Fan-Powered VAV Box Market Size, By Region, 2017�2024 (USD Million)
Table 8 Dual Duct VAV Box Market Size, By Region, 2017�2024 (USD Million)
Table 9 Induction VAV Box Market Size, By Region, 2017�2024 (USD Million)
Table 10 VAV Box Market Size, By Application , 2017�2024 (USD Million)
Table 11 VAV Box Market Size in Commercial Buiding, By Sub-Application , 2017�2024 (USD Million)
Table 12 VAV Box Market Size in Commercial Building, By Region, 2017�2024 (USD Million)
Table 13 VAV Box Market Size in Industrial Building, By Region, 2017�2024 (USD Million)
Table 14 VAV Box Market Size in Residential Building, By Region, 2017�2024 (USD Million)
Table 15 VAV Box Market Size, By Region, 2017�2024 (USD Million)
Table 16 VAV Box Market Size, By Region, 2017�2024 (Thousand Units)
Table 17 VAV Box Market Size, By Type, 2017�2014 (USD Million)
Table 18 Fan-Powered VAV Box Market Size, By Sub-Type, 2017�2024 (USD Million)
Table 19 VAV Box Market Size, By Application, 2017�2024 (USD Million)
Table 20 VAV Box Market Size in Commercial Building, By Sub-Application, 2017�2024 (USD Million)
Table 21 North America: VAV Box Market Size, By Region, 2017�2024 (USD Million)
Table 22 North America: VAV Box Market Size, By Region, 2017�2024 (Thousand Units)
Table 23 North America: VAV Box Market Size, By Type, 2017�2024 (USD Million)
Table 24 North America: Fan-Powered VAV Box Market Size, By Sub-Type, 2017�2024 (USD Million)
Table 25 North America: VAV Box Market Size, By Application, 2017�2024 (USD Million)
Table 26 North America: VAV Box Market Size in Commercial Building, By Sub-Application, 2017�2024 (USD Million)
Table 27 US: VAV Box Market Size, By Application, 2017�2024 (USD Million)
Table 28 Canada: VAV Box Market Size, By Application, 2017�2024 (USD Million)
Table 29 Mexico: VAV Box Market Size, By Application, 2017�2024 (USD Million)
Table 30 Middle East & Africa: VAV Box Market Size, By Country, 2017�2024 (USD Million)
Table 31 Middle East & Africa: VAV Box Market Size, By Country, 2017�2024 (Thousand Units)
Table 32 Middle East & Africa: VAV Box Market Size, By Type, 2017�2024 (USD Million)
Table 33 Middle East & Africa: Fan-Powered VAV Box Market Size, By Sub-Type, 2017�2024 (USD Million)
Table 34 Middle East & Africa: VAV Box Market Size, By Application, 2017�2024 (USD Million)
Table 35 Middle East & Africa: VAV Box Market Size Commercial Bulding, By Sub-Application, 2017�2024 (USD Million)
Table 36 UAE: VAV Box Market Size, By Application, 2017�2024 (USD Million)
Table 37 Saudi Arabia: VAV Box Market Size, By Application, 2017�2024 (USD Million)
Table 38 Nigeria: VAV Market Size, By Application, 2017�2024 (USD Million)
Table 39 Rest of Middle East & Africa: VAV Box Market Size, By Application, 2017�2024 (USD Million)
Table 40 APAC: VAV Box Market Size, By Country, 2017�2024 (USD Million)
Table 41 APAC: VAV Box Market Size, By Country, 2017�2024 (Thousand Units)
Table 42 APAC: VAV Box Market Size, By Type, 2017�2024 (USD Million)
Table 43 APAC: Fan-Powered VAV Box Market Size, By Sub-Type, 2017�2024 (USD Million)
Table 44 APAC: VAV Box Market Size, By Application, 2017�2024 (USD Million)
Table 45 APAC: VAV Box Market Size in Commercial Building, By Sub-Application, 2017�2024 (USD Million)
Table 46 China: VAV Box Market Size, By Application, 2017�2024 (USD Million)
Table 47 Japan: VAV Box Market Size, By Application, 2017�2024 (USD Million)
Table 48 India: VAV Box Market Size, By Application, 2017�2024 (USD Million)
Table 49 South Korea: VAV Box Market Size, By Application, 2017�2024 (USD Million)
Table 50 Indonesia: VAV Box Market Size, By Application, 2017�2024 (USD Million)
Table 51 Rest of APAC: VAV Box Market Size, By Application, 2017�2024 (USD Million)
Table 52 Europe: VAV Box Market Size, By Region, 2017�2024 (USD Million)
Table 53 Europe: VAV Box Market Size, By Region, 2017�2024 (Thousand Units)
Table 54 Europe: VAV Box Market Size, By Type, 2017�2024 (USD Million)
Table 55 Europe: Fan-Powered VAV Box Market Size, By Sub-Type, 2017�2024 (USD Million)
Table 56 Europe: VAV Box Market Size, By Application, 2017�2024 (USD Million)
Table 57 Europe: VAV Box Market Size in Commercial Building, By Sub-Application, 2017�2024 (USD Million)
Table 58 Germany: VAV Box Market Size, By Application, 2017�2024 (USD Million)
Table 59 UK: VAV Box Market Size, By Application, 2017�2024 (USD Million)
Table 60 France: VAV Box Market Size, By Application, 2017�2024 (USD Million)
Table 61 Russia: VAV Box Market Size, By Application, 2017�2024 (USD Million)
Table 62 Turkey: VAV Box Market Size, By Application, 2017�2024 (USD Million)
Table 63 Rest of Western Europe: VAV Box Market Size, By Application, 2017�2024 (USD Million)
Table 64 Rest of Central & Eastern Europe: VAV Box Market Size, By Application, 2017�2024 (USD Million)
Table 65 South America: VAV Box Market Size, By Country, 2017�2024 (USD Million)
Table 66 South America: VAV Box Market Size, By Country, 2017-2024 (Thousand Units)
Table 67 South America: VAV Box Market Size, By Type, 2017�2024 (USD Million)
Table 68 South America: Fan-Powered VAV Box Market Size, By Sub-Type, 2017-2024 (USD Million)
Table 69 South America: VAV Box Market Size, By Application, 2017�2024 (USD Million)
Table 70 South America: VAV Box Market Size in Commercial Building, By Sub-Application, 2017�2024 (USD Million)
Table 71 Brazil: VAV Box Market Size, By Application, 2017�2024 (USD Million)
Table 72 Argentina: VAV Box Market Size, By Application, 2017�2024 (USD Million)
Table 73 Rest of South America: VAV Box Market Size, By Application, 2017�2024 (USD Million)
Table 74 Expansion, 2014�2019
Table 75 New Product Development, 2014�2019
Table 76 Merger & Acquisition, 2014�2019
Table 77 Joint Venture, 2014�2019
List of Figures (47 Figures)
Figure 1 VAV Box Market: Research Design
Figure 2 Market Size Estimation: Top-Down Approach
Figure 3 Market Size Estimation: Bottom-Up Approach
Figure 4 VAV Box Market: Data Triangulation
Figure 5 Single-Duct VAV Was the Largest Segment in 2018
Figure 6 Commercial Building to Be the Fastest-Growing Application of VAV Box
Figure 7 APAC Was the Largest Market for VAV Box in 2018
Figure 8 Growing Commercial Building Activities to Drive the Market During the Forecast Period
Figure 9 APAC to Be the Fastest-Growing Market Between 2019 and 2024
Figure 10 VAV Box Market to Register High Growth in Developing Nations
Figure 11 Drivers, Restraints, Opportunities, and Challenges Governing the VAV Box Market
Figure 12 VAV Box Market: Supply Chain Analysis
Figure 13 VAV Box Market: Component Cost Breakup
Figure 14 Sales Channel Breakup
Figure 15 VAV System Market: New Construction vs Retrofit
Figure 16 VAV Box Market: Porter�s Five Forces Analysis
Figure 17 Single Duct to Be the Largest Segment in the Overall VAV Box Market
Figure 18 North America to Be the Largest Market for Single Duct VAV Box
Figure 19 North America to Be the Largest Market for Fan-Powered VAV Box
Figure 20 APAC Projected to Be the Fastest-Growing Market for Dual Duct VAV Box
Figure 21 North America is the Largest Market for Induction VAV Box
Figure 22 Commercial Buidings to Be Dominant User of VAV Box
Figure 23 North America to Be the Largest Market in the Commercial Building Segment
Figure 24 APAC to Witness Highest Growthin the Industrial Building Segment
Figure 25 Middle East & Africa to Be the Largest Market for VAV Box in Residential Building Segment
Figure 26 VAV Box Market Regional Snapshot
Figure 27 North America Market Snapshot: Mexico is the Fastest-Growing Market
Figure 28 Middle East & Africa Market Snapshot: UAE is the Largest and Fastest-Growing Market
Figure 29 APAC Snapshot: India is the Fastest-Growing Market
Figure 30 Europe Market Snapshot: France is the Fastest-Growing Market
Figure 31 South America Market Snapshot: Argentina is the Fastest-Growing Market
Figure 32 Market Ranking of Key Players in 2018
Figure 33 Ingersoll Rand PLC: Company Snapshot
Figure 34 Ingersoll Rand PLC: SWOT Analysis
Figure 35 Johnson Controls: Company Snapshot
Figure 36 Johnson Controls: SWOT Analysis
Figure 37 TROX GmbH: Company Snapshot
Figure 38 TROX GmbH: SWOT Analysis
Figure 39 Spectrum Industries: Company Snapshot
Figure 40 Spectrum Industries: SWOT Analysis
Figure 41 United Technologies Corporation: Company Snapshot
Figure 42 United Technologies Corporation: SWOT Analysis
Figure 43 Honeywell International Inc.: Company Snapshot
Figure 44 Daikin Industries, Ltd.: Company Snapshot
Figure 45 Siemens AG: Company Snapshot
Figure 46 Systemair AB: Company Snapshot
Figure 47 Barcol-Air: Company Snapshot
The study involved four major activities in estimating the current market size for VAV Box. Exhaustive secondary research was done to collect information on the market, peer market, and parent market. The next step was to validate these findings, assumptions, and sizing with industry experts across the value chain through primary research. Both top-down and bottom-up approaches were employed to estimate the complete market size. After that, the market breakdown and data triangulation were used to estimate the market size of segments and subsegments.
Secondary Research
In the secondary research process, various secondary sources, such as Hoovers and Bloomberg BusinessWeek, were referred to for identifying and collecting information for this study. These secondary sources included annual reports, press releases & investor presentations of companies, white papers, certified publications, articles by recognized authors, gold standard & silver standard websites, food safety organizations, regulatory bodies, and databases.
Primary Research
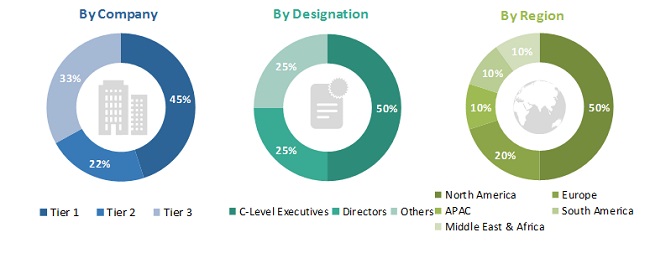
The VAV box market comprises of several stakeholders, such as raw material suppliers, end product manufacturers, and regulatory organizations in the supply chain. The demand side of this market is characterized by the developments in commercial buildings, residential buildings and industrial buildings. The supply side is characterized by market consolidation activities undertaken by raw material suppliers. Various primary sources from both, the supply and demand sides of the market were interviewed to obtain qualitative and quantitative information. Following is the breakdown of primary respondents�
To know about the assumptions considered for the study, download the pdf brochure
Market Size Estimation
Top-down and bottom-up approaches were used to estimate and validate the total size of the VAV box market. These methods were also used extensively to estimate the size of the various subsegments in the market. The research methodology used to estimate the market size includes the following:
- The key players in the industry and markets were identified through extensive secondary research.
- The industry�s supply chain and market size, in terms of value, were determined through primary and secondary research processes.
- All percentage shares, splits, and breakdowns were determined using secondary sources and verified through primary sources.
Data Triangulation
After arriving at the overall market size�using the market size estimation processes as explained above�the market was split into several segments and subsegments. In order to complete the overall market engineering process and arrive at the exact statistics of each market segment and subsegment, the data triangulation and market breakdown procedures were employed, wherever applicable. The data was triangulated by studying various factors and trends from both demand and supply sides.
Objectives of the Study:
- To define, describe, and forecast the global VAV box market size, in terms of value and volume
- To provide detailed information regarding the key drivers, restraints, challenges, and opportunities influencing the market growth
- To analyze and forecast the VAV box market on the basis of type and application
- To analyze and forecast the market size, on the basis of five key regions, namely, Asia Pacific (APAC), Europe, North America, the Middle East & Africa, and South America along with their key countries
- To analyze opportunities in the market for stakeholders and provide a competitive landscape for market leaders
- To analyze competitive developments, such as, expansions, mergers & acquisitions, and new product developments in the market
- To strategically identify and profile the key market players and analyze their core competencies in the market
Available Customizations:
- MarketsandMarkets offers customizations according to the specific requirements of companies with the given market data.
- The following customization options are available for the report:
Regional Analysis:
- Country-level analysis of the VAV BOX market
Company Information:
- Detailed analysis and profiling of additional market players


Growth opportunities and latent adjacency in Variable Air Volume Box Market