Global Water Treatment Chemicals Market in Soft Drinks By Type, Region and Process (2010 � 2015)


Please click here to get the updated version of Water Treatment Chemicals Market By Types, Applications and Trends (Forecast to 2016)
Water treatment chemicals are chemical compounds, used to remove impurities from water. The consumption of water treatment chemicals in soft drinks plant depends on the source of water that can be sea water, ground water, and municipal drinking water. The demand for water treatment chemicals is influenced by various factors such as water availability, quality of water and usage pattern, presence of pollutants, government policies, and trade-offs among the various chemical compounds. The increasing population and industrial activities are driving the demand for clean and fresh water. Current supply of water is unlikely to meet its rising demand in the global market.
Non-chemical treatment methods are also gradually being adopted across North America. These include methods such as ultrafiltration and ultraviolet disinfection that are the most sought-after ones for soft drinks processors since they remove impurities easily as compared to the chemical methods. These methods are likely to substitute water treatment chemicals to certain extent. Although there are many advanced technologies available for water treatment, water treatment chemicals still prove to be more cost-efficient. Moreover, the advanced technologies require huge investment as capital cost. There is a large difference between the operating costs required in advanced technologies and that required by chemicals. However, the chemicals have lower cost, and hence the value lost during chemical processing is less as compared to the cost incurred by advanced technologies.
The global soft drinks market is moderately fragmented, where leading suppliers Coca-Cola Company, PepsiCo, and Nestle S.A. constitute about 43% of the global soft drinks market. Improved living standards and rising household income are driving the growth of soft drinks market. The companies in soft drinks market need to compete with each other with respect to low prices and wide product range in order to meet the consumers� requirements. In this market, location is a critical factor for soft drink suppliers in order to survive the tough competition in this industry. The U.S. and Japan are the largest markets for soft drinks; followed by the emerging markets such as China and India. Soft drinks contain about 90% of water and various ions that alter the taste of the final soft drink product. Typically, soft drink plants use filtering and other water treatment equipment in order to remove residual impurities and to obtain standardized water quality. Antiscalants are mostly used in reverse osmosis (RO) process in soft drink plants.
Corrosion inhibitor is a chemical compound which, when added to any a liquid or gas, reduces the corrosion rate of material, typically a metal or an alloy. It is in the form of protective films, coatings, and other end product formulations. Corrosion inhibitors are the largest product group within water treatment chemicals by volumes and the fastest growing market segment as users turn increasingly to high-value, proprietary formulations.
The report analyzes global water treatment chemicals� consumption in soft drinks market, and covers major chemical types in terms of market volume with respect to processes and regions. The report also provides market overview for the global water treatment chemicals market and global soft drinks market.
By chemical types:
- Corrosion inhibitor
- Scale inhibitor
- Coagulant
- Flocculants
- Others
By process types:
- Cooling water treatment
- Waste water treatment
- Process water treatment
- Boiler water treatment
By Country:
- U.S.
- Mexico
- Germany
- UK
- Saudi Arabia
- South Africa
- China
- Japan
This report also includes leading manufacturers� profiles such as Akzonobel NV, Ashland Inc., Baker Hughes Inc., BASF SE, BK, Giulini GmbH, Buckman Laboratories international Inc., BWA Water Additives UK Ltd, Chemtreat Inc., Clariant, Cortec Corp, GE water and process technologies, Kemira Oyj, Kurita water industries Ltd, Nalco.
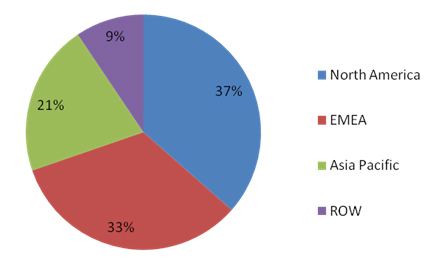
The global water treatment chemicals consumption in soft drinks industry is on the course of higher growth since the last four years. This growth is largely fueled by the increased demand for high quality water and boost in the intake of soft drinks across the globe. The global water treatment chemicals consumption in soft drinks market is estimated to reach 216 million Kg in 2015 from 181.9 million Kg in 2010, growing at a CAGR of 3.5% from 2010 to 2015. The market in Asia is driving the sales and is expected to hold 36% of the global market share in 2015; growing at a CAGR of 5.8% due to the high consumption of water treatment chemicals since the quality of water in the Asian region is low. Also, the volume of water treatment chemical in Asia is expected to boost its share from 37.9 million kg in 2010 to 50.2 million kg in 2015.
The most dominant process is cooling water treatment with 26.2% of market share in water treatment chemicals in soft drinks market; followed by waste water treatment. Corrosion and scale inhibitors are the largest chemical types used within water treatment chemical in soft drinks market with 43% share. Corrosion and scale inhibitors are expected to be worth 216 million Kg in 2015, growing at a CAGR of 3.5%. Consumption of water treatment chemicals depends on the quality of water, and quality depends on various defined parameters such as TDS (Total Dissolved Solids), hardness, pH, and alkalinity. Consumption of water treatment chemicals would vary for different locations depending on the quality of water.
Source: MarketsandMarkets
 Exclusive indicates content/data unique to MarketsandMarkets and not available with any competitors.
TABLE OF CONTENTS
1 Introduction
1.1 Key Take-Aways
1.2 Report Description
1.3 Markets Covered
1.4 Stakeholders
1.5 Research Methodology
1.5.1 Calculation of Ratios
1.5.2 Key Data Points Taken From Secondary Sources
1.5.3 Key Data Points Taken From Primary Sources
1.5.4 Assumptions Made for This Report
2 Executive Summary
3 Market Overview
3.1 Introduction
3.2 Water Treatment Chemicals Market Overview
3.3 Global Soft Drinks Market Overview
3.4 Water Treatment Chemicals in Soft Drinks Market Overview
4 WTC in Soft Drinks Market, by Chemical Types
4.1 Introduction
4.2 Types of WTC
4.2.1 Corrosion & scale inhibitors
4.2.2 Coagulants & flocculants
5 Water Treatment Chemicals in Soft Drinks Market, by Treatment Process
5.1 Introduction
5.2 Types of Water Treatment Processes
5.2.1 Cooling water treatment
5.2.2 Process water treatment
5.2.3 Boiler water treatment
5.2.4 Waste water treatment
6 WTC in Soft Drinks Market Ratios, by Types & by Treatment Process
6.1 Introduction
7 Company Profiles
7.1 AKZONOBEL NV
7.1.1 Overview
7.1.2 Financials
7.1.3 Products & services
7.1.4 Strategy
7.1.5 Developments
7.2 ASHLAND INC.
7.2.1 Overview
7.2.2 Financials
7.2.3 PRODUCTS & SERVICES
7.2.4 Strategy
7.2.5 Developments
7.3 BAKER HUGHES INC.
7.3.1 Overview
7.3.2 Financials
7.3.3 PRODUCTS & SERVICES
7.3.4 Strategy
7.3.5 Developments
7.4 BASF SE
7.4.1 Overview
7.4.2 Financials
7.4.3 PRODUCTS & SERVICES
7.4.4 Strategy
7.4.5 Developments
7.5 BK GIULINI GMBH
7.5.1 Overview
7.5.2 Financials
7.5.3 PRODUCTS & SERVICES
7.5.4 Strategy
7.5.5 Developments
7.6 BUCKMAN LABORATORIES INTERNATIONAL INC.
7.6.1 Overview
7.6.2 Financials
7.6.3 PRODUCTS & SERVICES
7.6.4 Strategy
7.7 BWA WATER ADDITIVES UK LTD.
7.7.1 Overview
7.7.2 Financials
7.7.3 PRODUCTS & SERVICES
7.7.4 Strategy
7.7.5 Developments
7.8 CHEMTREAT INC.
7.8.1 Overview
7.8.2 Financials
7.8.3 PRODUCTS & SERVICES
7.8.4 Strategy
7.8.5 Developments
7.9 CLARIANT
7.9.1 Overview
7.9.2 Financials
7.9.3 PRODUCTS & SERVICES
7.9.4 Strategy
7.9.5 Developments
7.10 CORTEC CORP
7.10.1 Overview
7.10.2 PRODUCTS & SERVICES
7.10.3 Strategy
7.10.4 Developments
7.11 GE WATER AND PROCESS TECHNOLOGIES
7.11.1 Overview
7.11.2 Financials
7.11.3 PRODUCTS & SERVICES
7.11.4 Strategy
7.11.5 Developments
7.12 KEMIRA OYJ
7.12.1 Overview
7.12.2 Financials
7.12.3 PRODUCTS & SERVICES
7.12.4 Strategy
7.12.5 Developments
7.13 KURITA WATER INDUSTRIES LTD.
7.13.1 Overview
7.13.2 Financials
7.13.3 PRODUCTS & SERVICES
7.13.4 Strategy
7.13.5 Developments
7.14 NALCO
7.14.1 Overview
7.14.2 Financials
7.14.3 PRODUCTS & SERVICES
7.14.4 Strategy
7.14.5 Developments
LIST OF TABLES
1 WTC Consumption in Soft Drinks Market, by Geography, 2008 - 2015 (Million Kg)
2 Minimum & Maximum Ratios of WTC, by Types, by Countries (Kg/Million Liter)
3 Minimum & Maximum Ratios of WTC, by Processes, by Countries (Kg/Million Liter)
4 Water Treatment Chemicals Market Revenue, by Geography, 2008 - 2015 ($Million)
5 Industrial Water Treatment Chemicals Market, by Geography, 2008 - 2015 ($Million)
6 Municipal Water Treatment Chemicals Market, by Geography, 2008 - 2015 ($Million)
7 Soft Drinks Market, by Geography, 2010 - 2015 ($Million)
8 Soft Drinks Market, by Geography, 2010 � 2015 (Million Liters)
9 Global WTC Consumption in Soft Drinks Market, by Chemical Types, 2008 - 2015 (Million Kg)
10 Water Quality Paramters
11 Corrosion & Scale Inhibitors Consumption in Soft Drinks, by Geography, 2008 - 2015 (Million Kg)
12 North America: Corrosion & Scale Inhibitors Consumption in Soft Drinks, by Countries, 2008 - 2015 (Million Kg)
13 Emea: Corrosion & Scale Inhibitors Consumption in Soft Drinks, by Countries, 2008 - 2015 (Million Kg)
14 Asia-Pacific: Corrosion & Scale Inhibitors Consumption in Soft Drinks, by Countries, 2008 - 2015 (Million Kg)
15 Coagulants & Flocculants Consumption in Soft Drinks, by Geography, 2008 - 2015 (Million Kg)
16 North America: Coagulants & Flocculants Consumption in Soft Drinks, by Countries, 2008 - 2015 (Million Kg)
17 Emea: Coagulants & Flocculants Consumption in Soft Drinks, by Countries, 2008 - 2015 (Million Kg)
18 Asia-Pacific: Coagulants & Flocculants Consumption in Soft Drinks, by Geography, 2008 - 2015 (Million Kg)
19 Global WTC Consumption in Soft Drinks, by Processess, 2008 - 2015 (Million Kg)
20 Cooling Water Treatment Chemicals Consumption in Soft Drinks, by Geography, 2008 - 2015 (Million Kg)
21 North America: Cooling Water Treatment Chemicals Consumption in Soft Drinks, by Countries, 2008 - 2015 (Million Kg)
22 Emea: Cooling Water Treatment Chemicals Consumption in Soft Drinks, by Countries, 2008 - 2015 (Million Kg)
23 Asia-Pacific: Cooling Water Treatment Chemicals Consumption in Soft Drinks, by Countries, 2008 - 2015 (Million Kg)
24 Process Water Treatment Chemicals Consumption in Soft Drinks, by Geography, 2008 - 2015 (Million Kg)
25 North America: Process Water Treatment Chemicals Consumption in Soft Drinks, by Countries, 2008 - 2015 (Million Kg)
26 Emea: Process Water Treatment Chemicals Consumption in Soft Drinks, by Countries, 2008 - 2015 (Million Kg)
27 Asia-Pacific: Process Water Treatment Chemicals Consumption in Soft Drinks, by Countries, 2008 - 2015 (Million Kg)
28 Boiler Water Treatment Chemicals Consumption in Soft Drinks, by Geography, 2008 - 2015 (Million Kg)
29 North America: Boiler Water Treatment Chemicals Consumption in Soft Drinks, by Countries, 2008 - 2015 (Million Kg)
30 Emea: Boiler Water Treatment Chemicals Consumption in Soft Drinks, by Countries, 2008 - 2015 (Million Kg)
31 Asia-Pacific: Boiler Water Treatment Chemicals Consumption in Soft Drinks, by Countries, 2008 - 2015 (Million Kg)
32 Global Waste Water Treatment Chemicals Consumption in Soft Drinks, 2008 - 2015 (Million Kg)
33 North America Waste Water Treatment Chemicals Consumption in Soft Drinks, 2008 - 2015 (Million Kg)
34 Emea: Waste Water Treatment Chemicals Consumtion in Soft Drinks, 2008 - 2015 (Million Kg)
35 Asia-Pacific: Waste Water Treatment Chemicals Consumption in Soft Drinks, 2008 - 2015 (Million Kg)
36 Range of WTC Consumption Ratios in Soft Drinks, by Types (Kg/Million Liters)
37 Range of WTC Consumption Ratios in Soft Drinks, by Process (Kg/Million Liter)
LIST OF FIGURES
1 Industrial Water Consumption, by Geography
2 Global Soft Drinks Market, by Segments ($Million)
3 Global WTC in Soft Drinks Market Landscape
4 Water Treatment Processes in Soft Drinks Plant
5 Growth of Global WTC Consumption in Soft Drinks, by Chemical Types by % (2008 Vs 2015)
6 Growth of Global WTC Consumption in Soft Drinks, by Geography by % (2008 Vs 2015) 7 Growth of Global WTC Consumption in Soft Drinks, by Process, by % (2008 Vs 2015)


Growth opportunities and latent adjacency in Global Water Treatment Chemicals Market