Water Treatment Systems Market (Point-Of-Entry) by technology (Water Softeners, Filtration Methods, Reverse Osmosis, Distillation Systems, Disinfection Methods and Others), by Application (Residential and Non-Residential) - Global Forecast to 2020


[188 Pages Report] The increasing demand for clean drinking water and increasing awareness about the importance of water treatment are some of the major factors driving the growth of the water treatment systems (Point-Of-Entry) industry. The water treatment systems market (Point-Of-Entry) was valued at USD 3.51 Billion in 2014, and is projected to grow at a CAGR of 8.52% from 2015 to 2020. The filtration methods segment is the fastest-growing, by technology, in the water treatment systems market (Point-Of-Entry). In the region segment, Asia-Pacific is projected to grow at the highest rate. In terms of application, the residential sector is the fastest-growing segment, followed by the non-residential sector.
This report provides an analysis of key companies and a competitive analysis of developments recorded in the industry in the last five years. Market drivers, restraints, opportunities, and challenges have also been discussed in detail. Leading players of the market, which include 3M Company (U.S.), Honeywell International Inc. (U.S.), Calgon Carbon Corporation (U.S.), Pentair plc. (U.K.), The Dow Chemical Company (U.S.), Best Water Technology AG (Austria), and Danaher Corporation (U.S.) have been profiled to provide an insight into the competitive scenario in the market.
Scope of the Report
This research categorizes the water treatment systems (PoE) market based on technology, application, and region.
On the basis of technology, the water treatment systems (PoE) market has been segmented as follows:
- Water softeners
- Reverse osmosis systems
- Distillation systems
- Disinfection methods
- Filtration methods
- Others (adsorption and electrolysis)
On the basis of application, the water treatment systems market (Point-Of-Entry) has been segmented as follows:
- Residential
- Non-residential
- Commercial
- Industrial
- Healthcare
- Educational Institutes
- Others (stadiums, railway stations, and airports)
On the basis of region, the water treatment systems market (Point-Of-Entry) has been segmented as follows:
- Asia-Pacific
- Europe
- North America
- Rest of the World (RoW)
Value Addition for the Buyer:
- This report provides five year market forecasts with important statistical and analytical information on the technology, and application.
- This report provides a list of regulations relevant to water treatment systems market (Point-Of-Entry) at the regional level.
- This report illustrates the industry structure, driving parameters, major players, market shares, industry dynamics, and international developments relevant to water treatment systems markets (Point-Of-Entry).
- This report provides detailing of each segment, on country level for a holistic view.
- This report provides a competitive landscape, which is a presentation of the companies� products and services.
The water treatment systems market (Point-Of-Entry) is projected to reach USD 5.69 Billion by 2020, with a projected CAGR of 8.52%, from 2015 to 2020. Growth in infrastructure, technological developments, and rapid urbanization has fueled the growth for water treatment systems (PoE). The residential sector is the largest application area for water treatment systems (PoE), especially in emerging markets such as China, Brazil, and India.
The water treatment systems (PoE) market depends on various players who provide technological solutions for installing and manufacturing innovative water treatment systems. The market is dominated by key players such as 3M Company (U.S.), Honeywell International Inc. (U.S.), General Electric (U.S.), Best Water Technology (BWT) AG (Austria), and Calgon Carbon Corporation (U.S.). The market in this report is segmented on the basis of technology, application, and region.
The filtration methods segment is projected to grow at the highest CAGR of 8.52% from 2015 to 2020. The key players of the water treatment systems (PoE) market implement different strategies such as expansions, agreements, contracts, joint ventures, and partnerships to gain a larger share in the market.
The water treatment systems market (Point-Of-Entry) is a highly fragmented one. Major companies rely on regional and local distributors to increase their share as well as geographical presence in the market. One of the major developments observed in the water treatment systems (PoE) market is new product developments. Companies are adopting inorganic growth strategies such as acquisitions to cope with the increasing demand for water treatment systems in emerging markets. These strategies have aided companies to create a large customer and partner base in these markets.
 Exclusive indicates content/data unique to MarketsandMarkets and not available with any competitors.
Table of Contents
1 Introduction (Page No. - 18)
1.1 Objectives of the Study
1.2 Market Definition
1.3 Study Scope
1.3.1 Years Considered
1.4 Currency Considered
1.5 Unit Considered for the Water Treatment Systems Market (Point-Of-Entry)
1.6 Stakeholders
1.7 Limitations
2 Research Methodology (Page No. - 22)
2.1 Research Data
2.1.1 Secondary Data
2.1.1.1 Key Data From Secondary Sources
2.1.2 Primary Data
2.1.2.1 Key Data From Primary Sources
2.1.2.1.1 Breakdown of Primaries, By Company Type, Designation, & Region
2.2 Market Size Estimation
2.3 Market Breakdown & Data Triangulation
2.4 Market Share Estimation
2.5 Research Assumptions
2.5.1 Assumptions Made for This Study
3 Executive Summary (Page No. - 30)
3.1 Increasing Water Contamination Driving the Water Treatment Systems Market (Point-Of-Entry)
3.2 Factors Driving the Water Treatment Systems Market (Point-Of-Entry)
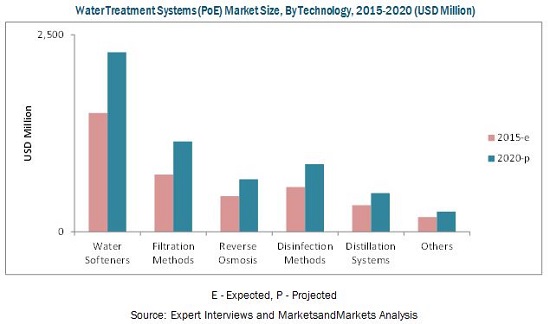
3.3 Reverse Osmosis Technology is Projected to Account for the Largest Share By 2020
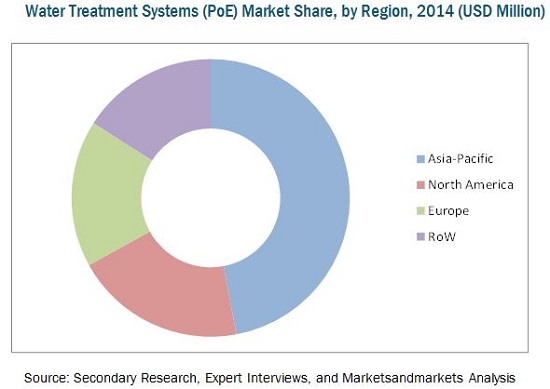
3.4 Asia-Pacific is Projected to Dominate the Global Water Treatment Systems Market (Point-Of-Entry) By 2020
3.5 India is Projected to Have the Highest Cagr From 2015 to 2020
3.6 Leading Market Players Adopted Partnerships, Agreements, and Joint Ventures as Key Strategies From 2011 to 2015
4 Premium Insights (Page No. - 34)
4.1 Attractive Market Opportunities in the Water Treatment Systems Market (Point-Of-Entry)
4.2 Water Treatment Systems Market (Point-Of-Entry) in the Asia-Pacific Region
4.3 India is Projected to Have the Highest Cagr Between 2015 and 2020
4.4 Water Treatment Systems Market (Point-Of-Entry), By Region (2014)
4.5 Merging Vs Developing Countries (2015 Vs 2020)
4.6 Water Treatment Systems Market (Point-Of-Entry), By Application (2014)
4.7 Water Treatment Systems Market (Point-Of-Entry) Life Cycle Analysis, By Region (2014)
5 Market Overview (Page No. - 40)
5.1 Introduction
5.2 Evolution
5.3 Market Segmentation
5.4 Market Dynamics
5.4.1 Drivers
5.4.1.1 Increasing Water Contamination
5.4.1.2 Increasing Industrialization
5.4.1.3 Increasing Residential & Non-Residential Construction Activities
5.4.1.4 Technological Innovations
5.4.2 Restraints
5.4.2.1 High Installation, Equipment, and Operation Cost
5.4.3 Opportunities
5.4.3.1 Scarcity of Clean Water in Developing and Under-Developed Countries
5.4.3.2 Depleting Freshwater Resources
5.4.4 Challenges
5.4.4.1 Aging Infrastructure
6 Industry Trends (Page No. - 48)
6.1 Introduction
6.2 Value Chain Analysis
6.3 Porter�s Five Forces Analysis
6.3.1 Threat of New Entrants
6.3.2 Threats of Substitutes
6.3.3 Bargaining Power of Suppliers
6.3.4 Bargaining Power of Buyers
6.3.5 Intensity of Competitive Rivalry
7 Water Treatment Systems Market (Point-Of-Entry), By Technology (Page No. - 53)
7.1 Introduction
7.2 Water Softeners
7.3 Filtration Method
7.3.1 Activated Carbon Filters
7.3.2 Mechanical Filter
7.4 Disinfection Methods
7.4.1 Chlorination
7.4.2 Uv Radiation
7.4.3 Ozonation
7.5 Reverse Osmosis Systems
7.6 Distillation Systems
7.7 Other Technologies
8 Water Treatment Systems Market (Point-Of-Entry), By Application (Page No. - 66)
8.1 Introduction
8.2 Residential
8.2.1 Single Family Units
8.2.2 Multi Family Homes
8.3 Non-Residential
9 Water Treatment Systems Market (Point-Of-Entry), By Region (Page No. - 80)
9.1 Introduction
9.2 Regulations
9.3 Asia-Pacific
9.3.1 China
9.3.1.1 China Quality Certification (CQC) is the Certified Body for Implementing Standards in the Chinese Market
9.3.2 India
9.3.3 Australia
9.3.3.1 Australian Certification Services Pty Ltd. Looks After AS/NZS Standards in the Australian Market
9.3.4 Japan
9.3.4.1 Japan Water Works Association (JWWA) is the Regulatory Body Responsible for Testing Water Purifiers in Japan
9.3.5 Korea
9.3.5.1 Korea Environment & Water Works Institute (KEWWI) is the Regulatory Body Responsible for Testing Water Purifiers in the Country
9.3.6 Rest of Asia-Pacific
9.4 North America
9.4.1 U.S.
9.4.1.1 Intertek Testing Services and Underwriters Laboratories (UL) are Certified Systems Testing Laboratories in the U.S.
9.4.2 Canada
9.4.2.1 NSF International Regulates the Canadian Water Treatment Systems Market (Point-Of-Entry)
9.4.3 Mexico
9.4.3.1 Intertek PLC and Underwriters Laboratories (UL) are the Certified Laboratories for Testing of Water Equipment in Mexico
9.5 Europe
9.5.1 Germany
9.5.1.1 Wasserfaches Cert - Dvgw Cert GmbH is the Certified Regulatory Body in Germany
9.5.2 France
9.5.2.1 Crecep, Institut Pasteur, Irh Environment & Carso-Lsehl are the Certified Laboratories That Issue Acs Certification in France
9.5.3 Italy
9.5.3.1 Cermet Soc. Cons. A R.L. (Certification and Quality Service) and DVN Italia (Det Norske Veritas Italia) are the Water Treatment Equipment Testing Bodies in Italy
9.5.4 U.K.
9.5.4.1 Water Regulations Advisory Scheme (WRAS) is the Approved Certified Body for Water Treatment Equipment in the U.K.
9.5.5 Spain
9.5.5.1 Ministry of Health and Food is the Approved Certified Body for Implementing Standards in Spain
9.5.6 Rest of Europe
9.6 RoW
9.6.1 Brazil
9.6.1.1 Associa��o NCC Certifica��es Do Brasil (NCC) Regulates the Water Quality/Devices Standards in Brazil
9.6.2 South Africa
9.6.2.1 in South Africa, Reference is Made to NSF/ANSI Standards 42, 53 & 55 for Design and Construction of Water Treatment Equipment
9.6.3 Saudi Arabia
9.6.3.1 Intertek PLC Regulates the Water Treatment Systems (Point-Of-Entry) in Saudi Arabia
9.6.4 Other Countries in RoW
10 Competitive Landscape (Page No. - 145)
10.1 Overview
10.2 Competitive Situations & Trends
10.3 Development Analysis, By Key Players
10.4 Key Growth Strategies, 2011�2015
10.4.1 Agreements,Partnerships, Contracts & Joint Ventures
10.4.2 New Product Launches
10.4.3 Expansions
10.4.4 Mergers & Acquisitions
11 Company Profiles (Page No. - 152)
(Company at A Glance, Business Overview, Products Offered, Key Strategy, Recent Developments, SWOT Analysis & MnM View)*
11.1 Introduction
11.2 The DOW Chemical Company
11.3 Honeywell International Inc.
11.4 3M Company
11.5 Danaher Corporation
11.6 Pentair PLC
11.7 Best Water Technology (BWT) AG
11.8 Calgon Carbon Corporation
11.9 Culligan International
11.10 General Electric
11.11 Watts Water Technologies Inc.
*Details on Company at A Glance, Recent Financials, Products Offered, Strategies & Insights, & Recent Developments Might Not Be Captured in Case of Unlisted Companies.
12 Appendix (Page No. - 177)
12.1 Insights of Industry Experts
12.2 Discussion Guide
12.3 Company Developments
12.3.1 Agreements, Partnerships, Contracts & Joint Ventures
12.3.2 New Product Launches
12.3.3 Expansions
12.3.4 Mergers & Acquisitions
12.4 Introducing RT: Real-Time Market Intelligence
12.5 Available Customizations
List of Tables (166 Tables)
Table 1 Industry Value Addition, By Country, 2010-2013 (GDP%)
Table 2 Existing ANSI/NSF Standards for Poe Technologies
Table 3 Water Treatment Systems Market (Point-Of-Entry) Size, By Technology, 2013�2020 (USD Million)
Table 4 Water Treatment Systems Market (Point-Of-Entry) Size, By Technology, 2013�2020 (Units)
Table 5 Water Softeners Market Size, By Application, 2013�2020 (USD Million)
Table 6 Water Softeners Market Size, By Application, 2013�2020 (Units)
Table 7 Filtration Methods Market Size, By Type, 2013�2020 (USD Million)
Table 8 Filtration Methods Market Size, By Type, 2013�2020 (Units)
Table 9 Filtration Methods Market Size, By Application, 2013�2020 (USD Million)
Table 10 Filtration Methods Market Size, By Application, 2013�2020 (Units)
Table 11 Disinfection Methods Market Size, By Type, 2013�2020 (USD Million)
Table 12 Disinfection Methods Market Size, By Type, 2013�2020 (Units)
Table 13 Disinfection Methods Market Size, By Application, 2013�2020 (USD Million)
Table 14 Disinfection Methods Market Size, By Application, 2013�2020 (Units)
Table 15 Reverse Osmosis Systems Market Size, By Application, 2013�2020 (USD Million)
Table 16 Reverse Osmosis Systems Market Size, By Application, 2013�2020 (Units)
Table 17 Distillation Systems Market Size, By Application, 2013�2020 (USD Million)
Table 18 Distillation Systems Market Size, By Application, 2013�2020 (Units)
Table 19 Other Technologies Market Size, By Application, 2013�2020 (USD Million)
Table 20 Other Technologies Market Size, By Application, 2013�2020 (Units)
Table 21 Water Treatment Systems Market (Point-Of-Entry) Size, By Application, 2013�2020 (USD Million)
Table 22 Water Treatment Systems Market (Point-Of-Entry) Size, By Application, 2013�2020 (Units)
Table 23 Flow Rate Sizing
Table 24 Contaminants and Point-Of-Entry Water Treatment Technologies Used
Table 25 Residential Water Treatment Systems Market (Point-Of-Entry) Size, By Type, 2013�2020 (USD Million)
Table 26 Residential Water Treatment Systems Market (Point-Of-Entry) Size, By Type, 2013�2020 (Units)
Table 27 North America: Residential Water Treatment Systems Market (Point-Of-Entry) Size, By Type, 2013�2020 (USD Million)
Table 28 North America: Residential Water Treatment Systems Market (Point-Of-Entry) Size, By Type, 2013�2020 (Units)
Table 29 Europe: Residential Water Treatment Systems Market (Point-Of-Entry) Size, By Type, 2013�2020 (USD Million)
Table 30 Europe: Residential Water Treatment Systems Market (Point-Of-Entry) Size, By Type, 2013�2020 (Units)
Table 31 Asia-Pacific: Residential Water Treatment Systems Market (Point-Of-Entry) Size, By Type, 2013�2020 (USD Million)
Table 32 Asia-Pacific: Residential Water Treatment Systems Market (Point-Of-Entry) Size, By Type, 2013�2020 (Units)
Table 33 RoW: Residential Water Treatment Systems Market (Point-Of-Entry) Size, By Type, 2013�2020 (USD Million)
Table 34 RoW: Residential Water Treatment Systems Market (Point-Of-Entry) Size, By Type, 2013�2020 (Units)
Table 35 Non-Residential Point-Of-Entry Water Treatment Market Size, By Type, 2013�2020 (USD Million)
Table 36 Non-Residential Point-Of-Entry Water Treatment Market Size, By Type, 2013�2020 (Units)
Table 37 North America: Non-Residential Water Treatment Systems Market (Point-Of-Entry) Size, By Type, 2013�2020 (USD Million)
Table 38 North America: Non-Residential Water Treatment Systems Market (Point-Of-Entry) Size, By Type, 2013�2020 (Units)
Table 39 Europe: Non-Residential Water Treatment Systems Market (Point-Of-Entry) Size, By Type, 2013�2020 (USD Million)
Table 40 Europe: Non-Residential Water Treatment Systems Market (Point-Of-Entry)(Point-Of-Entry) Size, By Type, 2013�2020 (Units)
Table 41 Asia-Pacific: Non-Residential Water Treatment Systems Market (Point-Of-Entry) Size, By Type, 2013�2020 (USD Million)
Table 42 Asia-Pacific: Non-Residential Water Treatment Systems Market (Point-Of-Entry) Size, By Type, 2013�2020 (Units)
Table 43 RoW: Non-Residential Water Treatment Systems Market (Point-Of-Entry) Size, By Type, 2013�2020 (USD Million)
Table 44 RoW: Non-Residential Water Treatment Systems Market (Point-Of-Entry) Size, By Type, 2013�2020 (Units)
Table 45 Regulations in the Water Treatment Systems Market (Point-Of-Entry), By Region
Table 46 Point-Of-Entry Water Treatment Systems Market Size, By Region, 2013�2020 (USD Million)
Table 47 Water Treatment Systems Market (Point-Of-Entry) Size, By Region, 2013�2020 (Units)
Table 48 Asia-Pacific: Water Treatment Systems Market (Point-Of-Entry) Size, By Country, 2013�2020 (USD Million)
Table 49 Asia-Pacific: Water Treatment Systems Market (Point-Of-Entry) Size, By Country, 2013�2020 (Units)
Table 50 Asia-Pacific: Water Treatment Systems Market (Point-Of-Entry) Size, By Technology, 2013�2020 (USD Million)
Table 51 Asia-Pacific: Water Treatment Systems Market (Point-Of-Entry) Size, By Technology, 2013�2020 (Units)
Table 52 Asia-Pacific: Water Treatment Systems Market (Point-Of-Entry) Size, By Application, 2013�2020 (USD Million)
Table 53 Asia-Pacific: Water Treatment Systems Market (Point-Of-Entry) Size, By Application, 2013�2020 (Units)
Table 54 Standards/Regulations in the Chinese Water Treatment Systems Market (Point-Of-Entry)
Table 55 China: Water Treatment Systems Market (Point-Of-Entry) Size, By Technology, 2013�2020 (USD Million)
Table 56 China: Water Treatment Systems Market (Point-Of-Entry) Size, By Technology, 2013�2020 (Units)
Table 57 China: Water Treatment Systems Market (Point-Of-Entry) Size, By Application, 2013�2020 (USD Million)
Table 58 China: Water Treatment Systems Market (Point-Of-Entry) Size, By Application, 2013�2020 (Units)
Table 59 India: Water Treatment Systems Market (Point-Of-Entry) Size, By Technology, 2013�2020 (USD Million)
Table 60 India: Water Treatment Systems Market (Point-Of-Entry) Size, By Technology, 2013�2020 (Units)
Table 61 India: Water Treatment Systems Market (Point-Of-Entry) Size, By Application, 2013�2020 (USD Million)
Table 62 India: Water Treatment Systems Market (Point-Of-Entry) Size, By Application, 2013�2020 (Units)
Table 63 Standards/Regulations in the Australian Water Treatment Systems Market (Point-Of-Entry)
Table 64 Australia: Water Treatment Systems Market (Point-Of-Entry) Size, By Technology, 2013�2020 (USD Million)
Table 65 Australia: Water Treatment Systems Market (Point-Of-Entry) Size, By Technology, 2013�2020 (Units)
Table 66 Australia: Water Treatment Systems Market (Point-Of-Entry) Size, By Application, 2013�2020 (USD Million)
Table 67 Australia: Water Treatment Systems Market (Point-Of-Entry) Size, By Application, 2013�2020 (Units)
Table 68 Standards/Regulations in the Japanese Water Treatment Systems Market (Point-Of-Entry)
Table 69 Japan: Water Treatment Systems Market (Point-Of-Entry) Size, By Technology, 2013�2020 (USD Million)
Table 70 Japan: Water Treatment Systems Market (Point-Of-Entry) Size, By Technology, 2013�2020 (Units)
Table 71 Japan: Water Treatment Systems Market (Point-Of-Entry) Size, By Application, 2013�2020 (USD Million)
Table 72 Japan: Water Treatment Systems Market (Point-Of-Entry) Size, By Application, 2013�2020 (Units)
Table 73 Standards/Regulations in the South Korean Water Treatment Systems Market (Point-Of-Entry)
Table 74 Korea: Water Treatment Systems Market (Point-Of-Entry) Size, By Technology, 2013�2020 (USD Million)
Table 75 Korea: Water Treatment Systems Market (Point-Of-Entry) Size, By Technology, 2013�2020 (Units)
Table 76 Korea: Water Treatment Systems Market (Point-Of-Entry) Size, By Application, 2013�2020 (USD Million)
Table 77 Korea: Water Treatment Systems Market (Point-Of-Entry) Size, By Application, 2013�2020 (Units)
Table 78 Rest of Asia-Pacific: Water Treatment Systems Market (Point-Of-Entry) Size, By Technology, 2013�2020 (USD Million)
Table 79 Rest of Asia-Pacific: Water Treatment Systems Market (Point-Of-Entry) Size, By Technology, 2013�2020 (Units)
Table 80 Rest of Asia-Pacific: Water Treatment Systems Market (Point-Of-Entry) Size, By Application, 2013�2020 (USD Million)
Table 81 Rest of Asia-Pacific: Water Treatment Systems Market (Point-Of-Entry) Size, By Application, 2013�2020 (Units)
Table 82 North America: Water Treatment Systems Market (Point-Of-Entry) Size, By Country, 2013�2020 (USD Million)
Table 83 North America: Water Treatment Systems Market (Point-Of-Entry) Size, By Country, 2013�2020 (Units)
Table 84 North America: Water Treatment Systems Market (Point-Of-Entry) Size, By Technology, 2013�2020 (USD Million)
Table 85 North America: Water Treatment Systems Market (Point-Of-Entry) Size, By Technology, 2013�2020 (Units)
Table 86 North America: Water Treatment Systems Market (Point-Of-Entry) Size, By Application, 2013�2020 (USD Million)
Table 87 North America: Water Treatment Systems Market (Point-Of-Entry) Size, By Application, 2013�2020 (Units)
Table 88 Standards/Regulations in the U.S. Water Treatment Systems Market (Point-Of-Entry)
Table 89 U.S.: Water Treatment Systems Market (Point-Of-Entry) Size, By Technology, 2013�2020 (USD Million)
Table 90 U.S.: Water Treatment Systems Market (Point-Of-Entry) Size, By Technology, 2013�2020 (Units)
Table 91 U.S.: Water Treatment Systems Market (Point-Of-Entry) Size, By Application, 2013�2020 (USD Million)
Table 92 U.S.: Water Treatment Systems Market (Point-Of-Entry) Size, By Application, 2013�2020 (Units)
Table 93 Standards/Regulations in the Canadian Water Treatment Systems Market (Point-Of-Entry)
Table 94 Canada: Water Treatment Systems Market (Point-Of-Entry) Size, By Technology, 2013�2020 (USD Million)
Table 95 Canada: Water Treatment Systems Market (Point-Of-Entry) Size, By Technology, 2013�2020 (Units)
Table 96 Canada: Water Treatment Systems Market (Point-Of-Entry) Size, By Application, 2013�2020 (USD Million)
Table 97 Canada: Water Treatment Systems Market (Point-Of-Entry) Size, By Application, 2013�2020 (Units)
Table 98 Standards/Regulations in the Mexican Water Treatment Systems Market (Point-Of-Entry)
Table 99 Mexico: Water Treatment Systems Market (Point-Of-Entry) Size, By Technology, 2013�2020 (USD Million)
Table 100 Mexico: Water Treatment Systems Market (Point-Of-Entry) Size, By Technology, 2013�2020 (Units)
Table 101 Mexico: Water Treatment Systems Market (Point-Of-Entry) Size, By Application, 2013�2020 (USD Million)
Table 102 Mexico: Water Treatment Systems Market (Point-Of-Entry) Size, By Application, 2013�2020 (Units)
Table 103 Europe: Water Treatment Systems Market (Point-Of-Entry) Size, By Country, 2013�2020 (USD Million)
Table 104 Europe: Water Treatment Systems Market (Point-Of-Entry) Size, By Country, 2013�2020 (Units)
Table 105 Europe: Water Treatment Systems Market (Point-Of-Entry) Size, By Technology, 2013�2020 (USD Million)
Table 106 Europe: Water Treatment Systems Market (Point-Of-Entry) Size, By Technology, 2013�2020 (Units)
Table 107 Europe: Water Treatment Systems Market (Point-Of-Entry) Size, By Application, 2013�2020 (USD Million)
Table 108 Europe: Water Treatment Systems Market (Point-Of-Entry) Size, By Application, 2013�2020 (Units)
Table 109 Standards/Regulations in the German Water Treatment Systems Market (Point-Of-Entry)
Table 110 Germany: Water Treatment Systems Market (Point-Of-Entry) Size, By Technology, 2013�2020 (USD Million)
Table 111 Germany: Water Treatment Systems Market (Point-Of-Entry) Size, By Technology, 2013�2020 (Units)
Table 112 Germany: Water Treatment Systems Market (Point-Of-Entry) Size, By Application, 2013�2020 (USD Million)
Table 113 Germany: Water Treatment Systems Market (Point-Of-Entry) Size, By Application, 2013�2020 (Units)
Table 114 Standards/Regulations in the French Water Treatment Systems Market (Point-Of-Entry)
Table 115 France: Water Treatment Systems Market (Point-Of-Entry) Size, By Technology, 2013�2020 (USD Million)
Table 116 France: Water Treatment Systems Market (Point-Of-Entry) Size, By Technology, 2013�2020 (Units)
Table 117 France: Water Treatment Systems Market (Point-Of-Entry) Size, By Application, 2013�2020 (USD Million)
Table 118 France: Water Treatment Systems Market (Point-Of-Entry) Size, By Application, 2013�2020 (Units)
Table 119 Standards/Regulations in the Italian Water Treatment Systems Market (Point-Of-Entry)
Table 120 Italy: Water Treatment Systems Market (Point-Of-Entry) Size, By Technology, 2013�2020 (USD Million)
Table 121 Italy: Water Treatment Systems Market (Point-Of-Entry) Size, By Technology, 2013�2020 (Units)
Table 122 Italy: Water Treatment Systems Market (Point-Of-Entry) Size, By Application, 2013�2020 (USD Million)
Table 123 Italy: Water Treatment Systems Market (Point-Of-Entry) Size, By Application, 2013�2020 (Units)
Table 124 Standards/Regulations in the U.K. Water Treatment Systems Market (Point-Of-Entry)
Table 125 U.K.: Water Treatment Systems Market (Point-Of-Entry)Size, By Technology, 2013�2020 (USD Million)
Table 126 U.K.: Water Treatment Systems Market (Point-Of-Entry) Size, By Technology, 2013�2020 (Units)
Table 127 U.K.: Water Treatment Systems Market (Point-Of-Entry) Size, By Application, 2013�2020 (USD Million)
Table 128 U.K.: Water Treatment Systems Market (Point-Of-Entry) Size, By Application, 2013�2020 (Units)
Table 129 Standards/Regulations in the Spanish Water Treatment Systems Market (Point-Of-Entry)
Table 130 Spain: Water Treatment Systems Market (Point-Of-Entry) Size, By Technology, 2013�2020 (USD Million)
Table 131 Spain: Water Treatment Systems Market (Point-Of-Entry) Size, By Technology, 2013�2020 (Units)
Table 132 Spain: Water Treatment Systems Market (Point-Of-Entry) Size, By Application, 2013�2020 (USD Million)
Table 133 Spain: Water Treatment Systems Market (Point-Of-Entry) Size, By Application, 2013�2020 (Units)
Table 134 Rest of Europe: Water Treatment Systems Market (Point-Of-Entry) Size, By Technology, 2013�2020 (USD Million)
Table 135 Rest of Europe: Water Treatment Systems Market (Point-Of-Entry) Size, By Technology, 2013�2020 (Units)
Table 136 Rest of Europe: Water Treatment Systems Market (Point-Of-Entry) Size, By Application, 2013�2020 (USD Million)
Table 137 Rest of Europe: Water Treatment Systems Market (Point-Of-Entry) Size, By Application, 2013�2020 (Units)
Table 138 RoW: Water Treatment Systems Market (Point-Of-Entry) Size, By Country, 2013�2020 (USD Million)
Table 139 RoW: Water Treatment Systems Market (Point-Of-Entry) Size, By Country, 2013�2020 (Units)
Table 140 RoW: Water Treatment Systems Market (Point-Of-Entry) Size, By Technology, 2013�2020 (USD Million)
Table 141 RoW: Water Treatment Systems Market (Point-Of-Entry) Size, By Technology, 2013�2020 (Units)
Table 142 RoW: Water Treatment Systems Market (Point-Of-Entry) Size, By Application, 2013�2020 (USD Million)
Table 143 RoW: Water Treatment Systems Market (Point-Of-Entry) Size, By Application, 2013�2020 (Units)
Table 144 Standards/Regulations in the Brazilian Water Treatment Systems Market
Table 145 Brazil: Water Treatment Systems Market (Point-Of-Entry) Size, By Technology, 2013�2020 (USD Million)
Table 146 Brazil: Water Treatment Systems Market (Point-Of-Entry) Size, By Technology, 2013�2020 (Units)
Table 147 Brazil: Water Treatment Systems Market (Point-Of-Entry) Size, By Application, 2013�2020 (USD Million)
Table 148 Brazil: Water Treatment Systems Market (Point-Of-Entry) Size, By Application, 2013�2020 (Units)
Table 149 Standards/Regulations in the South African Water Treatment Systems Market (Point-Of-Entry)
Table 150 South Africa: Water Treatment Systems Market (Point-Of-Entry) Size, By Technology, 2013�2020 (USD Million)
Table 151 South Africa: Water Treatment Systems Market (Point-Of-Entry) Size, By Technology, 2013�2020 (Units)
Table 152 South Africa: Water Treatment Systems Market (Point-Of-Entry) Size, By Application, 2013�2020 (USD Million)
Table 153 South Africa: Water Treatment Systems Market (Point-Of-Entry) Size, By Application, 2013�2020 (Units)
Table 154 Standards/Regulations in the Saudi Arabian Water Treatment Systems Market (Point-Of-Entry)
Table 155 Saudi Arabia: Water Treatment Systems Market (Point-Of-Entry) Size, By Technology, 2013�2020 (USD Million)
Table 156 Saudi Arabia: Water Treatment Systems Market (Point-Of-Entry) Size, By Technology, 2013�2020 (Units)
Table 157 Saudi Arabia: Water Treatment Systems Market (Point-Of-Entry) Size, By Application, 2013�2020 (USD Million)
Table 158 Saudi Arabia: Water Treatment Systems Market (Point-Of-Entry) Size, By Application, 2013�2020 (Units)
Table 159 Other Countries in RoW: Water Treatment Systems Market Size, By Technology, 2013�2020 (USD Million)
Table 160 Other Countries in RoW: Water Treatment Systems Market Size, By Technology, 2013�2020 (Units)
Table 161 Other Countries in RoW: Water Treatment Systems Market Size, By Application, 2013�2020 (USD Million)
Table 162 Other Countries in RoW: Water Treatment Systems Market Size, By Application, 2013�2020 (Units)
Table 163 Agreements, Partnerships, Contracts & Joint Ventures, 2011�2015
Table 164 New Product Launches, 2011�2015
Table 165 Expansions, 2011�2015
Table 166 Mergers & Acquisitions, 2011�2015
List of Figures (49 Figures)
Figure 1 Water Treatment Systems Market (POE)
Figure 2 Research Design
Figure 3 Market Size Estimation Methodology: Bottom-Up Approach
Figure 4 Market Size Estimation Methodology: Top-DOWn Approach
Figure 5 Water Treatment Systems Market (POE)Size, By Technology, 2015 vs 2020 (USD Million)
Figure 6 Water Treatment Systems Market (POE) Size, By Region, 2015 vs 2020 (USD Million)
Figure 7 India is Projected to Be the Fastest-Growing Market for Water Treatment Systems (Point-Of-Entry) From 2015 to 2020
Figure 8 Leading Market Players Adopted Partnerships, Agreements, and Joint Ventures as Key Strategies During 2011�2015
Figure 9 Emerging Economies Offer Attractive Opportunities in the Water Treatment Systems Market (POE)
Figure 10 Water Softener Technology Segment Captured the Largest Share in the Emerging Asia-Pacific Market in 2014
Figure 11 India Projected to Be the Fastest-Growing Country Market for Water Treatment Systems (Point-Of-Entry), 2015-2020
Figure 12 Asia-Pacific Occupied the Largest Market Share Among All Regions in 2014
Figure 13 Emerging Markets to Grow Faster Than Developed Markets, 2015-2020
Figure 14 Residential Sector Accounted for the Largest Share in 2014
Figure 15 Water Treatment Systems Market (POE) in Asia-Pacific Region is Experiencing High Growth
Figure 16 Evolution of Water Treatment Systems (Point-Of-Entry)
Figure 17 Water Treatment Systems Market (POE) Segmentation
Figure 18 Increasing Contamination of Water is the Main Driver for the Growth of the Water Treatment Systems Market (Point-Of-Entry)
Figure 19 Share of Construction Spending By Region 2015 & 2020
Figure 20 Water Treatment Systems (Point-Of-Entry) Value Chain
Figure 21 Porter�s Five Forces Analysis
Figure 22 Water Softeners Segment is Projected to Dominate the Water Treatment Systems Market (Point-Of-Entry)
Figure 23 Residential Application Held the Largest Share Among All Technologies in 2014
Figure 24 Residential Segment Dominated the Water Treatment Systems Market (Point-Of-Entry) in 2014
Figure 25 Geographical Snapshot: Water Treatment Systems Market (Point-Of-Entry) Growth Rate (2015-2020)
Figure 26 Market in India Poised to Grow at the Highest Cagr By 2020
Figure 27 Asia-Pacific Market Snapshot
Figure 28 North America Market Snapshot
Figure 29 Europe Market Snapshot
Figure 30 RoW Market Snapshot
Figure 31 Companies Adopted Agreements, Partnerships, Contracts, and Joint Ventures as Their Key Growth Strategy During the Forecast Period
Figure 32 Agreements, Partnerships, Contracts & Joint Ventures Fueled Growth of the Point-Of-Entry Water Treatment Market
Figure 33 Water Treatment Systems (Point-Of-Entry) Market Developments, By Key Players, 2014
Figure 34 Key Growth Strategies, 2011�2015
Figure 35 Geographic Revenue Mix of Top 5 Players
Figure 36 The DOW Chemical Company: Company Snapshot
Figure 37 The DOW Chemical Company: SWOT Analysis
Figure 38 Honeywell International Inc.: Company Snapshot
Figure 39 Honeywell International Inc.: SWOT Analysis
Figure 40 3M Company: Company Snapshot
Figure 41 3M Company: SWOT Analysis
Figure 42 Danaher Corporation: Company Snapshot
Figure 43 Danaher Corporation: SWOT Analysis
Figure 44 Pentair PLC: Company Snapshot
Figure 45 Pentair PLC: SWOT Analysis
Figure 46 Best Water Technology: Company Snapshot
Figure 47 Calgon Carbon Corporation: Company Snapshot
Figure 48 General Electric: Company Snapshot
Figure 49 Watts Water Technologies Inc.: Company Snapshot


Growth opportunities and latent adjacency in Water Treatment Systems Market
Excellent Research Work. Thank you for sharing such a piece of great information.
Does this report include detailed analysis on Water Softeners?