The study involves four major activities that estimate the size of the wireless charging market. Exhaustive secondary research was conducted to collect information related to the market. Following this was validating these findings, assumptions, and sizing with the industry experts across the value chain through primary research. Both top-down and bottom-up approaches were employed to estimate the overall size of the wireless charging market. Subsequently, market breakdown and data triangulation procedures were used to determine the extent of different segments and subsegments of the market.
Secondary Research
Secondary sources in this research study include corporate filings (such as annual reports, investor presentations, and financial statements); trade, business, and professional associations; white papers, certified publications, articles from recognized authors; directories; and databases. The secondary data were collected and analyzed to estimate the overall market size, further validated by primary research. The relevant data is collected from various secondary sources, it is analyzed to extract insights and information relevant to the market research objectives. This analysis has involved summarizing the data, identifying trends, and drawing conclusions based on the available information.
Primary Research
In the primary research process, numerous sources from both the supply and demand sides were interviewed to obtain qualitative and quantitative information about this report. The primary sources from the supply side included various industry experts such as Chief X Officers (CXOs), Vice Presidents (VPs), and Directors from business development, marketing, product development/innovation teams, and related key executives from wireless charging providers, (such as Energizer, SAMSUNG, Plugless Power Inc., Ossia Inc., and Qualcomm Technologies, Inc.) research organizations, distributors, professional and managed service providers, industry associations, and key opinion leaders. Approximately 25% of the primary interviews were conducted with the demand side and 75% with the supply side. These data were collected mainly through questionnaires, emails, and telephonic interviews, accounting for 80% of the primary interviews.

To know about the assumptions considered for the study, download the pdf brochure
Market Size Estimation
In the market engineering process, both top-down and bottom-up approaches were implemented, along with several data triangulation methods, to estimate and validate the size of the wireless charging market and other dependent submarkets listed in this report.
-
The key players in the industry and markets were identified through extensive secondary research.
-
Both the supply chain of the industry and the market size, in terms of value, were determined through primary and secondary research.
-
All percentage shares, splits, and breakdowns were determined using secondary sources and verified through primary sources.
Market Size Estimation Methodology-Bottom-up Approach

Market Size Estimation Methodology-Top-Down Approach

Data Triangulation
After estimating the overall market size, the total market was split into several segments. The market breakdown and data triangulation procedures were employed wherever applicable to complete the overall market engineering process and gauge exact statistics for all segments. The data were triangulated by studying various factors and trends from both the demand and supply sides. The market was also validated using both top-down and bottom-up approaches.
Market Definition
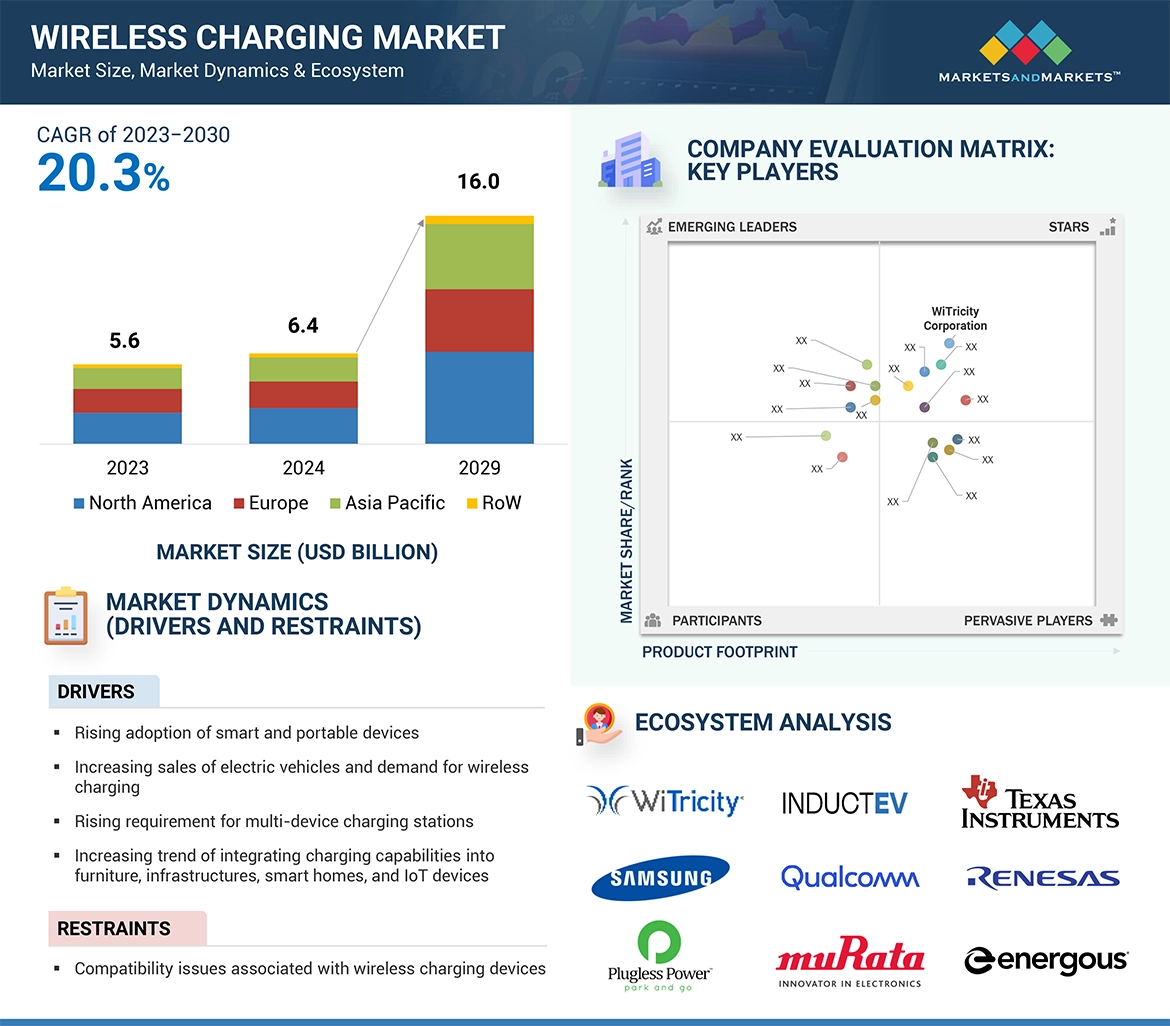
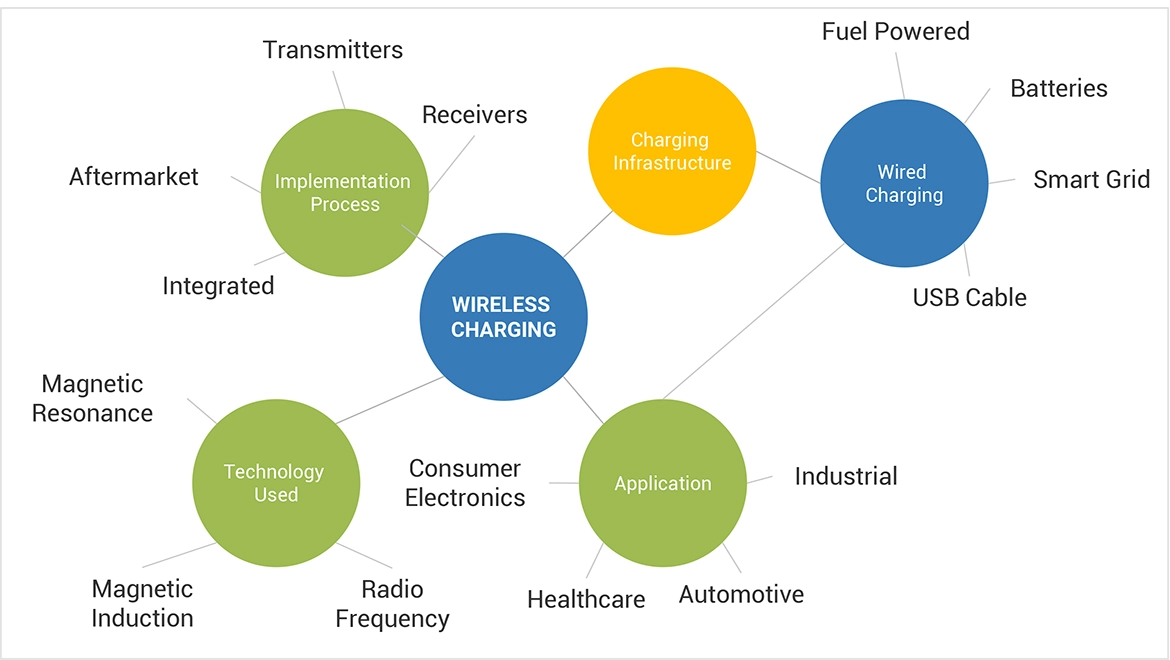
Wireless charging, or cordless charging, is a method of charging electronic devices without a physical connection. Wireless charging of electronic devices covers a variety of technologies and transmission ranges used in consumer electronics, healthcare, automotive, industrial, and other applications.
Players in the wireless charging market offer different types of technology, such as magnetic resonance, inductive, and RF technology. A wireless charging device comprises a transmitter and receiver. The transmitter acts as a standalone charger, whereas the receiver is an integrated chipset in electronic devices such as smartphones, smart watches, electric vehicles, and others.
Stakeholders
-
Raw material and manufacturing equipment suppliers
-
Electronic design automation (EDA) and design tool vendors
-
Component manufacturers
-
Original equipment manufacturers (OEMs)
-
Integrated device manufacturers (IDMs)
-
Original design manufacturers (ODMs)
-
Wireless technology service, and solution providers
-
Suppliers and distributors
-
System integrators
-
Government and other regulatory bodies
-
Technology investors
-
Research institutes and organizations
-
Market research and consulting firms
The main objectives of this study are as follows:
-
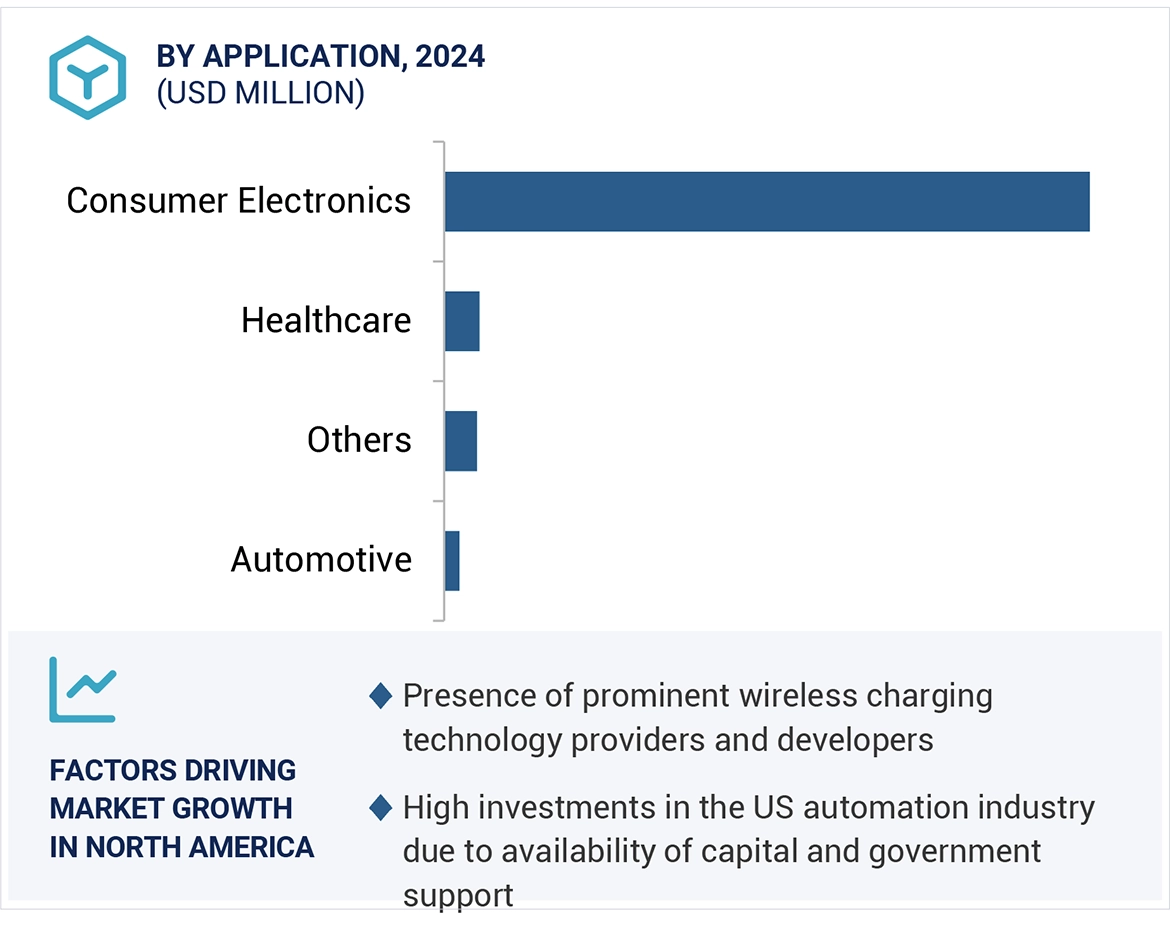
To describe and forecast the overall wireless charging market based on Implementation, technology, application, in terms of value
-
To describe and forecast the market for four key regions: North America, Europe, Asia Pacific, and Rest of the World (RoW), along with their respective countries, in terms of value
-
To analyze competitive developments such as product launches and developments, acquisitions, collaborations, agreements, and partnerships in the wireless charging market
-
To provide an analysis of the recession impact on the growth of the market and its segments
-
To define and describe the overall wireless charging market on the basis of implementation, technology, application, and geography
-
To strategically profile key players and comprehensively analyze their market position in terms of ranking and core competencies2
-
To forecast the overall wireless charging market till 2029
-
To strategically analyze the micromarkets1 with respect to individual growth trends, prospects, and contribution to the overall wireless charging market
-
To provide detailed information regarding the major factors (drivers, restraints, opportunities, and industry-specific challenges) influencing the growth of the wireless charging market
-
To analyze the opportunities in the wireless charging market and provide details of the competitive landscape for market leaders
-
To strategically profile the key players in the wireless charging market and comprehensively analyze their market presence and core competencies2
-
To analyze competitive developments, such as joint ventures, mergers & acquisitions, and new product launches, along with research and development (R&D) in the wireless charging market
Available Customizations:
With the given market data, MarketsandMarkets offers customizations according to the specific requirements of companies. The following customization options are available for the report:
Country-wise Information:
-
Analysis for additional countries (up to five)
Company Information:
-
Detailed analysis and profiling of different market players (up to five)


Varshini
Apr, 2022
Part of a marketing project, where we are pitching a new wireless charging device and we want to have data to build our proposal.
Varshini
Apr, 2022
Part of a marketing project, where we are pitching a new wireless charging device and we want to have data to build our proposal.
QUIGNON
Apr, 2022
Hello, I work on the wireless charging technology and I would to know the repartition market of each techno BR Jeremy .
SHUBHAM
Apr, 2022
Working on a project on wireless EV charging network and its present status.
Rudy
Aug, 2022
We are in the consumer electronics industry, we would like to know the market share for the phone wireless chargers and would like to know the market share for the kitchen applicants. Thank you so much. .
Carlo
Aug, 2022
:: We are working on a research project on electric engines for agricultural machinery. So the charging of batteries far from farms or roads or in-field is of interest for our research aims. .
Rei
Aug, 2022
I am implementing wireless charging in a wearable device application, and I seek to understand what the leading technologies are currently in the market. I would like to also understand what technology is expected to longer prevail in the wireless charging game. This will help me make a decision on what direction I will go with my project. .