Wireless Display Market by Offering (Hardware, Software & Services), Application ( Consumer, Commercial - Corporate, Education, Healthcare, Signage, Government), Technology Protocols (Miracast, WiDi), and Geography - Global Forecast to 2023


The wireless display market was estimated at USD 2.86 Billion in 2017. This market would grow at a CAGR of 11.1% during the forecast period and is expected to be worth USD 5.38 Billion by 2023.
The wireless display technology involves peer-to-peer media transmission between a compatible display device to a larger display without the use of wires. This allows easier setup and use in all applications. The technology can be used to transmit pictures, video, and other OTT-based content from one compatible display device to other. The wireless display has applications in the consumer segment, which is dominated by technology giants such as Google, Inc. (US), Amazon.com, Inc. (US), and Apple Inc. (US). The wireless display technology also has applications in the commercial subsegments such as corporate, healthcare, and education. The widespread use of devices such as smartphones, tablets, Smart TVs, and computers have facilitated the growth of the market in these applications. The digital signage application is expected to create a good growth opportunity for the wireless display market during the forecast period.
This report covers the wireless display market on the basis of offering, application, technology protocol, and geography. In the market, by offering, the hardware offering is expected to hold the largest market share during the forecast period while the highest growth is expected from the software and services segment. The high growth of the software and services offering is due to additional features offered such as interoperability among devices working on non-compatible protocols and the security aspect accorded to safeguard the content being transmitted wirelessly.
The wireless display market in the commercial application is expected to demonstrate the fastest growth during the forecast period. Increasing awareness of the technology has prompted its faster adoption in subsegments such as corporate, healthcare, and education. The availability of multi-user and multi-screen deployment of wireless display technology is beneficial for easily setting up a long distance meeting, which has a good acceptability in the corporate deployment. The additional security features accorded by some companies offering wireless display solutions is increasing its adoption in critical sectors such as banking.

North America held the largest share and is expected to dominate the wireless display market between 2017 and 2023. On the other hand, Asia Pacific (APAC) is expected to grow at the highest CAGR. The increasing spending power of the people in the region is boosting the growth of the market, especially in the consumer application. The other commercial application such as corporate, healthcare, and education are also contributing toward the market growth in this region.
A major deterrent for the growth of the wireless display market is the availability of cheaper substitutes for connectivity, such as HDMI cables, which are used in various applications for display casting. The cheaper hardware of wired devices is preferred over wireless display technology for video transmission from one device to other. Limited technological awareness in this regard also reduces the adoption of the wireless display technology across various applications.
The major players involved wireless display market value chain include Google, Inc. (US), Amazon.com, Inc. (US), Apple Inc. (US), Microsoft Corporation (US), Roku, Inc. (US), Lattice Semiconductor (US), NETGEAR Inc. (US), Cavium, Inc. (US), Actiontec Electronics, Inc. (US), and Belkin International, Inc. (US). These players adopted various strategies such as product launches and developments, partnerships, collaborations, business expansions and mergers to cater to the needs of consumers in the market.
To speak to our analyst for a discussion on the above findings, click Speak to Analyst
 Exclusive indicates content/data unique to MarketsandMarkets and not available with any competitors.
Table of Contents
1 Introduction (Page No. - 13)
1.1 Study Objectives
1.2 Definition
1.3 Study Scope
1.3.1 Markets Covered
1.3.2 Years Considered for the Study
1.4 Currency
1.5 Limitations
1.6 Stakeholders
2 Research Methodology (Page No. - 17)
2.1 Research Data
2.1.1 Secondary Data
2.1.1.1 Key Data From Secondary Sources
2.1.2 Primary Data
2.1.2.1 Breakdown of Primaries
2.1.2.2 Key Industry Insights
2.1.2.3 Key Data From Primary Sources
2.2 Market Size Estimation
2.2.1 Bottom-Up Approach
2.2.1.1 Approach for Capturing Market Share By Bottom-Up Analysis (Demand Side)
2.2.2 Top-Down Approach
2.2.2.1 Approach for Capturing Market Share By Top-Down Analysis (Supply Side)
2.3 Market Breakdown and Data Triangulation
2.4 Research Assumptions
3 Executive Summary (Page No. - 27)
4 Premium Insights (Page No. - 31)
4.1 Wireless Display Market, 2017 vs 2023
4.2 Market, By Application
4.3 Market, By Offering
4.4 Market, By Hardware Type
4.5 Market in APAC, By Commercial Applications and Countries
5 Market Overview (Page No. - 34)
5.1 Market Dynamics
5.1.1 Drivers
5.1.1.1 Widespread Use of Smart TVS, Smartphones, Tablets, and Computers
5.1.1.2 Evolution of Display Technologies
5.1.1.3 Increasing Adoption of On-Demand Entertainment
5.1.1.4 Simplified Setup and Ease of Connection
5.1.2 Restraints
5.1.2.1 Cheaper Substitute in Wired Connectivity Devices Such as HDMI and USB
5.1.3 Opportunities
5.1.3.1 Growing Digital Signage and Dooh Market
5.1.4 Challenges
5.1.4.1 Interoperability of Technology Protocols
5.1.4.2 High Cost and Lack of Awareness About the Wireless Display Technology
5.2 Value Chain Analysis
5.2.1 Research and Development
5.2.2 Product Development
5.2.3 System Integration
5.2.4 Distribution and Services
5.3 Key Industry Trends
6 Wireless Display Market, By Offering (Page No. - 42)
6.1 Introduction
6.2 Hardware
6.2.1 Brand Product Integrated
6.2.2 Standalone
6.3 Software and Services
7 Wireless Display Market, By Technology Protocol (Page No. - 49)
7.1 Introduction
7.2 Wirelesshd
7.3 WIDI
7.4 Miracast
7.5 Airplay
7.6 Google Cast
7.7 DLNA
7.8 Others (WHDI, Wigig, & UWB)
8 Wireless Display Market, By Application (Page No. - 53)
8.1 Introduction
8.2 Consumer
8.3 Commercial
8.3.1 Corporate & Broadcast
8.3.2 Education
8.3.3 Healthcare
8.3.4 Digital Signage
8.3.5 Government (Defense, Command Center,& Public Offices)
8.3.6 Others (Automotive and Transportation, Industrial, & Hospitality)
9 Geographic Analysis (Page No. - 67)
9.1 Introduction
9.2 North America
9.2.1 US
9.2.2 Canada
9.2.3 Mexico
9.3 Europe
9.3.1 UK
9.3.2 Germany
9.3.3 France
9.3.4 Rest of Europe
9.4 APAC
9.4.1 China
9.4.2 Japan
9.4.3 South Korea
9.4.4 Rest of APAC
9.5 RoW
9.5.1 Middle East
9.5.2 South America
9.5.3 Africa
10 Competitive Landscape (Page No. - 85)
10.1 Overview
10.2 Market Ranking Analysis: Wireless Display Market, 2016
11 Company Profiles (Page No. - 88)
11.1 Introduction
(Business Overview, Products Offered & Services Strategies, Key Insights, Recent Developments, MnM View)*
11.2 Google
11.3 Amazon
11.4 Apple
11.5 Microsoft
11.6 Roku
11.7 Lattice Semiconductor
11.8 Netgear
11.9 Cavium
11.10 Actiontec Electronics
11.11 Belkin International
11.12 Key Innovative Players
11.12.1 Airtame
11.12.2 Splashtop
11.12.3 Qualcomm
11.12.4 Squirrels LLC
11.12.5 App Dynamic EHF.
*Details on Business Overview, Products Offered & Services Strategies, Key Insights, Recent Developments, MnM View Might Not Be Captured in Case of Unlisted Companies.
12 Appendix (Page No. - 120)
12.1 Discussion Guide
12.2 Knowledge Store: Marketsandmarkets’ Subscription Portal
12.3 Introducing RT: Real-Time Market Intelligence
12.4 Available Customization
12.5 Related Reports
12.6 Author Details
List of Tables (36 Tables)
Table 1 Major Secondary Sources
Table 2 Wireless Display Market, By Offering, 2014–2023 (USD Million)
Table 3 Market for Hardware, By Application, 2014–2023 (USD Million)
Table 4 Market for Hardware, By Type, 2014–2023 (USD Million)
Table 5 Market for Brand Product Integrated Hardware, By Application, 2014–2023 (USD Million)
Table 6 Market for Standalone Hardware, By Application, 2014–2023 (USD Million)
Table 7 Market for Software & Services, By Application, 2014–2023 (USD Million)
Table 8 Market, By Application, 2014–2023 (USD Million)
Table 9 Market for Consumer Application, By Volume and Value, (Million Units and USD Million)
Table 10 Market for Consumer Application, By Offering, 2014–2023 (USD Million)
Table 11 Market for Consumer Application, By Hardware Type, 2014–2023 (USD Million)
Table 12 Market for Consumer Application, By Region, 2014–2023 (USD Million)
Table 13 Market for Commercial Application, 2014–2023 (USD Million)
Table 14 Market for Commercial Application, By Offering, 2014–2023 (USD Million)
Table 15 Market for Commercial Application, By Hardware Type, 2014–2023 (USD Million)
Table 16 Market for Commercial Application, By Region, 2014–2023 (USD Million)
Table 17 Market for Corporate & Broadcast, By Region, 2014–2023 (USD Million)
Table 18 Market for Education, By Region, 2014–2023 (USD Million)
Table 19 Market for Healthcare, By Region, 2014–2023 (USD Million)
Table 20 Market for Digital Signage, By Region, 2014–2023 (USD Million)
Table 21 Market for Government, By Region, 2014–2023 (USD Million)
Table 22 Market for Other Applications, By Region, 2014–2023 (USD Million)
Table 23 Market, By Region, 2014–2023 (USD Million)
Table 24 Market in North America, By Application, 2014–2023 (USD Million)
Table 25 Market in North America, By Commercial Application, 2014–2023 (USD Million)
Table 26 Market in North America, By Country, 2014–2023 (USD Million)
Table 27 Market in Europe, By Application, 2014–2023 (USD Million)
Table 28 Market in Europe, By Commercial Application, 2014–2023 (USD Million)
Table 29 Market in Europe, By Country, 2014–2023 (USD Million)
Table 30 Market in APAC, By Application, 2014–2023 (USD Million)
Table 31 Market in APAC, By Commercial Application, 2014–2023 (USD Million)
Table 32 Market in APAC, By Country, 2014–2023 (USD Million)
Table 33 Market in RoW, By Application, 2014–2023 (USD Million)
Table 34 Market in RoW, By Commercial Application, 2014–2023 (USD Million)
Table 35 Market in RoW, By Region, 2014–2023 (USD Million)
Table 36 Market Ranking, 2016
List of Figures (46 Figures)
Figure 1 Market Segmentation
Figure 2 Geographic Segmentation
Figure 3 Market: Process Flow of Market Size Estimation
Figure 4 Market: Research Design
Figure 5 Market Size Estimation Methodology: Bottom-Up Approach
Figure 6 Market Size Estimation Methodology: Top-Down Approach
Figure 7 Data Triangulation
Figure 8 Market 2014–2023 (USD Billion)
Figure 9 Market for Software and Services is Expected to Grow at A Higher CAGR During the Forecast Period
Figure 10 Market for Commercial Applications is Expected to Grow at A Higher CAGR During the Forecast Period
Figure 11 Market, By Geography
Figure 12 Consumer Electronics Products Such as Smartphones, Tablets, and Smart TVS Driving the Adoption of the Wireless Display Technology
Figure 13 Market for Commercial Applications Expected to Grow at A Higher CAGR During the Forecast Period
Figure 14 Market for Hardware to Hold A Larger Share Till 2023
Figure 15 Standalone Hardware to Hold A Larger Share in the Market for Hardware During the Forecast Period
Figure 16 China to Hold the Largest Share of the Market for Commercial Applications in APAC During the Forecast Period
Figure 17 Drivers, Restraints, Opportunities, and Challenges for the Market
Figure 18 Digital Signage Market, 2014–2023 (USD Billion)
Figure 19 Value Chain: Market
Figure 20 Key Industry Trends: Market
Figure 21 Market for Software and Services is Expected to Grow at Highest CAGR During Forecast Period
Figure 22 Market for Hardware in Commercial Applications is Expected to Grow at Fastest CAGR During Forecast Period
Figure 23 Commercial Application is Expected to Dominate Market for Software and Services During Forecast Period
Figure 24 Market Segmentation, By Technology Protocol
Figure 25 Market for Commercial Application is Expected to Grow at Higher CAGR During Forecast Period
Figure 26 Market for Consumer Application, By Region, 2014 vs 2023 (USD Million)
Figure 27 North America Expected to Dominate Market for Commercial Application During Forecast Period
Figure 28 Market for Educational Application Expected to Grow at Fastest CAGR in Europe During Forecast Period
Figure 29 North America Expected to Dominate Market for Government Application During Forecast Period
Figure 30 Market, By Region, 2017 vs 2023 (USD Million)
Figure 31 Geographic Snapshot of Market: Japan Expected to Be Fastest-Growing Country in Wireless Display Market
Figure 32 North America: Market Snapshot
Figure 33 Market in North America, By Country, 2017 vs 2023 (USD Million)
Figure 34 Europe: Market Snapshot
Figure 35 Market in Europe, By Country, 2017 vs 2023 (USD Million)
Figure 36 APAC: Market Snapshot
Figure 37 Market in APAC, By Country, 2017 vs 2023 (USD Million)
Figure 38 Market in RoW, By Region, 2017 vs 2023 (USD Million)
Figure 39 Companies Adopted Product Development as Key Growth Strategy Between 2015 and 2017
Figure 40 Google: Company Snapshot
Figure 41 Amazon: Company Snapshot
Figure 42 Apple: Company Snapshot
Figure 43 Microsoft: Company Snapshot
Figure 44 Lattice Semiconductor: Company Snapshot
Figure 45 Netgear: Company Snapshot
Figure 46 Cavium: Company Snapshot
The wireless display market was valued USD 2.34 Billion in 2016 and is expected to be worth USD 5.38 Billion by 2023, growing at a CAGR of 11.1% from 2017 to 2023. The widespread use of consumer products such as smartphones, tablets, smart TVs, and computers have increased the deployment of innovative technology such as the wireless display in numerous applications. The market for the consumer applications is majorly driven by the availability of increasing OTT-based content. On the other hand, the market for commercial application is driven by ease of set up and cost-saving benefits compared with wired connecting devices. The base year considered for the study is 2016, and the market size forecast is given for the period between 2017 and 2023.
The prime objectives of this report can be summarized in the following points:
- To define, describe, and forecast the wireless display market, in terms of value, segmented on the basis of offering, application, and geography
- To analyze the impact of a number of wireless display protocols prevalent in the market
- To analyze and forecast the market size, in terms of volume, segmented on the basis of offering
- To provide the market size estimation for four main regions (along with countries)—North America, Europe, Asia Pacific (APAC), and Rest of the World (RoW)
- To identify and analyze major factors (drivers, restraints, opportunities, and challenges) influencing the growth of the market
- To strategically profile the key players and comprehensively analyze their market position in terms of their market rankings
This research study involves the extensive use of secondary sources, directories, and databases (such as Hoovers, Bloomberg Business, Factiva, and OneSource) to identify and collect information useful for this study. The research methodology followed in this report is explained below.
- To analyze all the applications of wireless display technology worldwide
- To analyze the trend and penetration rate of wireless display products in various applications and geographies
- To estimate market size in terms of value, on the basis of offerings
- To estimate the market size of the wireless display technology in terms of applications across various regions
- To provide the overall market size along with data triangulation with supply-side data including product developments, supply chain, and estimated sales of products using wireless display technology
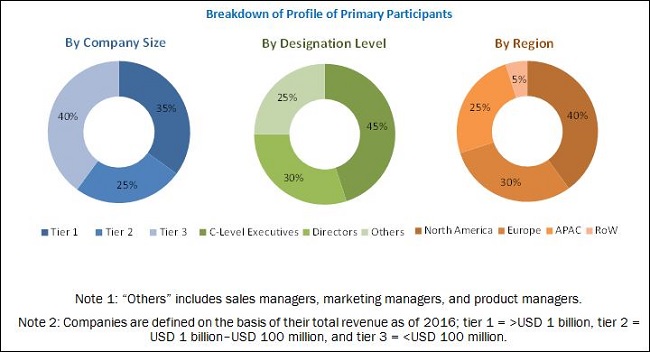
After arriving at the overall market size, the total market has been split into several segments and subsegments, which is confirmed by key industry experts. The following figure shows the breakdown of primaries on the basis of company type, designation, and region:
To know about the assumptions considered for the study, download the pdf brochure
The wireless display market ecosystem includes players catering to consumer electronics segment such as Google, Inc. (US), Amazon.com, Inc. (US), Roku, Inc. (US), and Apple Inc. (US); and those catering to commercial segment such as Actiontec Electronics, Inc. (US), Lattice Semiconductor (US), and Airtame Inc. (Denmark); and software service providers such as Squirrels LLC (US) and App Dynamic ehf. (Iceland).
Scope of the Report:
|
Report Metric |
Details |
|
Report Name |
wireless display market |
|
Base year |
2016 |
|
Forecast period |
2017–2023 |
|
Units |
Value (USD) |
|
Segments covered |
Type, End User, Offerings, and Region |
|
Geographic regions covered |
North America, APAC, Europe, and RoW |
|
Companies covered |
Google, Inc. (US), Amazon.com, Inc. (US), Apple Inc. (US), Microsoft Corporation (US), Roku, Inc. (US), Lattice Semiconductor (US), NETGEAR, Inc. (US), Cavium, Inc. (US), Actiontec Electronics, Inc. (US), and Belkin International, Inc. (US). |
Key Target Audience:
- Retailers, e-commerce platforms, and product distributors
- Wireless display product developers
- Brand customers/original equipment manufacturers (OEM)/original device manufacturers (ODM)
- Technology/Protocol developers
- Consumer electronics product vendors
- Educational institutes
- Medical and industrial product vendors
- Consulting and market research service providers
- Wireless display-related associations, organizations, forums, and alliances
- Government bodies such as regulatory authorities and policymakers
- Venture capitalists and start-ups
- Software solution providers
- Semiconductor component suppliers
- Research institutes, organizations, and consulting companies
Scope of the Report:
The research report segments the wireless display market into the following submarkets:
By Offering
-
Hardware
- Standalone
- Brand Product Integrated
- Software & Services
By Application
- Consumer
-
Commercial
- Corporate & Broadcast
- Digital Signage
- Government (Defense, Command Center, & Public Offices)
- Healthcare
- Education
- Others (Automotive and Transportation, Industrial, & Hospitality)
By Technology Protocol
- WirelessHD
- WiDi
- Miracast
- AirPlay
- Google Cast
- DLNA
- Others (WHDI, WiGig, and UWB)
By Region
-
North America
- US
- Canada
- Mexico
-
Europe
- UK
- Germany
- France
- Rest of Europe (RoE)
-
Asia Pacific (APAC)
- China
- Japan
- South Korea
- Rest of APAC (RoAPAC)
-
Rest of the World (RoW)
- The Middle East
- South America
- Africa
Available Customizations:
With the given market data, MarketsandMarkets offers customizations according to the company’s specific needs. The following customization options are available for the report:
Detailed analysis and profiling of additional market players (up to 5)


Growth opportunities and latent adjacency in Wireless Display Market