
Laboratory Information Management System Market: Growth, Size, Share, and Trends

Laboratory Information Management System Market by Type (Industry), Component (Software, Services), Deployment (On-premise, Cloud (SaaS, PaaS, IaaS)), Company Size (Mid-sized), Industry (Pharma, NGS, Chemicals, Agri, FnB, Oil), & Region - Global Forecast to 2030


OVERVIEW
Source: Secondary Research, Interviews with Experts, MarketsandMarkets Analysis
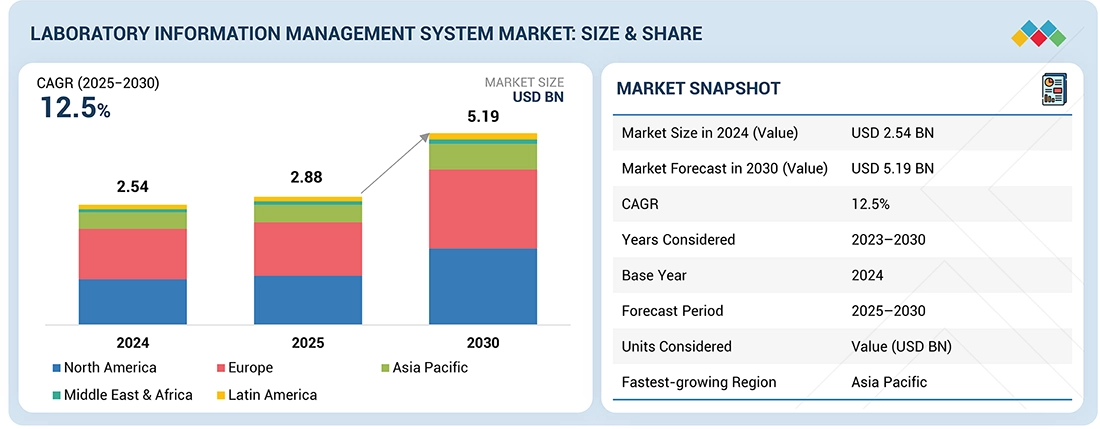
The laboratory information management system (LIMS) market size is projected to reach USD 5.19 billion by 2030, from USD 2.88 billion in 2025, at a CAGR of 12.5% during the forecast period. This growth is primarily driven by the increasing demand for automation in laboratories, rising regulatory compliance requirements, and the growing need for efficient data management in research and clinical diagnostics. The integration of cloud-based solutions, artificial intelligence (AI), and advanced analytics into LIMS platforms further enhances data accuracy, workflow efficiency, and decision-making, thereby contributing to market expansion.
KEY TAKEAWAYS
- The North America laboratory information management system (LIMS) market accounted for a 40.5% revenue share in 2025.
- By component, the software segment is expected to register the highest CAGR of 13.1%.
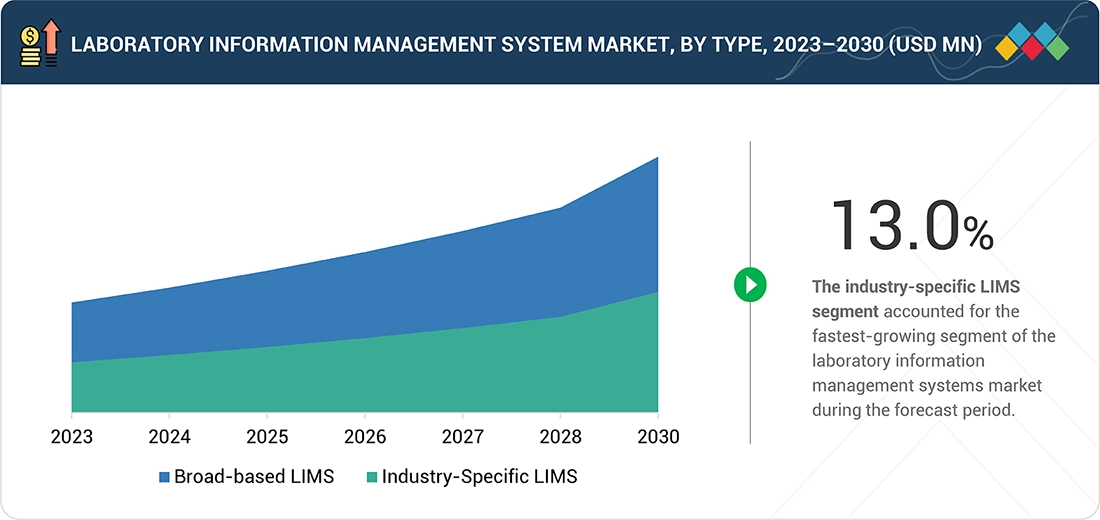
- By type, the industry-specific LIMS segment is expected to register the highest CAGR of 13%.
- By deployment, the on-premise LIMS segment commanded the largest share of the LIMS market in 2024.
- By company size, the large companies segment accounted for the largest share of the LIMS market.
- By industry the life science industry segment accounted for the largest share of the LIMS market.
- Major market players have adopted both organic and inorganic strategies, including partnerships and investments. For instance, LabWare (US), LabVantage Solutions, Inc. (US), Thermo Fisher Scientific Inc. (US) have entered into a number of agreements and partnerships to cater to the growing demand for LIMS across innovative applications.
- Agilab, Agaram Technologies, and Assaynet, among others, have distinguished themselves among startups and SMEs by securing strong footholds in specialized niche areas, underscoring their potential as emerging market leaders
The laboratory information management system (LIMS) market is steadily expanding, supported by increasing digital transformation initiatives and the growing emphasis on data-driven research and healthcare operations in the US and EU. Advances in cloud computing, artificial intelligence (AI), and automation are improving data accuracy, operational efficiency, and regulatory compliance. Moreover, strategic collaborations between LIMS providers, research institutions, and healthcare organizations are fostering innovation and enabling more integrated, scalable, and intelligent laboratory ecosystems.
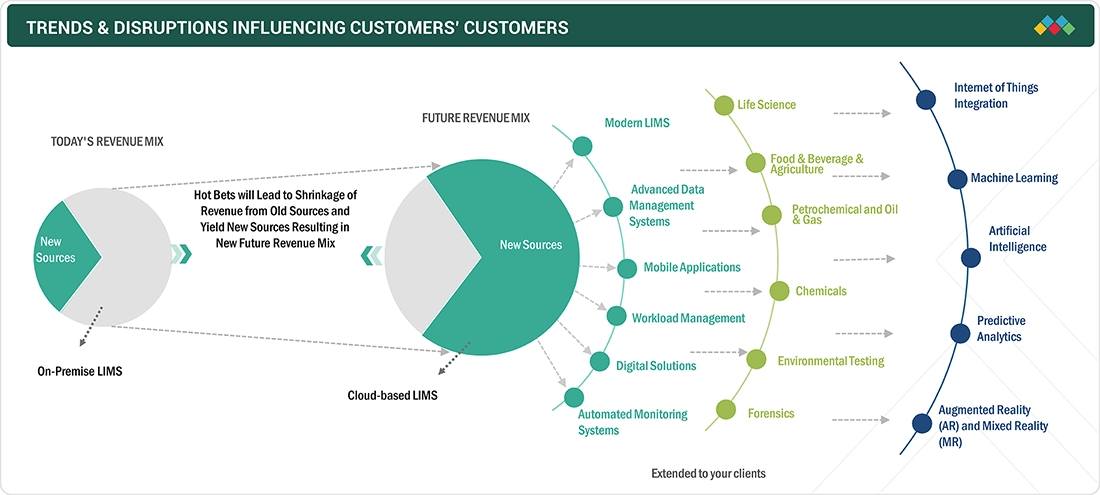
TRENDS & DISRUPTIONS IMPACTING CUSTOMERS' CUSTOMERS
The impact on consumers' business in the Laboratory Information Management System (LIMS) market stems from evolving customer needs and technological advancements. Clinical research laboratories, pharmaceutical companies, and academic research institutes are the primary end users, and their application requirements shape LIMS adoption. Shifts in these trends or disruptions, such as growing demand for cloud-based platforms, AI integration, or enhanced data analytics, directly influence end-user revenues and consequently affect the financial performance of LIMS solution providers.
Source: Secondary Research, Interviews with Experts, MarketsandMarkets Analysis
MARKET DYNAMICS
Level
-
Increasing adoption of cloud-based and integrated LIMS

-
Growing R&D expenditure in pharmaceutical and biotechnology companies

Level
-
High maintenance and service costs

-
Lack of integration standards for LIMS

Level
-
Growing use of LIMS in cannabis industry

-
Significant growth potential in emerging economies

Level
-
Dearth of trained professionals

-
Interfacing challenges with informatics software

Source: Secondary Research, Interviews with Experts, MarketsandMarkets Analysis
Driver: Increasing adoption of cloud-based and integrated LIMS
The increasing adoption of cloud-based and integrated LIMS is a key driver of market growth. Cloud-based solutions offer cost-effectiveness, scalability, and real-time data access without the need for heavy IT infrastructure or upfront investments. They enable seamless data sharing across research, manufacturing, and academic networks, reducing total ownership costs and enhancing collaboration. Moreover, the integration of LIMS with systems like ERP, CDS, and SDMS supports better data management, automation, and operational efficiency, further driving demand across pharmaceutical, biotechnology, and manufacturing industries.
Restraint: High maintenance and service costs
High maintenance and service costs remain a key restraint for the LIMS market, particularly for small and medium-sized laboratories with limited budgets. Recurring expenses for maintenance, support, and implementation, often exceeding the software’s initial price, can reduce ROI and delay adoption. This financial barrier may lead organizations to postpone or limit LIMS implementation, slowing market growth. However, the rise of cloud-based subscription models and flexible service agreements is helping to mitigate these challenges and encourage broader adoption.
Opportunity: Growing use of LIMS in cannabis industry
The growing legalization of medical cannabis has created a significant opportunity for LIMS in cannabis testing laboratories. These systems help manage data from potency, heavy metal, pesticide, and microbial testing, integrate with lab instruments, ensure compliance with FDA CFR 21 Part 11, and streamline reporting. Adoption is increasing, particularly in the US, with solutions like CannaLIMS, Sample Master, LabLynx LIMS, and Matrix Gemini supporting quality control and regulatory compliance, a trend expected to expand as more regions legalize cannabis.
Challenge: Dearth of trained professionals
The LIMS market faces a challenge due to a shortage of trained professionals with IT and analytical skills needed to manage and interpret laboratory data. Over 56% of healthcare organizations report a shortage of IT talent, and the employment of medical laboratory technologists and technicians in the US is projected to rise by 13%, from 335,700 in 2016 to 378,400 in 2026. This talent gap, affecting over 50% of the market in pharmaceutical, biotechnology, and medical device sectors, limits the adoption and effective utilization of LIMS. Time constraints, budget limitations, and reluctance to invest in employee training further hinder widespread implementation, potentially slowing market growth.
Laboratory Information Management System Market: COMMERCIAL USE CASES ACROSS INDUSTRIES
| COMPANY | USE CASE DESCRIPTION | BENEFITS |
|---|---|---|
 |
Automates sample tracking, workflow scheduling, instrument integration, and regulatory compliance | Automates sample tracking, workflow scheduling, instrument integration, and regulatory compliance |
 |
Modular LIMS with integrated electronic lab notebooks (ELN), industry-specific solutions, and advanced analytics | Enables faster deployment, scalable architecture, secure data management, and optimized lab workflows |
 |
Enterprise-wide LIMS platform covering sample, inventory, data, and instrument management across industries | Boosts productivity, minimizes data entry errors, supports automation, and simplifies regulatory adherence |
 |
LIMS for regulated sectors with ELN, scientific data management (SDMS), mobile access, and analytics | Provides high traceability, secure audit trails, multi-site scalability, and regulatory compliance support |
 |
SLIMS combines LIMS and ELN with flexible workflows, real-time data, and instrument integration | Reduces manual tasks, lowers error rates, supports compliance, and offers flexible deployment options |
Logos and trademarks shown above are the property of their respective owners. Their use here is for informational and illustrative purposes only.
MARKET ECOSYSTEM
The Laboratory Information Management System (LIMS) market ecosystem comprises key players, including Thermo Fisher Scientific, LabWare, LabVantage Solutions, and Agilent Technologies, which offer advanced platforms for data management, sample tracking, and workflow automation. Cloud computing and AI technology partners enhance system scalability and interoperability. End users, including pharmaceutical companies, research laboratories, and CROs, utilize these solutions to improve efficiency, compliance, and data integrity. Collaboration among vendors, research organizations, and government initiatives continues to foster innovation and accelerate the digital transformation of laboratory operations.
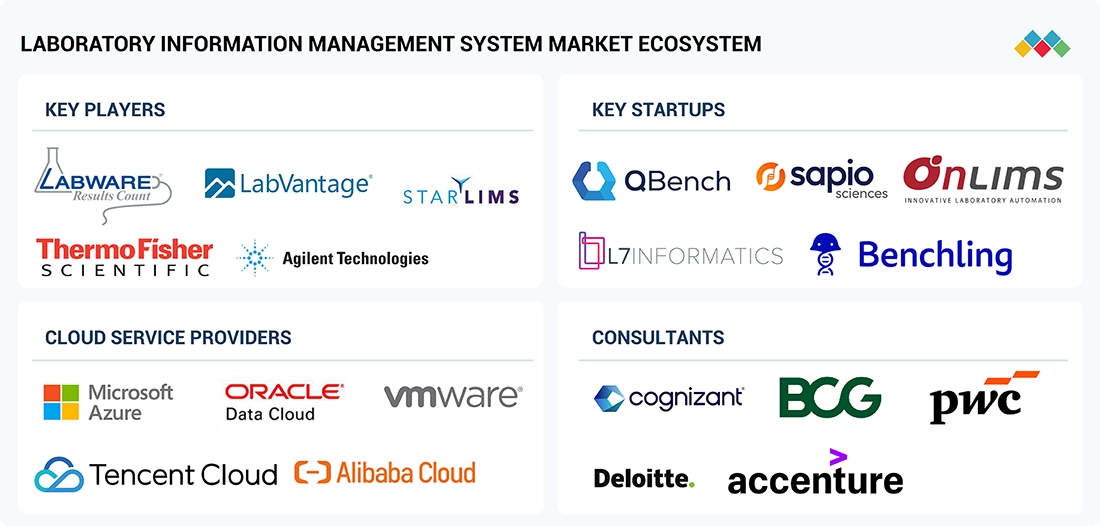
Logos and trademarks shown above are the property of their respective owners. Their use here is for informational and illustrative purposes only.
MARKET SEGMENTS
Source: Secondary Research, Interviews with Experts, MarketsandMarkets Analysis
Laboratory Information Management System (LIMS) Market, By Component
Based on component, the Laboratory Information Management System (LIMS) market includes software, services, and support, with the services segment holding the largest share. The growth of this segment is driven by increasing demand for system implementation, integration, and maintenance services, as well as the need for training and technical support. Organizations are increasingly outsourcing these services to ensure smooth deployment and optimal utilization of LIMS solutions. Moreover, the rising adoption of cloud-based and customized LIMS has further boosted the demand for professional services in the market.
Laboratory Information Management System (LIMS) Market, By Type
Key types of LIMS include broad-based and industry-specific solutions, with the broad-based LIMS segment holding the largest market share. This growth is attributed to its versatility, ability to cater to multiple laboratory workflows, and compatibility with a wide range of industries, including pharmaceuticals, biotechnology, and diagnostics. Additionally, broad-based LIMS offer scalable and customizable features, enabling laboratories to streamline operations, improve data management, and enhance compliance across diverse applications.
Laboratory Information Management System (LIMS) Market, By Deployment Model
Key deployment models in the LIMS market include on-premise, cloud-based, and remotely hosted solutions, with on-premise LIMS holding the largest share of the LIMS Market. This is due to its high level of data security, greater control over system customization, and compliance with stringent regulatory requirements, making it the preferred choice for pharmaceutical, biotechnology, and diagnostic laboratories. Additionally, organizations with existing IT infrastructure find on-premise solutions more reliable for handling large volumes of sensitive laboratory data.
Laboratory Information Management System (LIMS) Market, By Company Size
Key company sizes in the LIMS market include large, medium-sized, and small companies, with large companies holding the largest share. The growth of this segment is attributed to their greater financial resources, ability to invest in advanced laboratory informatics solutions, and extensive adoption of LIMS across multiple facilities and research centers. Additionally, large companies often require robust data management, regulatory compliance, and workflow automation, driving higher demand for comprehensive LIMS solutions.
Laboratory Information Management System (LIMS) Market, By Industry
Industry applications of LIMS include life sciences, food & beverage, agriculture, petrochemicals and oil & gas, chemicals, environmental testing, forensics, and others, with the life sciences segment holding the largest share. Growth in this segment is primarily due to the increasing demand for efficient laboratory data management, stringent regulatory compliance, and the need for automation in pharmaceutical, biotechnology, and medical research laboratories. Moreover, rising R&D activities, clinical trials, and the focus on quality control and product safety further drive the adoption of LIMS in the life sciences industry.
REGION
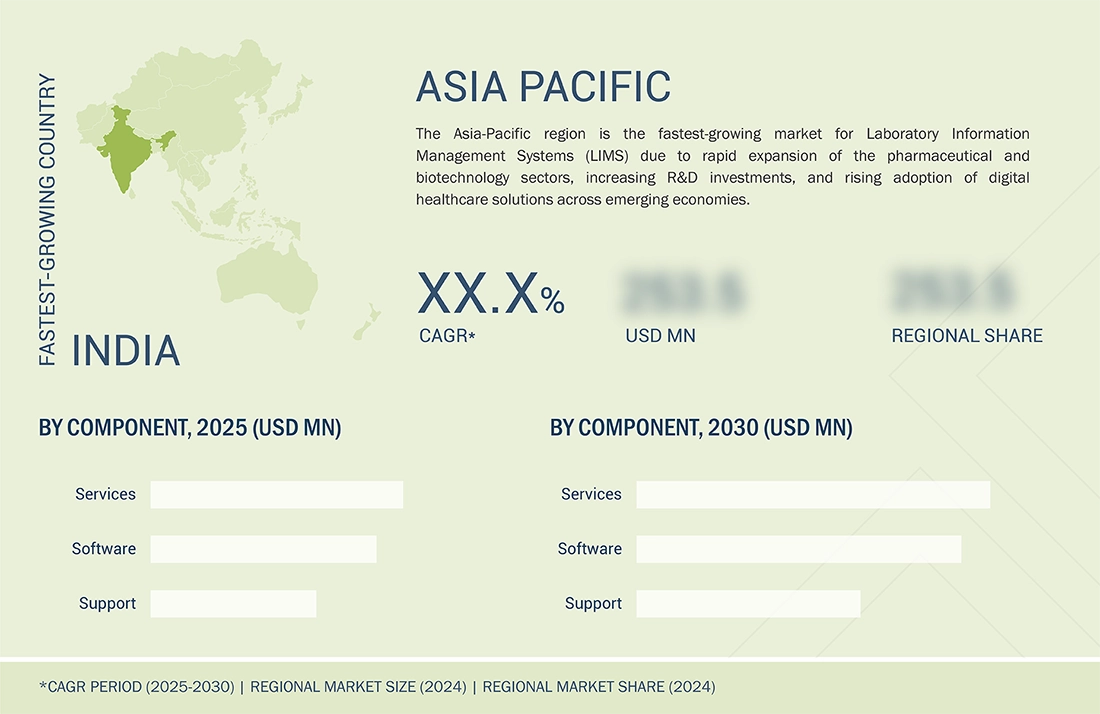
Asia Pacific to be fastest-growing region in global laboratory information management system (LIMS) market during forecast period
Asia Pacific is expected to be the fastest-growing region in the global Laboratory Information Management System (LIMS) market during the forecast period. This is due to increasing investments in pharmaceutical and biotechnology research, rising demand for advanced laboratory automation, and supportive government initiatives to strengthen healthcare and R&D infrastructure across emerging economies. Moreover, the region’s growing number of diagnostic laboratories and adoption of digital technologies further drive LIMS market growth.
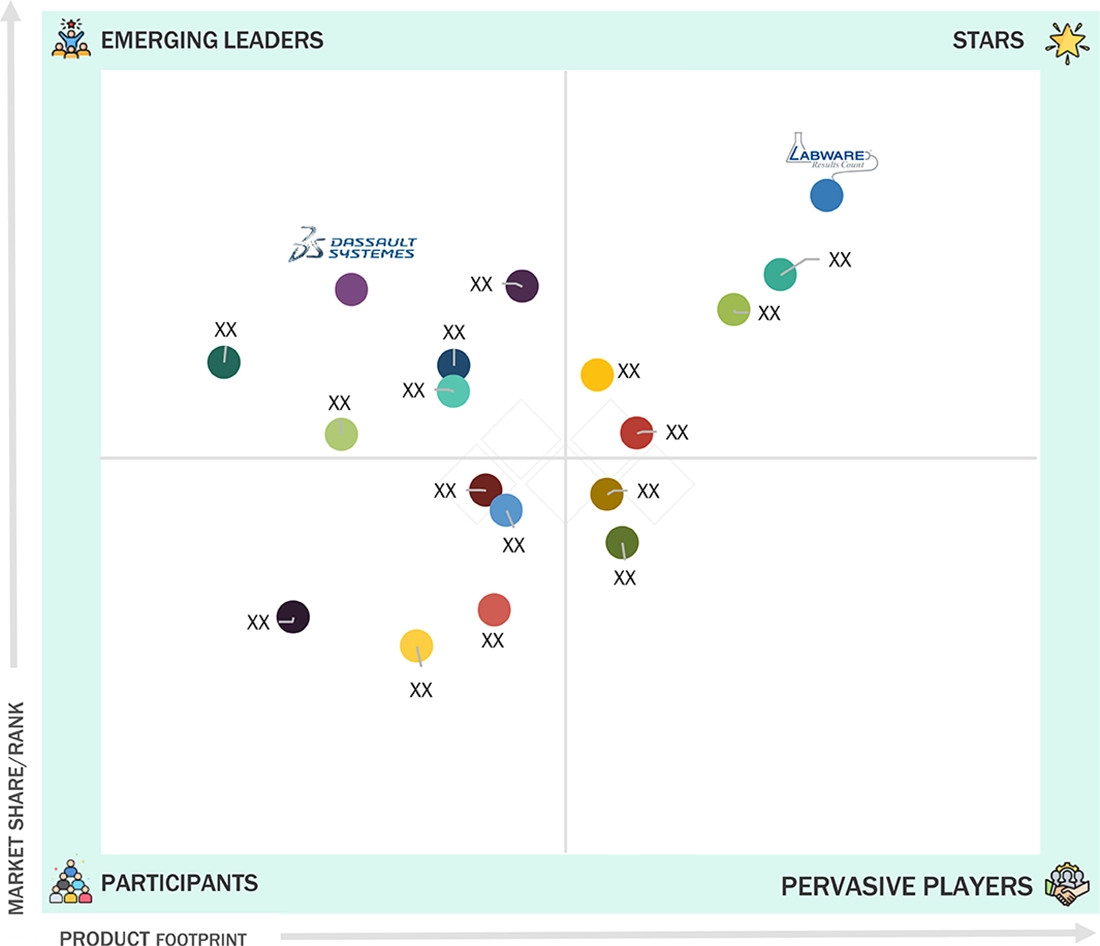
Laboratory Information Management System Market: COMPANY EVALUATION MATRIX
In the LIMS market matrix, LabWare (Star) leads with a strong market presence and a comprehensive software portfolio, driven by scalable and customizable LIMS solutions, cloud and on-premise deployment options, and seamless integration with ERP, CDS, and SDMS platforms. The company’s focus on workflow automation, regulatory compliance, and advanced data management reinforces its dominant position across pharmaceutical, biotechnology, and diagnostic laboratories globally. Dassault Systèmes (Emerging Leader) is gaining traction with innovative LIMS solutions that emphasize digital lab transformation, collaborative R&D, and predictive analytics, strengthening its position through niche capabilities and industry-specific offerings that address evolving laboratory needs.
Source: Secondary Research, Interviews with Experts, MarketsandMarkets Analysis
KEY MARKET PLAYERS
MARKET SCOPE
| REPORT METRIC | DETAILS |
|---|---|
| Market Size in 2024 (Value) | USD 2.54 Billion |
| Market Forecast in 2030 (Value) | USD 5.19 Billion |
| Growth Rate | CAGR of 12.5% from 2025-2030 |
| Years Considered | 2023-2030 |
| Base Year | 2024 |
| Forecast Period | 2025-2030 |
| Units Considered | Value (USD/Billion) |
| Report Coverage | Revenue forecast, company ranking, competitive landscape, growth factors, and trends |
| Segments Covered |
|
| Regions Covered | North America, Europe, Asia Pacific, Latin America, Middle East & Africa |
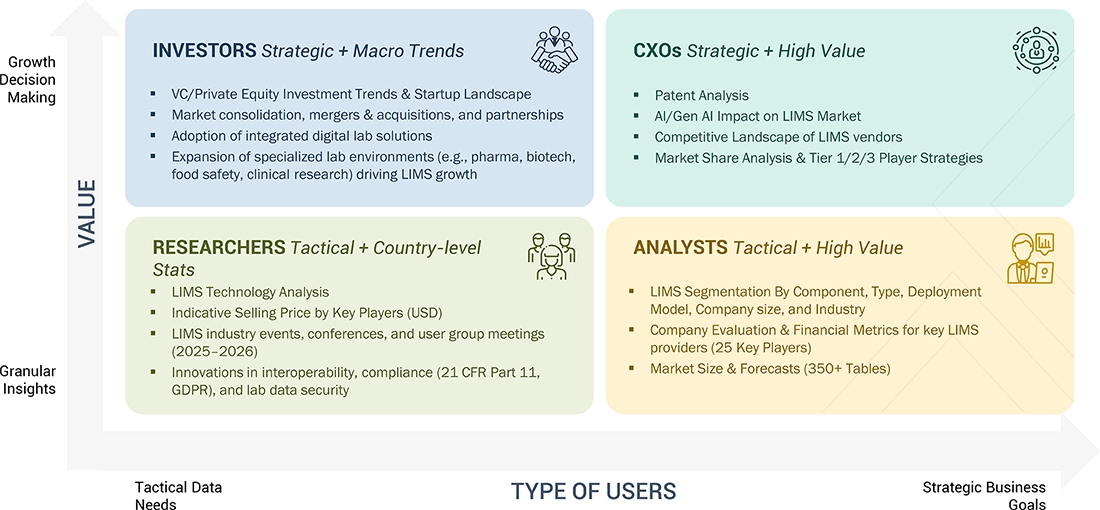
WHAT IS IN IT FOR YOU: Laboratory Information Management System Market REPORT CONTENT GUIDE
DELIVERED CUSTOMIZATIONS
We have successfully delivered the following deep-dive customizations:
| CLIENT REQUEST | CUSTOMIZATION DELIVERED | VALUE ADDS |
|---|---|---|
| Competitive Landscape Mapping | Profiles and market share of leading LIMS vendors (e.g., LabWare, Thermo Fisher Scientific, Dassault Systèmes, Agilent Technologies) covering software offerings, service capabilities, cloud/on-premise deployment, integration with ERP, CDS, SDMS, and AI-enabled analytics. | Enables benchmarking of software and service capabilities, identification of differentiation opportunities, assessment of market share by region and industry, and strategic portfolio expansion planning. |
| Market Entry & Growth Strategy | Regional assessment of regulatory pathways, adoption trends in pharmaceutical, biotechnology, diagnostic, and academic laboratories, and partnership ecosystems (CROs, research institutions, IT vendors). | Reduces go-to-market risk, accelerates adoption of LIMS solutions, and supports localization, partnership, and market expansion strategies. |
| Regulatory & Operational Risk Analysis | Evaluation of compliance frameworks (FDA, EMA, ISO 17025, regional authorities), data privacy standards, and interoperability challenges in laboratory operations. | Supports risk mitigation, ensures regulatory readiness, and enhances vendor credibility with laboratory and healthcare institutions. |
| Technology Adoption Trends | Insights into adoption of cloud-based, AI-integrated, and automated LIMS capabilities, integration with laboratory instruments, and regional enablers such as digital lab initiatives, funding, and research collaborations. | Guides R&D prioritization, informs market positioning, and drives targeted technology investments for sustainable growth. |
RECENT DEVELOPMENTS
- April 2025 : LabWare ASSURE is a cloud-based SaaS platform that enhances food safety and quality management through digital traceability and compliance. The platform offers end-to-end tracking of ingredients and products, automated generation of Certificates of Analysis (CoAs), and seamless integration with ERP systems.
- March 2025 : LabVantage 8.9 was introduced with major upgrades to boost lab efficiency and usability, including faster performance through database partitioning, Al-powered features such as voice command support, and enhanced automation with streamlined configuration tools.
- January 2024 : Thermo Fisher Scientific Inc. launched the Gibco Cell Therapy Systems (CTS) Cellmation Software, a first-of-its-kind automation solution designed to connect and integrate workflows. The CTS Cellmation Software, powered by Emerson's DeltaV Distributed Control System (DCS), connects Thermo Fisher's cell therapy instruments within a user-friendly interface, reducing the number of manual touchpoints required.
Table of Contents
 Exclusive indicates content/data unique to MarketsandMarkets and not available with any competitors.
Methodology
This research study involved the wide use of secondary sources, directories, and databases such as Dun & Bradstreet, Bloomberg Business, and Factiva; white papers, annual reports, and companies’ house documents; investor presentations; and the SEC filings of companies. The market for companies providing laboratory information management system solutions is assessed using secondary data from paid and free sources. This involves analyzing the product portfolios of major players in the industry and evaluating these companies based on their performance and quality. Various resources were utilized in the secondary research process to gather information for this study. The sources include annual reports, press releases, investor presentations, white papers, academic journals, certified publications, articles by recognized authors, directories, and databases.
The secondary research process involved referring to various secondary sources to identify and collect information related to the study. These sources included annual reports, press releases, investor presentations of laboratory information management system vendors, forums, certified publications, and whitepapers. The secondary research was used to obtain critical information on the industry’s value chain, the total pool of key players, market classification, and segmentation from the market and technology-oriented perspectives.
Secondary Research
This research study involved the wide use of secondary sources, directories, and databases such as Dun & Bradstreet, Bloomberg Business, and Factiva; white papers, annual reports, and companies’ house documents; investor presentations; and the SEC filings of companies. The market for companies providing laboratory information management system solutions is assessed using secondary data from paid and free sources. This involves analyzing the product portfolios of major players in the industry and evaluating these companies based on their performance and quality. Various resources were utilized in the secondary research process to gather information for this study. The sources include annual reports, press releases, investor presentations, white papers, academic journals, certified publications, articles by recognized authors, directories, and databases.
The secondary research process involved referring to various secondary sources to identify and collect information related to the study. These sources included annual reports, press releases, investor presentations of laboratory information management system vendors, forums, certified publications, and whitepapers. The secondary research was used to obtain critical information on the industry’s value chain, the total pool of key players, market classification, and segmentation from the market and technology-oriented perspectives.
Primary Research
In the primary research process, various sources from both the supply and demand sides were interviewed to obtain qualitative and quantitative information for this report. Primary sources are mainly industry experts from the core and related industries and preferred suppliers, manufacturers, distributors, technology developers, researchers, and organizations related to all segments of this industry’s value chain. In-depth interviews were conducted with various primary respondents, including key industry participants, subject-matter experts (SMEs), C-level executives of key market players, and industry consultants, among other experts, to obtain and verify the critical qualitative and quantitative information as well as assess prospects. Primary research was conducted to identify segmentation types, industry trends, key players, and key market dynamics such as drivers, restraints, opportunities, challenges, industry trends, and strategies adopted by key players. After completing the market engineering process, which includes calculations for market statistics, market breakdown, size estimations, forecasting, and data triangulation, extensive primary research was conducted. This research aimed to gather information and verify the critical numbers obtained during the market analysis. Additionally, primary research was conducted to identify different types of market segmentation, analyze industry trends, evaluate the competitive landscape of laboratory information management systems offered by various players, and understand key market dynamics such as drivers, restraints, opportunities, challenges, industry trends, and strategies employed by key market participants. In the complete market engineering process, the top-down and bottom-up approaches and several data triangulation methods were extensively used to perform the market estimation and market forecasting for the overall market segments and subsegments listed in this report. Extensive qualitative and quantitative analysis was performed on the complete market engineering process to list the key information/insights throughout the report.
Breakdown of Primary Respondents:

Note 1: Other designations include sales, marketing, and product managers.
Note 2: Tiers are defined based on a company’s total revenue. As of 2023: Tier 1 = >USD 1 billion, Tier 2 = USD 500 million to USD 1 billion, and Tier 3 = < USD 500 million.
To know about the assumptions considered for the study, download the pdf brochure
Market Size Estimation
The market size estimates and forecasts provided in this study are derived through a mix of the bottom-up approach (revenue share analysis of leading players) and top-down approach (assessment of utilization/adoption/penetration trends, by type, component, application, end user, and region).

Data Triangulation
After arriving at the overall market size, using the market size estimation processes, the market was split into several segments and subsegments. To complete the overall market engineering process and arrive at the exact statistics of each market segment and subsegment, the data triangulation and market breakdown procedures were employed, wherever applicable. The data was triangulated by studying various factors and trends from the demand and supply sides in the LIMS market.
Market Definition
The Laboratory Information Management System (LIMS) market is a software-based solution designed to streamline and support the complex operations of modern laboratories. These systems provide comprehensive functionalities such as workflow management, data tracking, sample and inventory management, regulatory compliance, and data exchange interfaces.
Stakeholders
- Laboratory Information Management System Solution Providers
- Platform Providers
- Technology Providers
- System Integrators
- Pharmaceutical & Biotechnology Companies
- Process Industries
- Forums, Alliances, And Associations
- Distributors
- Venture Capitalists
- Government Organizations
- Institutional Investors and Investment Banks
- Investors/Shareholders
- Consulting Companies
- Raw Material and Component Manufacturers
Report Objectives
- To define, describe, and forecast the global LIMS market based on type, component, deployment mode, company size, industry, and region
- To provide detailed information regarding the factors influencing the growth of the market (such as the drivers, restraints, opportunities, and challenges)
- To strategically analyze micromarkets with respect to individual growth trends, prospects, and contributions to the overall LIMS market
- To analyze market opportunities for stakeholders and provide details of the competitive landscape for market leaders
- To forecast the size of the LIMS market in five main regions (along with their respective key countries): North America, Europe, the Asia Pacific, Latin America, and the Middle East & Africa
- To profile key players and comprehensively analyze their product portfolios, market positions, and core competencies in the market
- To track and analyze competitive developments such as product launches, expansions, partnerships, agreements, collaborations, and acquisitions in the LIMS market
- To benchmark players within the LIMS market using the Company Evaluation Matrix framework, which analyzes market players on various parameters within the broad categories of business strategy, market share, and product offering
Key Questions Addressed by the Report
Which are the top industry players in the Global Laboratory Information Management Systems (LIMS)?
The key market players in the global Laboratory Information Management Systems (LIMS) market include LabWare (US), LabVantage Solutions, Inc. (US), Thermo Fisher Scientific Inc. (US), Agilent Technologies, Inc. (US), LabLynx, Inc. (US), Dassault Systèmes (France), Labworks (US), Autoscribe Informatics (Xybion Corporation) (UK), STARLIMS Corporation (US), CloudLIMS (US), Siemens (Germany), Novatek International (Canada), Ovation (US), Clinsys, Inc. (US), BioData Inc (US), Illumina, Inc. (US), Eusoft Ltd. (UK), Labtrack (US), Caliber Technologies (US), and Confience (US).
Which components have been included in the Laboratory Information Management Systems (LIMS) market report?
This report contains the following components
- Software
- Services
- Support
Which geographical region dominates in the global Laboratory Information Management Systems (LIMS) market?
North America is expected to dominate the market during the forecast period.
Which industries have been included in the Laboratory Information Management Systems (LIMS) market report?
The report contains the following industry segments:
-
Life Sciences
- Pharmaceutical & Biotechnology Companies
- Biobanks & Biorepositories
- Contract Service Organizations
- Academic Research Institutes
- Clinical Research Laboratories
- Toxicology Laboratories
- NGS Laboratories
- Food & Beverage and Agriculture
- Petrochemicals and Oil & Gas
- Chemicals
- Environmental Testing
- Forensics
- Other Industries
What is the total CAGR expected to be recorded for the Laboratory Information Management Systems (LIMS) market during 2025-2030?
The CAGR is expected to record a CAGR of 12.5% from 2025 to 2030.
Need a Tailored Report?
Customize this report to your needs
Get 10% FREE Customization
Customize This ReportPersonalize This Research
- Triangulate with your Own Data
- Get Data as per your Format and Definition
- Gain a Deeper Dive on a Specific Application, Geography, Customer or Competitor
- Any level of Personalization
Let Us Help You
- What are the Known and Unknown Adjacencies Impacting the Laboratory Information Management System Market
- What will your New Revenue Sources be?
- Who will be your Top Customer; what will make them switch?
- Defend your Market Share or Win Competitors
- Get a Scorecard for Target Partners

Custom Market Research Services
We Will Customise The Research For You, In Case The Report Listed Above Does Not Meet With Your Requirements
Get 10% Free CustomisationTESTIMONIALS

JAYANT RAJPUROHIT
Director of Market Insights, Data and Analytics
SFI Health,
Leading Pharmaceutical Companywww.sfihealth.com/

We at SFI Health approached MarketsandMarkets for an Opportunity Assessment on "Incidence and Prevalence of Focus Indications" as we wanted to know the most attractive HCPs like Physician, Functional MD, Naturopath and Pharmacist. The project was critical for us to ensure our focus on the right target which would enable sustainable growth and profitability for SFI Health. The business insights provided exceeded our expectations and we were extremely impressed. The team at MarketsandMarkets is highly professional and detail oriented and very well understood our business needs. MarketsandMarkets offers a unique combination of expertise and dedicated engagement model. We identified 2 new products to be launched in coming months, based on the research findings provided by MarketsandMarkets. We are happy with the services and would strongly recommend MarketsandMarkets to my peers in the industry.

BEATRIZ DE LA CALLE
Head of Commercial Analytics
Qualicaps,
Leading Pharmaceutical Companywww.qualicaps.com/

We partnered with MarketsandMarkets for an assessment study on hard empty capsules. The team was extremely professional in understanding our business requirements and we received timely responses to all our queries. The market intelligence and the recommendations has met our business requirements. We were extremely impressed to see the final study results; it really exceeded our expectations. The market intelligence offered by MarketsandMarkets, and clarity on next steps will help us achieve our business objective for the Year 2021. We are happy with the services and would strongly recommend MarketsandMarkets to my peers in the industry.

Bob Williams,
Senior Director Business Development & Innovation
Bracco Diagnostics Inc.,
Italian Multinational in life sciences sector and a World Leader in imaging diagnosticsimaging.bracco.com/us-en
We were pleased with targeted insights that MarketsandMarkets identified from a custom study on the 'Radiation Dose Management Solutions Market'. Your team identified and characterized the market participants as well as underlying trends accurately. This study was useful to Bracco in formulating business strategies for our dose monitoring product lines and we thank MarketsandMarkets for the job well done.
Cody Coonradt,
Market Development and Strategy Manager
3M Health Information Systems,
Leader in Health care Coding, Payment & Analytics Solutions.www.3m.com/3M/en_US/health-information-systems-us
The value for our organization comes from three things: depth of research, specificity of segments and being easy to work with. As important as the first two are, the third can't be underestimated. MarketsandMarkets, maybe more than any other research vendor, wants to know what is top of mind for our team and what big questions we are grappling to answer.
Their customer first approach and high value engagement model, have given us great analysis and excellent value for money
Growth opportunities and latent adjacency in Laboratory Information Management System Market

Still Researching the
Laboratory Information Management System Ecosystem?
See the competitors, opportunities, and growth signals shaping it - instantly.
Generate 15+ consulting-grade strategic insights tailored to your growth question.


Jon
Aug, 2021
This is interesting to see how the LIMS industry breakdown throughout the world. Seeing its projected growth over the next few years is pretty cool as well. .