Pressure Labels Market by Type (Release Liner, Linerless), Composition (Facestock, Adhesives, Others), Printing technology (Digital Printing, Flexography, Others), & Mode of Application (Water-Based, Solvent-Based, Others) Global Forecast to 2020


[329 Pages Report] The pressure labels market size is estimated to grow from USD 74.14 Billion in 2015 to USD 92.46 Billion by 2020, at a CAGR of 4.52%. The pressure labels market is growing rapidly in accordance with the growth in the packaging market globally. The use of pressure labels such as release liners and liner-less labels are used in the food & beverage industry. This application is projected to foster the demand for pressure labels during the forecast period. The report aims at estimating the market size and future growth potential of the pressure labels market across different segments such as type, composition, printing technology, mode of application, end-use industry, and region. The base year considered for the study is 2014 and the market size is projected from 2015 to 2020. Factors such as growing demand in Asia-Pacific, growth in the pharmaceutical sector, and wide application in diverse industries are the major drivers of the pressure labels market in the next five years.
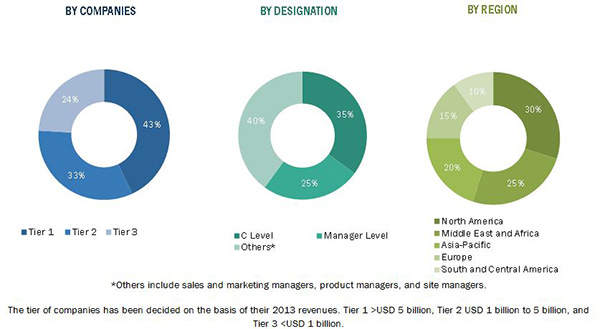
The research methodology used to estimate and forecast the pressure labels market begins with capturing data on key vendor revenues through secondary research. The vendor offerings are also taken into consideration to determine the market segmentation. The bottom-up procedure was employed to arrive at the overall market size of the global pressure labels market from the revenue of the key players in the market. After arriving at the overall market size, the total market was split into several segments and subsegments, which are then verified through primary research by conducting extensive interviews with key people such as CEOs, VPs, directors, and executives. These data triangulation and market breakdown procedures were employed to complete the overall market engineering process and arrive at the exact statistics for all segments and subsegments. The breakdown of profiles of primary is depicted in the following figure:
The pressure labels ecosystem comprises companies such as Avery Dennison Corporation (U.S.), CCL Industries Inc. (Canada), Constantia Flexibles (Austria), UPM (Finland), and 3M (U.S.). The other players in the market are Henkel AG & Co. KGaA (Germany), Mondi Group (South Africa), Coveris Holdings S.A. (U.S.), H.B Fuller (U.S.), and Torraspapel Adestor (Spain).
The market ecosystem includes various stakeholders involved in the supply chain of the pressure labels industry. First are the raw material suppliers who provide the required raw materials to the manufacturing companies. This is followed by research & development as the consumers want better and innovative solutions which are more sustainable and environment-friendly. The next level in the chain involves the manufacturing and the assembly team. This is taken care of by the manufacturers. Post this, the marketing and sales of the finished products take place which is only possible if an efficient distribution channel is developed. Finally, the end-products are made available to the consumers. Thus, this supply chain which involves various stakeholders explains the market ecosystem of the pressure labels industry.
Target audience
- OEM companies
- Packaging manufacturers
- Raw material suppliers
- Consulting firms
Scope of the Report
The research report segments the pressure labels market into the following submarkets:
By Type:
- Release liner labels
- Linerless labels
By Composition:
- Facestock
- Adhesives
- Others (topcoat)
By Printing Technology:
- Digital Printing
- Flexography
- Lithography
- Screen Printing
- Gravure
- Letterpress
- Offset
By mode of Application:
- Water based
- Solvent based
- Hot-melt based
- Radiation based
By End-User Industry:
- Food & Beverages
- Consumer Durables
- Pharmaceutical
- Home & Personal Care
- Retail Labels
- Others (labels used on apparels & textiles, industrial lubricant & paints, and gifts)
By Region:
- North America
- Europe
- Asia-Pacific
- RoW
Available Customizations
With the given market data, MarketsandMarkets offers customizations according to client-specific needs. The following customization options are available for the report:
Product Analysis
- Product Matrix, which gives a detailed comparison of product portfolio of each company
Geographic Analysis
- Further breakdown of the Asia-Pacific Pressure Labels Market
- Further breakdown of the European Pressure Labels Market
- Further breakdown of the North American Pressure Labels Market
- Further breakdown of the RoW Pressure Labels Market
Company Information
- Detailed analysis and profiling of additional market players
MarketsandMarkets projects that the pressure labels market size will grow from USD 74.14 Billion in 2015 to USD 92.46 Billion by 2020, at an estimated CAGR of 4.52%. The technological advancements and industrialization combined with an increasing population in developing economies and increasing demand by various end-user industries such as food & beverage, consumer durables, pharmaceutical and home & personal care are the major factors driving the growth of the pressure labels industry. Additionally, with rapid urbanization and growth in industrialization and medical sector across the globe, there is a rapidly increasing need for pressure labels. Pressure labels are a wide and diverse group of products developed for application in specific end-use industries. Food & beverages is projected to have the largest market share and dominate the pressure labels market from 2015 to 2020. Retail labels are to play a key role in changing the pressure labels landscape and grow at a high rate during the forecast period.
Linerless labels are projected to form the fastest-growing type in the pressure labels market as it helps to reduce waste and is a sustainable solution. Also, it is being used in many end-use industries. The release liner labels are projected to account for the largest market share in the pressure labels market.
The market share of facestock is the largest as per composition. This is closely followed by adhesives which has a relatively higher growth rate. Technological advancements have led to adhesives being widely used for various purposes.
In the space of printing technology, there are several printing technologies available in the market such as digital printing, flexography, lithography, screen printing, gravure, letterpress, and offset. The market for digital printing is set to have the largest share with the highest growth rate due to the technological advantages of digital printing.
There are various modes of applications available in the pressure labels market such as water-based pressure labels, solvent-based pressure labels, hot-melt-based pressure labels, and radiation-based pressure labels. Though the radiation-based pressure labels is set to see a higher growth, the water-based pressure labels hold the largest market share due to its affordability and usability.
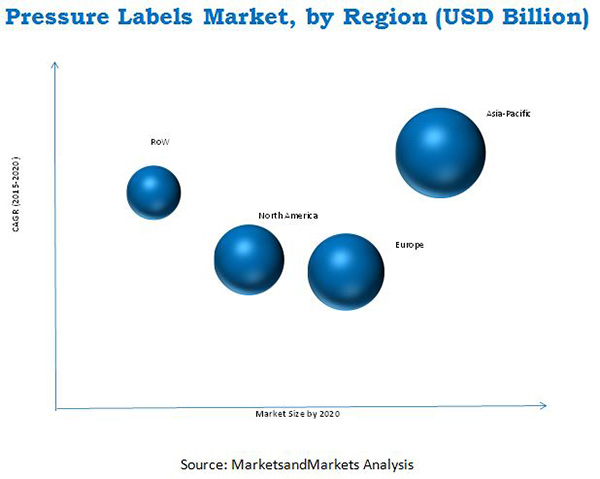
Asia-Pacific is projected to have the largest market share and dominate the pressure labels market from 2015 to 2020. Asia-Pacific offers potential growth opportunities, as developing countries such as China and India are projected to be emerging markets, making the Asia-Pacific region also the fastest-growing market for pressure labels. The growth of the pressure labels market in this region is propelled by factors such as the growth of the food & beverage, pharmaceutical, consumer durables, and home & personal care industry. Also the growing population and economic development are other factors.
However, due to high cost of setting up a plant and need for continuous technological advancements and research & development, the organizations are exposed to potential risks and are restraining the growth of the pressure labels market. The major vendors in the pressure labels market include players such as Avery Dennison Corporation (U.S.), CCL Industries Inc. (Canada), Constantia Flexibles (Austria), UPM (Finland), and 3M (U.S.). The other players in the market are Henkel AG & Co. KGaA (Germany), Mondi Group (South Africa), Coveris Holdings S.A. (U.S.), H.B Fuller (U.S.), and Torraspapel Adestor (Spain).
These players adopted various strategies such as expansions, agreements, acquisitions, and new product developments & joint ventures to cater to the needs of the pressure labels market.
 Exclusive indicates content/data unique to MarketsandMarkets and not available with any competitors.
Table of Contents
1 Introduction (Page No. - 25)
1.1 Objectives of the Study
1.2 Market Definition
1.3 Market Scope
1.3.1 Markets Covered
1.3.2 Periodization Considered for the Pressure Labels Market
1.4 Currency Considered for the Pressure Labels Market
1.5 Unit Considered for the Pressure Labels Market
1.6 Stakeholders
1.7 Limitations
2 Research Methodology (Page No. - 28)
2.1 Research Data
2.1.1 Secondary Data
2.1.2 Key Data From Secondary Sources
2.1.3 Primary Data
2.1.4 Breakdown of Primary Interviews
2.2 Market Size Estimation
2.3 Market Breakdown and Data Triangulation
2.4 Market Share Estimation
2.5 Research Assumptions and Limitations
2.5.1 Assumptions
2.5.2 Assumptions Made for This Study
2.5.2.1 Limitations
3 Executive Summary (Page No. - 36)
4 Premium Insights (Page No. - 40)
4.1 Attractive Opportunities in the Pressure Labels Market
4.2 Pressure Labels Market in the Asia-Pacific Region
4.3 Leading Countries in the Pressure Labels Market, 2014
4.4 Pressure Labels Market: Technology Used
4.5 Pressure Labels Market: By Composition, 2014
4.6 Pressure Labels Market: By Type, Between 2015 & 2020
5 Market Overview (Page No. - 45)
5.1 Introduction
5.2 Evolution
5.3 Market Segmentation
5.4 Market Dynamics
5.4.1 Drivers
5.4.1.1 Growth in Pharmaceuticals Industry
5.4.1.2 Wide Application in Diverse Industries
5.4.2 Restraints
5.4.2.1 Rising Raw Material Prices
5.4.2.2 Advantages of Wet-Glue Labels Over Pressure Labels
5.4.3 Opportunities
5.4.3.1 Emergence of New Products
5.4.3.2 Growing Demand in Asia-Pacific
5.4.4 Challenges
5.4.4.1 Varying Environmental Mandates Across Regions
5.4.4.2 Cost-To-Benefit Ratio A Concern to Small Manufacturers
5.4.4.3 High Research & Development Investment
6 Industry Trends (Page No. - 55)
6.1 Introduction
6.2 Supply Chain
6.3 Porter�s Five Forces Analysis
6.3.1 Bargaining Power of Suppliers
6.3.2 Bargaining Power of Buyers
6.3.3 Threat of New Entrants
6.3.4 Threat of Substitutes
6.3.5 Intensity of Competitive Rivalry
7 Pressure Labels Market, By Type (Page No. - 60)
7.1 Introduction
7.1.1 Pressure Labels Market, By Type
7.1.1.1 Release Liner Labels Dominated the Market in 2014
7.2 Release Liner Labels
7.3 Linerless Labels
8 Pressure Labels Market, By Composition (Page No. - 63)
8.1 Introduction
8.1.1 Pressure Labels Market, By Composition
8.1.1.1 Facestock Dominated the Pressure Labels Market in 2014
8.2 Facestock
8.3 Adhesives
8.4 Others
9 Pressure Labels Market, By Printing Technology (Page No. - 67)
9.1 Introduction
9.1.1 Pressure Labels Market, By Printing Technology
9.1.1.1 Digital Printing is Projected to Be the Fastest-Growing Segment in the Market
9.2 Digital Printing
9.3 Flexography
9.4 Lithography
9.5 Screen Printing
9.6 Gravure
9.7 Letterpress
9.8 Offset
10 Pressure Labels Market, By Mode of Application (Page No. - 73)
10.1 Introduction
10.1.1 Pressure Labels Market, By Mode of Application
10.1.1.1 Radiation-Based Pressure Labels Projected to Be the Fastest-Growing Segment in the Market
10.2 Water-Based Pressure Labels
10.3 Solvent-Based Pressure Labels
10.4 Hot Melt-Based Pressure Labels
10.5 Radiation-Based Pressure Labels
11 Pressure Labels Market, By End-User Industry (Page No. - 78)
11.1 Introduction
11.1.1 Pressure Labels Market, By End-User Industry
11.1.1.1 Food & Beverages Segment is Projected to Account for the Largest Market Share By 2020
11.2 Food & Beverages
11.3 Consumer Durables
11.4 Pharmaceuticals
11.5 Home & Personal Care
11.6 Retail
11.7 Others
12 Pressure Labels Market, By Region (Page No. - 83)
12.1 Introduction
12.2 Asia-Pacific
12.2.1 Asia-Pacific: Pressure Labels Market, By Country
12.2.1.1 China Dominated the Pressure Labels Market in Asia-Pacific
12.2.2 Asia-Pacific: Pressure Labels Market, By Type
12.2.2.1 Release Liner Labels Accounted for the Largest Share in Pressure Labels Market in Asia-Pacific
12.2.3 Asia-Pacific: Pressure Labels Market, By Composition
12.2.3.1 Facestock Segment Accounted for the Largest Share in Asia-Pacific
12.2.4 Asia-Pacific: Pressure Labels Market, By Printing Technology
12.2.4.1 Digital Printing to Drive the Asia-Pacific Market
12.2.5 Asia-Pacific: Pressure Labels Market, By Mode of Application
12.2.5.1 Demand for Water-Based Pressure Labels to Drive the Asia-Pacific Market
12.2.6 Asia-Pacific: Pressure Labels Market, By End-User Industry
12.2.6.1 Retail Segment Projected to Grow the Fastest in the Asia-Pacific Pressure Labels Market
12.2.7 China
12.2.8 China: Pressure Labels Market, By Type
12.2.8.1 Release Liner Labels Segment Accounted for the Largest Share in Pressure Labels Market in China
12.2.9 China: Pressure Labels Market, By Composition
12.2.9.1 Facestock Segment Accounted for the Largest Share in China
12.2.10 China: Pressure Labels Market, By Printing Technology
12.2.10.1 Digital Printing to Drive the Chinese Market
12.2.11 China: Pressure Labels Market, By Mode of Application
12.2.11.1 Demand for Water-Based Pressure Labels to Drive the China Market
12.2.12 China: Pressure Labels Market, By End-User Industry
12.2.12.1 Retail Segment Projected to Grow the Fastest in the Chinese Pressure Labels Market
12.2.13 Japan
12.2.14 Japan: Pressure Labels Market, By Type
12.2.14.1 Release Liner Labels Segment Accounted for the Largest Share in Pressure Labels Market in Japan
12.2.15 Japan: Pressure Labels Market, By Composition
12.2.15.1 Facestock Segment Accounted for the Largest Share in Japan
12.2.16 Japan: Pressure Labels Market, By Printing Technology
12.2.16.1 Digital Printing to Drive the Japanese Market
12.2.16.2 Demand for Solvent-Based Pressure Labels to Drive the Japanese Market
12.2.17 Japan: Pressure Labels Market, By End-User Industry
12.2.17.1 Retail Segment Projected to Grow the Fastest in the Japanese Pressure Labels Market
12.2.18 India
12.2.19 India: Pressure Labels Market, By Type
12.2.19.1 Release Liner Labels Segment Accounted for the Largest Share in Pressure Labels Market in India
12.2.20 India: Pressure Labels Market, By Composition
12.2.20.1 Facestock Segment Accounted for the Largest Share in India
12.2.21 India: Pressure Labels Market, By Printing Technology
12.2.21.1 Digital Printing to Drive the Indian Market
12.2.22 India: Pressure Labels Market, By Mode of Application
12.2.22.1 Demand for Water-Based Pressure Labels to Drive the Indian Market
12.2.23 India: Pressure Labels Market, By End-User Industry
12.2.23.1 Retail Segment Projected to Grow the Fastest in the Indian Pressure Labels Market
12.2.24 Rest of Asia-Pacific
12.2.25 Rest of Asia-Pacific: Pressure Labels Market, By Type
12.2.25.1 Release Liner Labels Segment Accounted for the Largest Share in Pressure Labels Market in Rest of Asia-Pacific
12.2.26 Rest of Asia-Pacific: Pressure Labels Market, By Composition
12.2.26.1 Facestock Segment Accounted for the Largest Share in Rest of Asia-Pacific
12.2.27 Rest of Asia-Pacific: Pressure Labels Market, By Printing Technology
12.2.27.1 Digital Printing to Drive the Rest of Asia-Pacific Market
12.2.28 Rest of Asia-Pacific: Pressure Labels Market, By Mode of Application
12.2.28.1 Demand for Hot Melt-Based Pressure Labels to Drive the Rest of Asia-Pacific Market
12.2.29 Rest of Asia-Pacific: Pressure Labels Market, By End-User Industry
12.2.29.1 Food & Beverages Segment Projected to Grow the Fastest in the Rest of Asia-Pacific Pressure Labels Market
12.3 Europe
12.3.1 Europe: Pressure Labels Market, By Country
12.3.2 Europe: Pressure Labels Market, By Type
12.3.2.1 Release Liner Labels Segment Accounted for the Largest Share in Pressure Labels Market in Europe
12.3.3 Europe: Pressure Labels Market, By Composition
12.3.3.1 Facestock Segment Accounted for the Largest Share in Europe
12.3.4 Europe: Pressure Labels Market, By Printing Technology
12.3.4.1 Digital Printing to Drive the European Market
12.3.5 Europe: Pressure Labels Market, By Mode of Application
12.3.5.1 Demand for Water-Based to Drive the European Market
12.3.6 Europe: Pressure Labels Market, By End-User Industry
12.3.6.1 Food & Beverages Segment Dominated the European Pressure Labels Market
12.3.7 Germany
12.3.8 Germany: Pressure Labels Market, By Type
12.3.8.1 Release Liner Labels Segment Accounted for the Largest Share in Pressure Labels Market in Germany
12.3.9 Germany: Pressure Labels Market, By Composition
12.3.9.1 Facestock Segment Accounted for the Largest Share in Germany
12.3.10 Germany: Pressure Labels Market, By Printing Technology
12.3.10.1 Digital Printing to Drive the German Market
12.3.11 Germany: Pressure Labels Market, By Mode of Application
12.3.11.1 Demand for Hot Melt-Based Pressure Labels to Drive the German Market
12.3.12 Germany: Pressure Labels Market, By End-User Industry
12.3.12.1 Food & Beverages Dominated the German Pressure Labels Market
12.3.13 France
12.3.14 France: Pressure Labels Market, By Type
12.3.14.1 Release Liner Labels Segment Accounted for the Largest Share in Pressure Labels Market in France
12.3.15 France: Pressure Labels Market, By Composition
12.3.15.1 Facestock Segment Accounted for the Largest Share in France
12.3.16 France: Pressure Labels Market, By Printing Technology
12.3.16.1 Digital Printing to Drive the French Market
12.3.17 France: Pressure Labels Market, By Mode of Application
12.3.17.1 Demand for Water-Based Pressure Labels to Drive the French Market
12.3.18 France: Pressure Labels Market, By End-User Industry
12.3.18.1 Food & Beverages Dominated the French Pressure Labels Market
12.3.19 U.K.
12.3.20 U.K.: Pressure Labels Market, By Type
12.3.20.1 Release Liner Labels Segment Accounted for the Largest Share in Pressure Labels Market in the U.K.
12.3.21 U.K.: Pressure Labels Market, By Composition
12.3.21.1 Facestock Segment Accounted for the Largest Share in the U.K.
12.3.22 U.K.: Pressure Labels Market, By Printing Technology
12.3.22.1 Digital Printing to Drive the U.K. Market
12.3.23 U.K.: Pressure Labels Market, By Mode of Application
12.3.23.1 Demand for Water-Based Pressure Labels to Drive the U.K. Market
12.3.24 U.K.: Pressure Labels Market, By End-User Industry
12.3.24.1 Food & Beverages Segment Dominated the U.K. Pressure Labels Market
12.3.25 Rest of Europe
12.3.26 Rest of Europe: Pressure Labels Market, By Type
12.3.26.1 Release Liner Labels Accounted for the Largest Share in Pressure Labels Market in Rest of Europe
12.3.27 Rest of Europe: Pressure Labels Market, By Composition
12.3.27.1 Market for Adhesives Accounted for the Largest Share in Rest of Europe
12.3.28 Rest of Europe: Pressure Labels Market, By Printing Technology
12.3.28.1 Flexography Segment to Drive the Rest of Europe Market
12.3.29 Rest of Europe: Pressure Labels Market, By Mode of Application
12.3.29.1 Demand for Solvent-Based Pressure Labels to Drive the Rest of Europe Market
12.3.30 Rest of Europe: Pressure Labels Market, By End-User Industry
12.3.30.1 Food & Beverages Dominated the Rest of Europe Pressure Labels Market
12.4 North America
12.4.1 North America: Pressure Labels Market, By Country
12.4.2 North America: Pressure Labels Market, By Type
12.4.2.1 Market for Release Liner Labels Accounted for the Largest Share in Pressure Labels Market in North America
12.4.3 North America: Pressure Labels Market, By Composition
12.4.3.1 Market for Facestock Accounted for the Largest Share in North America
12.4.4 North America: Pressure Labels Market, By Printing Technology
12.4.4.1 Digital Printing to Drive the North American Market
12.4.5 North America: Pressure Labels Market, By Mode of Application
12.4.5.1 Demand for Water-Based Pressure Labels to Drive the North American Market
12.4.6 North America: Pressure Labels Market, By End-User Industry
12.4.6.1 Food & Beverages Dominated the North American Pressure Labels Market
12.4.7 U.S.
12.4.8 U.S.: Pressure Labels Market, By Type
12.4.8.1 Market for Release Liner Labels Accounted for the Largest Share in Pressure Labels Market in U.S.
12.4.9 U.S.: Pressure Labels Market, By Composition
12.4.9.1 Market for Facestock Accounted for the Largest Share in U.S.
12.4.10 U.S.: Pressure Labels Market, By Printing Technology
12.4.10.1 Digital Printing to Drive the U.S. Market
12.4.11 U.S.: Pressure Labels Market, By Mode of Application
12.4.11.1 Demand for Water-Based Pressure Labels to Drive the U.S. Market
12.4.12 U.S.: Pressure Labels Market, By End-User Industry
12.4.12.1 Food & Beverages Dominated the U.S. Pressure Labels Market
12.4.13 Canada
12.4.14 Canada: Pressure Labels Market, By Type
12.4.14.1 Market for Release Liner Labels Accounted for the Largest Share in Pressure Labels Market in Canada
12.4.15 Canada: Pressure Labels Market, By Composition
12.4.15.1 Market for Facestock Accounted for the Largest Share in Canada
12.4.16 Canada: Pressure Labels Market, By Printing Technology
12.4.16.1 Digital Printing to Drive the Canadian Market
12.4.17 Canada: Pressure Labels Market, By Mode of Application
12.4.17.1 Demand for Water-Based Pressure Labels to Drive the Canadian Market
12.4.18 Canada: Pressure Labels Market, By End-User Industry
12.4.18.1 Food & Beverages Dominated the Canadian Pressure Labels Market
12.4.19 Mexico
12.4.20 Mexico: Pressure Labels Market, By Type
12.4.20.1 Market for Release Liner Labels Accounted for the Largest Share in Pressure Labels Market in Mexico
12.4.21 Mexico: Pressure Labels Market, By Composition
12.4.21.1 Market for Facestock Accounted for the Largest Share in Mexico
12.4.22 Mexico: Pressure Labels Market, By Printing Technology
12.4.22.1 Digital Printing to Drive the Mexican Market
12.4.23 Mexico: Pressure Labels Market, By Mode of Application
12.4.23.1 Demand for Water-Based Pressure Labels to Drive the Mexican Market
12.4.24 Mexico: Pressure Labels Market, By End-User Industry
12.4.24.1 Food & Beverages Dominated the Mexican Pressure Labels Market
12.5 Rest of the World (RoW)
12.5.1 Rest of the World: Pressure Labels Market, By Country
12.5.1.1 Brazil Dominated the Pressure Labels Market in Rest of the World
12.5.2 Rest of the World: Pressure Labels Market, By Type
12.5.2.1 Market for Release Liner Labels Accounted for the Largest Share in Pressure Labels Market in Rest of the World
12.5.3 Rest of the World: Pressure Labels Market, By Composition
12.5.3.1 Market for Facestock Accounted for the Largest Share in Rest of the World
12.5.4 Rest of the World: Pressure Labels Market, By Printing Technology
12.5.4.1 Digital Printing to Drive the Rest of the World Market
12.5.5 Rest of the World: Pressure Labels Market, By Mode of Application
12.5.5.1 Demand for Water-Based Pressure Labels to Drive the Rest of the World Market
12.5.6 Rest of the World: Pressure Labels Market, By End-User Industry
12.5.6.1 Food & Beverages Projected to Grow at the Highest Rate in the Rest of the World Market
12.5.7 Brazil
12.5.8 Brazil: Pressure Labels Market, By Type
12.5.8.1 Market for Release Liner Labels Accounted for the Largest Share in Pressure Labels Market in Brazil
12.5.9 Brazil: Pressure Labels Market, By Composition
12.5.9.1 Market for Facestock Accounted for the Largest Share in Brazil
12.5.10 Brazil: Pressure Labels Market, By Printing Technology
12.5.10.1 Digital Printing to Drive the Brazilian Market
12.5.11 Brazil: Pressure Labels Market, By Mode of Application
12.5.11.1 Demand for Water-Based Pressure Labels to Drive the Brazilian Market
12.5.12 Brazil: Pressure Labels Market, By End-User Industry
12.5.12.1 Retail Labels are Projected to Grow at the Highest Rate in the Brazilian Pressure Labels Market
12.5.13 Argentina
12.5.14 Argentina: Pressure Labels Market, By Type
12.5.14.1 Market for Release Liner Labels Accounted for the Largest Share in Pressure Labels Market in Argentina
12.5.15 Argentina: Pressure Labels Market, By Composition
12.5.15.1 Market for Facestock Accounted for the Largest Share in Argentina
12.5.16 Argentina: Pressure Labels Market, By Printing Technology
12.5.16.1 Digital Printing to Drive the Argentinean Market
12.5.17 Argentina: Pressure Labels Market, By Mode of Application
12.5.17.1 Demand for Water-Based Pressure Labels to Drive the Argentinean Market
12.5.18 Argentina: Pressure Labels Market, By End-User Industry
12.5.18.1 Retail Labels are Projected to Grow at the Highest Rate in the Argentinean Pressure Labels Market
12.5.19 South Africa
12.5.20 South Africa: Pressure Labels Market, By Type
12.5.20.1 Market for Release Liner Labels Accounted for the Largest Share in Pressure Labels Market in South Africa
12.5.21 South Africa: Pressure Labels Market, By Composition
12.5.21.1 Market for Facestock Accounted for the Largest Share in South Africa
12.5.22 South Africa: Pressure Labels Market, By Printing Technology
12.5.22.1 Digital Printing to Drive the South African Market
12.5.23 South Africa: Pressure Labels Market, By Mode of Application
12.5.23.1 Demand for Water-Based Pressure Labels to Drive the South African Market
12.5.24 South Africa: Pressure Labels Market, By End-User Industry
12.5.24.1 Retail Labels are Projected to Grow at the Highest Rate in the South African Pressure Labels Market
12.5.25 Others in RoW
12.5.26 Others in RoW: Pressure Labels Market, By Type
12.5.26.1 Market for Release Liner Labels Accounted for the Largest Share in Pressure Labels Market in Others in RoW
12.5.27 Others in RoW: Pressure Labels Market, By Composition
12.5.27.1 Market for Facestock Accounted for the Largest Share in Others in RoW
12.5.28 Others in RoW: Pressure Labels Market, By Printing Technology
12.5.28.1 Digital Printing to Drive the Others in RoW Market
12.5.29 Others in RoW: Pressure Labels Market, By Mode of Application
12.5.29.1 Demand for Water-Based Pressure Labels to Drive the Others in RoW Market
12.5.30 Others in RoW: Pressure Labels Market, By End-User Industry
12.5.30.1 Retail Labels are Projected to Grow at the Highest Rate in the Others in RoW Pressure Labels Market
13 Competitive Landscape (Page No. - 191)
13.1 Introduction
13.2 Competitive Situations & Trends
13.2.1 Acquisitions
13.2.2 New Product Developments
13.2.3 Expansions, Investments & Divestments
13.2.4 AGreements
14 Company Profiles (Page No. - 197)
(Company at A Glance, Business Overview, Products Offered, Key Strategy, Recent Developments, SWOT Analysis & MnM View)*
14.1 Introduction
14.2 Avery Dennison Corporation
14.3 CCL Industries Inc.
14.4 Constantia Flexibles Group GmbH
14.5 UPM-Kymmene OYJ
14.6 The 3M Company
14.7 Henkel AG & Co. KGAA
14.8 Mondi PLC
14.9 Coveris Holdings S.A.
14.10 H.B. Fuller
14.11 Torraspapel Adestor
*Details on Company at A Glance, Recent Financials, Products Offered, Strategies & Insights, & Recent Developments Might Not Be Captured in Case of Unlisted Companies.
15 Appendix (Page No. - 225)
15.1 Discussion Guide
15.2 Knowledge Store: Marketsandmarkets� Subscription Portal
15.3 Introducing RT: Real-Time Market Intelligence
15.4 Available Customizations
List of Tables (214 Tables)
Table 1 Pressure Labels Market Size, By Type, 2013�2020 (USD Million)
Table 2 Pressure Labels Market Size, By Type,2013�2020 (Million Square Meters)
Table 3 Pressure Labels Market Size, By Composition, 2013�2020 (USD Million)
Table 4 Pressure Labels Market Size, By Composition,2013�2020 (Million Square Meters)
Table 5 Pressure Labels Market Size, By Printing Technology,2013�2020 (USD Million)
Table 6 Pressure Labels Market Size, By Printing Technology,2013�2020 (Million Square Meters)
Table 7 Pressure Labels Market Size, By Mode of Application,2013�2020 (USD Million)
Table 8 Pressure Labels Market Size, By Mode of Application,2013�2020 (Million Square Meters)
Table 9 Pressure Labels Market Size, By End-User Industry,2013�2020 (USD Million)
Table 10 Pressure Labels Market Size, By End-User Industry,2013�2020 (Million Square Meters)
Table 11 Pressure Labels Market Size, By Region, 2013�2020 (USD Million)
Table 12 Pressure Labels Market Size, By Region,2013�2020 (Million Square Meters)
Table 13 Asia-Pacific: Pressure Labels Market Size, By Country,2013�2020 (USD Million)
Table 14 Asia-Pacific: Pressure Labels Market Size, By Country,2013�2020 (Million Square Meters)
Table 15 Asia-Pacific: Pressure Labels Market Size, By Type,2013�2020 (USD Million)
Table 16 Asia-Pacific: Pressure Labels Market Size, By Type,2013�2020 (Million Square Meters)
Table 17 Asia-Pacific: Pressure Labels Market Size, By Composition,2013�2020 (USD Million)
Table 18 Asia-Pacific: Pressure Labels Market Size, By Composition,2013�2020 (Million Square Meters)
Table 19 Asia-Pacific: Pressure Labels Market Size, By Printing Technology,2013�2020 (USD Million)
Table 20 Asia-Pacific: Pressure Labels Market Size, By Printing Technology,2013�2020 (Million Square Meters)
Table 21 Asia-Pacific: Pressure Labels Market Size, By Mode of Application,2013�2020 (USD Million)
Table 22 Asia-Pacific: Pressure Labels Market Size, By Mode of Application,2013�2020 (Million Square Meters)
Table 23 Asia-Pacific: Pressure Labels Market Size, By End-User Industry,2013�2020 (USD Million)
Table 24 Asia-Pacific: Pressure Labels Market Size, By End-User Industry,2013�2020 (Million Square Meters)
Table 25 China: Pressure Labels Market Size, By Type, 2013�2020 (USD Million)
Table 26 China: Pressure Labels Market Size, By Type,2013�2020 (Million Square Meters)
Table 27 China: Pressure Labels Market Size, By Composition,2013�2020 (USD Million)
Table 28 China: Pressure Labels Market Size, By Composition,2013�2020 (Million Square Meters)
Table 29 China: Pressure Labels Market Size, By Printing Technology,2013�2020 (USD Million)
Table 30 China: Pressure Labels Market Size, By Printing Technology,2013�2020 (Million Square Meters)
Table 31 China: Pressure Labels Market Size, By Mode of Application,2013�2020 (USD Million)
Table 32 China: Pressure Labels Market Size, By Mode of Application,2013�2020 (Million Square Meters)
Table 33 China: Pressure Labels Market Size, By End-User Industry,2013�2020 (USD Million)
Table 34 China: Pressure Labels Market Size, By End-User Industry,2013�2020 (Million Square Meters)
Table 35 Japan: Pressure Labels Market Size, By Type, 2013�2020 (USD Million)
Table 36 Japan: Pressure Labels Market Size, By Type,2013�2020 (Million Square Meters)
Table 37 Japan: Pressure Labels Market Size, By Composition,2013�2020 (USD Million)
Table 38 Japan: Pressure Labels Market Size, By Composition,2013�2020 (Million Square Meters)
Table 39 Japan: Pressure Labels Market Size, By Printing Technology,2013�2020 (USD Million)
Table 40 Japan: Pressure Labels Market Size, By Printing Technology,2013�2020 (Million Square Meters)
Table 41 Japan: Pressure Labels Market Size, By Mode of Application,2013�2020 (USD Million)
Table 42 Japan: Pressure Labels Market Size, By Mode of Application, 2013�2020 (Million Square Meters)
Table 43 Japan: Pressure Labels Market Size, By End-User Industry, 2013�2020 (USD Million)
Table 44 Japan: Pressure Labels Market Size, By End-User Industry, 2013�2020 (Million Square Meters)
Table 45 India: Pressure Labels Market Size, By Type, 2013�2020 (USD Million)
Table 46 India: By Market Size, By Type, 2013�2020 (Million Square Meters)
Table 47 India: By Market Size, By Composition, 2013�2020 (USD Million)
Table 48 India: By Market Size, By Composition, 2013�2020 (Million Square Meters)
Table 49 India: By Market Size, By Printing Technology, 2013�2020 (USD Million)
Table 50 India: By Market Size, By Printing Technology, 2013�2020 (Million Square Meters)
Table 51 India: By Market Size, By Mode of Application, 2013�2020 (USD Million)
Table 52 India: By Market Size, By Mode of Application, 2013�2020 (Million Square Meters)
Table 53 India: By Market Size, By End-User Industry, 2013�2020 (USD Million)
Table 54 India: By Market Size, By End-User Industry, 2013�2020 (Million Square Meters)
Table 55 Rest of Asia-Pacific: Pressure Labels Market Size, By Type, 2013�2020 (USD Million)
Table 56 Rest of Asia-Pacific: By Market Size, By Type, 2013�2020 (Million Square Meters)
Table 57 Rest of Asia-Pacific: By Market Size, By Composition, 2013�2020 (USD Million)
Table 58 Rest of Asia-Pacific: By Market Size, By Composition, 2013�2020 (Million Square Meters)
Table 59 Rest of Asia-Pacific: By Market Size, By Printing Technology, 2013�2020 (USD Million)
Table 60 Rest of Asia-Pacific: By Market Size, By Printing Technology, 2013�2020 (Million Square Meters)
Table 61 Rest of Asia-Pacific: By Market Size, By Mode of Application, 2013�2020 (USD Million)
Table 62 Rest of Asia-Pacific: By Market Size, By Mode of Application, 2013�2020 (Million Square Meters)
Table 63 Rest of Asia-Pacific: By Market Size, By End-User Industry, 2013�2020 (USD Million)
Table 64 Rest of Asia-Pacific: By Market Size, By End-User Industry, 2013�2020 (Million Square Meters)
Table 65 Europe: Pressure Labels Market Size, By Country, 2013�2020 (USD Million)
Table 66 Europe: By Market Size, By Country, 2013�2020 (Million Square Meters)
Table 67 Europe: By Market Size, By Type, 2013�2020 (USD Million)
Table 68 Europe: By Market Size, By Type, 2013�2020 (Million Square Meters)
Table 69 Europe: By Market Size, By Composition, 2013�2020 (USD Million)
Table 70 Europe: By Market Size, By Composition, 2013�2020 (Million Square Meters)
Table 71 Europe: By Market Size, By Printing Technology, 2013�2020 (USD Million)
Table 72 Europe: By Market Size, By Printing Technology, 2013�2020 (Million Square Meters)
Table 73 Europe: By Market Size, By Mode of Application, 2013�2020 (USD Million)
Table 74 Europe: By Market Size, By Mode of Application, 2013�2020 (Million Square Meters)
Table 75 Europe: By Market Size, By End-User Industry, 2013�2020 (USD Millions)
Table 76 Europe: By Market Size, By End-User Industry, 2013�2020 (Million Square Meters)
Table 77 Germany: Pressure Labels Market Size, By Type, 2013�2020 (USD Million)
Table 78 Germany: By Market Size, By Type, 2013�2020 (Million Square Meters)
Table 79 Germany: By Market Size, By Composition, 2013�2020 (USD Million)
Table 80 Germany: By Market Size, By Composition, 2013�2020 (Million Square Meters)
Table 81 Germany: By Market Size, By Printing Technology, 2013�2020 (USD Million)
Table 82 Germany: By Market Size, By Printing Technology, 2013�2020 (Million Square Meters)
Table 83 Germany: By Market Size, By Mode of Application, 2013�2020 (USD Million)
Table 84 Germany: By Market Size, By Mode of Application, 2013�2020 (Million Square Meters)
Table 85 Germany: By Market Size, By End-User Industry, 2013�2020 (USD Millions)
Table 86 Germany: By Market Size, By End-User Industry, 2013�2020 (Million Square Meters)
Table 87 France: Pressure Labels Market Size, By Type, 2013�2020 (USD Million)
Table 88 France: By Market Size, By Type, 2013�2020 (Million Square Meters)
Table 89 France: By Market Size, By Composition, 2013�2020 (USD Million)
Table 90 France: By Market Size, By Composition, 2013�2020 (Million Square Meters)
Table 91 France: By Market Size, By Printing Technology, 2013�2020 (USD Million)
Table 92 France: By Market Size, By Printing Technology, 2013�2020 (Million Square Meters)
Table 93 France: By Market Size, By Mode of Application, 2013�2020 (USD Million)
Table 94 France: By Market Size, By Mode of Application, 2013�2020 (Million Square Meters)
Table 95 France: By Market Size, By End-User Industry, 2013�2020 (USD Millions)
Table 96 France: By Market Size, By End-User Industry, 2013�2020 (Million Square Meters)
Table 97 U.K.: Pressure Labels Market Size, By Type, 2013�2020 (USD Million)
Table 98 U.K.: By Market Size, By Type, 2013�2020 (Million Square Meters)
Table 99 U.K.: By Market Size, By Composition, 2013�2020 (USD Million)
Table 100 U.K.: By Market Size, By Composition, 2013�2020 (Million Square Meters)
Table 101 U.K.: By Market Size, By Printing Technology, 2013�2020 (USD Million)
Table 102 U.K.: By Market Size, By Printing Technology, 2013�2020 (Million Square Meters)
Table 103 U.K.: By Market Size, By Mode of Application, 2013�2020 (USD Million)
Table 104 U.K.: By Market Size, By Mode of Application, 2013�2020 (Million Square Meters)
Table 105 U.K.: By Market Size, By End-User Industry, 2013�2020 (USD Millions)
Table 106 U.K.: By Market Size, By End-User Industry, 2013�2020 (Million Square Meters)
Table 107 Rest of Europe: Pressure Labels Market Size, By Type, 2013�2020 (USD Million)
Table 108 Rest of Europe: By Market Size, By Type, 2013�2020 (Million Square Meters)
Table 109 Rest of Europe: By Market Size, By Composition, 2013�2020 (USD Million)
Table 110 Rest of Europe: By Market Size, By Composition, 2013�2020 (Million Square Meters)
Table 111 Rest of Europe: By Market Size, By Printing Technology, 2013�2020 (USD Million)
Table 112 Rest of Europe: By Market Size, By Printing Technology, 2013�2020 (Million Square Meters)
Table 113 Rest of Europe: By Market Size, By Mode of Application, 2013�2020 (USD Million)
Table 114 Rest of Europe: By Market Size, By Mode of Application, 2013�2020 (Million Square Meters)
Table 115 Rest of Europe: By Market Size, By End-User Industry, 2013�2020 (USD Million)
Table 116 Rest of Europe: By Market Size, By End-User Industry, 2013�2020 (Million Square Meters)
Table 117 North America: Pressure Labels Market Size, By Country, 2013�2020 (USD Million)
Table 118 North America: By Market Size, By Country, 2013�2020 (Million Square Meters)
Table 119 North America: By Market Size, By Type, 2013�2020 (USD Million)
Table 120 North America: By Market Size, By Type, 2013�2020 (Million Square Meters)
Table 121 North America: By Market Size, By Composition, 2013�2020 (USD Million)
Table 122 North America: By Market Size, By Composition, 2013�2020 (Million Square Meters)
Table 123 North America: By Market Size, By Printing Technology, 2013�2020 (USD Million)
Table 124 North America: By Market Size, By Printing Technology, 2013�2020 (Million Square Meters)
Table 125 North America: By Market Size, By Mode of Application, 2013�2020 (USD Million)
Table 126 North America: By Market Size, By Mode of Application, 2013�2020 (Million Square Meters)
Table 127 North America: By Market Size, By End-User Industry, 2013�2020 (USD Millions)
Table 128 North America: By Market Size, By End-User Industry, 2013�2020 (Million Square Meters)
Table 129 U.S.: Pressure Labels Market Size, By Type, 2013�2020 (USD Million)
Table 130 U.S.: By Market Size, By Type, 2013�2020 (Million Square Meters)
Table 131 U.S.: By Market Size, By Composition, 2013�2020 (USD Million)
Table 132 U.S.: By Market Size, By Composition, 2013�2020 (Million Square Meters)
Table 133 U.S.: By Market Size, By Printing Technology, 2013�2020 (USD Million)
Table 134 U.S.: By Market Size, By Printing Technology, 2013�2020 (Million Square Meters)
Table 135 U.S.: By Market Size, By Mode of Application, 2013�2020 (USD Million)
Table 136 U.S.: By Market Size, By Mode of Application, 2013�2020 (Million Square Meters)
Table 137 U.S.: By Market Size, By End-User Industry, 2013�2020 (USD Millions)
Table 138 U.S.: By Market Size, By End-User Industry, 2013�2020 (Million Square Meters)
Table 139 Canada: Pressure Labels Market Size, By Type, 2013�2020 (USD Million)
Table 140 Canada: By Market Size, By Type, 2013�2020 (Million Square Meters)
Table 141 Canada: By Market Size, By Composition, 2013�2020 (USD Million)
Table 142 Canada: By Market Size, By Composition, 2013�2020 (Million Square Meters)
Table 143 Canada: By Market Size, By Printing Technology, 2013�2020 (USD Million)
Table 144 Canada: By Market Size, By Printing Technology, 2013�2020 (Million Square Meters)
Table 145 Canada: By Market Size, By Mode of Application, 2013�2020 (USD Million)
Table 146 Canada: By Market Size, By Mode of Application, 2013�2020 (Million Square Meters)
Table 147 Canada: By Market Size, By End-User Industry, 2013�2020 (USD Millions)
Table 148 Canada: By Market Size, By End-User Industry, 2013�2020 (Million Square Meters)
Table 149 Mexico: Pressure Labels Market Size, By Type, 2013�2020 (USD Million)
Table 150 Mexico: By Market Size, By Type, 2013�2020 (Million Square Meters)
Table 151 Mexico: By Market Size, By Composition, 2013�2020 (USD Million)
Table 152 Mexico: By Market Size, By Composition, 2013�2020 (Million Square Meters)
Table 153 Mexico: By Market Size, By Printing Technology, 2013�2020 (USD Million)
Table 154 Mexico: By Market Size, By Printing Technology, 2013�2020 (Million Square Meters)
Table 155 Mexico: By Market Size, By Mode of Application, 2013�2020 (USD Million)
Table 156 Mexico: By Market Size, By Mode of Application, 2013�2020 (Million Square Meters)
Table 157 Mexico: By Market Size, By End-User Industry, 2013�2020 (USD Millions)
Table 158 Mexico: By Market Size, By End-User Industry, 2013�2020 (Million Square Meters)
Table 159 Rest of the World: Pressure Labels Market Size, By Country, 2013�2020 (USD Million)
Table 160 Rest of the World: By Market Size, By Country, 2013�2020 (Million Square Meters)
Table 161 Rest of the World: By Market Size, By Type, 2013�2020 (USD Million)
Table 162 Rest of the World: By Market Size, By Type, 2013�2020 (Million Square Meters)
Table 163 Rest of the World: By Market Size, By Composition, 2013�2020 (USD Million)
Table 164 Rest of the World: By Market Size, By Composition, 2013�2020 (Million Square Meters)
Table 165 Rest of the World: By Market Size, By Printing Technology, 2013�2020 (USD Million)
Table 166 Rest of the World: By Market Size, By Printing Technology, 2013�2020 (Million Square Meters)
Table 167 Rest of the World: By Market Size, By Mode of Application, 2013�2020 (USD Million)
Table 168 Rest of the World: By Market Size, By Mode of Application, 2013�2020 (Million Square Meters)
Table 169 Rest of the World: By Market Size, By End-User Industry, 2013�2020 (USD Millions)
Table 170 Rest of the World: By Market Size, By End-User Industry, 2013�2020 (Million Square Meters)
Table 171 Brazil: Pressure Labels Market Size, By Type, 2013�2020 (USD Million)
Table 172 Brazil: By Market Size, By Type, 2013�2020 (Million Square Meters)
Table 173 Brazil: By Market Size, By Composition, 2013�2020 (USD Million)
Table 174 Brazil: By Market Size, By Composition, 2013�2020 (Million Square Meters)
Table 175 Brazil: By Market Size, By Printing Technology, 2013�2020 (USD Million)
Table 176 Brazil: By Market Size, By Printing Technology, 2013�2020 (Million Square Meters)
Table 177 Brazil: By Market Size, By Mode of Application, 2013�2020 (USD Million)
Table 178 Brazil: By Market Size, By Mode of Application, 2013�2020 (Million Square Meters)
Table 179 Brazil: By Market Size, By End-User Industry, 2013�2020 (USD Millions)
Table 180 Brazil: By Market Size, By End-User Industry, 2013�2020 (Million Square Meters)
Table 181 Argentina: Pressure Labels Market Size, By Type, 2013�2020 (USD Million)
Table 182 Argentina: By Market Size, By Type, 2013�2020 (Million Square Meters)
Table 183 Argentina: By Market Size, By Composition, 2013�2020 (USD Million)
Table 184 Argentina: By Market Size, By Composition, 2013�2020 (Million Square Meters)
Table 185 Argentina: By Market Size, By Printing Technology, 2013�2020 (USD Million)
Table 186 Argentina: By Market Size, By Printing Technology, 2013�2020 (Million Square Meters)
Table 187 Argentina: By Market Size, By Mode of Application, 2013�2020 (USD Million)
Table 188 Argentina: By Market Size, By Mode of Application, 2013�2020 (Million Square Meters)
Table 189 Argentina: By Market Size, By End-User Industry, 2013�2020 (USD Millions)
Table 190 Argentina: By Market Size, By End-User Industry, 2013�2020 (Million Square Meters)
Table 191 South Africa: Pressure Labels Market Size, By Type, 2013�2020 (USD Million)
Table 192 South Africa: By Market Size, By Type, 2013�2020 (Million Square Meters)
Table 193 South Africa: By Market Size, By Composition, 2013�2020 (USD Million)
Table 194 South Africa: By Market Size, By Composition, 2013�2020 (Million Square Meters)
Table 195 South Africa: By Market Size, By Printing Technology, 2013�2020 (USD Million)
Table 196 South Africa: By Market Size, By Printing Technology, 2013�2020 (Million Square Meters)
Table 197 South Africa: By Market Size, By Mode of Application, 2013�2020 (USD Million)
Table 198 South Africa: By Market Size, By Mode of Application, 2013�2020 (Million Square Meters)
Table 199 South Africa: By Market Size, By End-User Industry, 2013�2020 (USD Millions)
Table 200 South Africa: By Market Size, By End-User Industry, 2013�2020 (Million Square Meters)
Table 201 Others in RoW: Pressure Labels Market Size, By Type, 2013�2020 (USD Million)
Table 202 Others in RoW: By Market Size, By Type, 2013�2020 (Million Square Meters)
Table 203 Others in RoW: By Market Size, By Composition, 2013�2020 (USD Million)
Table 204 Others in RoW: By Market Size, By Composition, 2013�2020 (Million Square Meters)
Table 205 Others in RoW: By Market Size, By Printing Technology, 2013�2020 (USD Million)
Table 206 Others in RoW: By Market Size, By Printing Technology, 2013�2020 (Million Square Meters)
Table 207 Others in RoW: By Market Size, By Mode of Application, 2013�2020 (USD Million)
Table 208 Others in RoW: By Market Size, By Mode of Application, 2013�2020 (Million Square Meters)
Table 209 Others in RoW: By Market Size, By End-User Industry, 2013�2020 (USD Millions)
Table 210 Others in RoW: By Market Size, By End-User Industry, 2013�2020 (Million Square Meters)
Table 211 Acquisitions, 2011�2015
Table 212 New Product Developments, 2011�2015
Table 213 Expansions, Investments & Divestments, 2011�2015
Table 214 AGreements, 2011�2015
List of Figures (56 Figures)
Figure 1 Pressure Labels Market: Research Design
Figure 2 Market Size Estimation Methodology: Bottom-Up Approach
Figure 3 Market Size Estimation Methodology: Top-Down Approach
Figure 4 Data Triangulation Methodology
Figure 5 Water-Based Pressure Labels Segment is Projected to Grow at the Highest CAGR
Figure 6 Food & Beverages is Projected to Be the Largest Segment By End-User Industry for Pressure Labels By 2020
Figure 7 Asia-Pacific: the Key Contributor to the Global Pressure Labels Market, 2014
Figure 8 Annual Developments in the Pressure Labels Market, 2011-2015
Figure 9 Emerging Economies Offer Attractive Opportunities in Pressure Labels Market
Figure 10 Food & Beverages Segment is Estimated to Capture the Largest Market Share, By End-User Industry, in 2015
Figure 11 China is Projected to Be the Fastest-Growing Country-Level Market for Pressure Labels
Figure 12 Digital Printing Segment to Grow at the Highest Rate Between 2015 and 2020
Figure 13 Facestock Distribution Segment Accounted for the Largest Share in the Pressure Labels Market in 2014
Figure 14 Release Liner Labels Segment is Projected to Account for the Largest Market Share
Figure 15 Evolution of Pressure Labels
Figure 16 By Type
Figure 17 By Composition
Figure 18 By Printing Technology
Figure 19 By Mode of Application
Figure 20 By End-Use Industry
Figure 21 By Region
Figure 22 Wide Application and Increasing Demand in Asia-Pacific: Major Drivers for the Growth of Pressure Labels
Figure 23 Raw Material Prices Fluctuation From 2000 to 2011
Figure 24 Supply Chain Analysis
Figure 25 Porter�s Five Forces Analysis
Figure 26 Release Liners Accounted for the Largest Market Share in 2014
Figure 27 Facestock Segment is Projected to Account for the Largest Market Share in 2020
Figure 28 Digital Printing is Estimated to Account for the Largest Share in the Pressure Labels Market in 2015
Figure 29 Water-Based Pressure Labels Segment is Estimated to Account the Largest Market Share in 2015
Figure 30 Food & Beverages Segment in Pressure Labels Market Projected to Account for the Largest Share in 2020
Figure 31 Geographical Snapshot: Pressure Labels Market Growth Rate (2015-2020)
Figure 32 Asia-Pacific: Market Snapshot
Figure 33 Europe: Market Snapshot
Figure 34 North America: Market Snapshot
Figure 35 Companies Adopted Acquisitions and New Product Developments as Key Growth Strategies Over the Last Five Years (2009�2015)
Figure 36 CCL Industries Inc.: Highest Growth Between 2012 & 2014
Figure 37 Annual Developments in the Pressure Labels Market, 2011�2015
Figure 38 Acquisitions & New Product Developments: the Key Strategies, 2011�2015
Figure 39 Geographic Revenue Mix of Top 5 Market Players
Figure 40 Avery Dennison Corporation: Company Snapshot
Figure 41 Avery Dennison Corporation: SWOT Analysis
Figure 42 CCL Industries Inc.: Company Snapshot
Figure 43 CCL Industries Inc.: SWOT Analysis
Figure 44 Constantia Flexibles Group GmbH: Company Snapshot
Figure 45 Constantia Flexibles Group GmbH: SWOT Analysis
Figure 46 UPM: Company Snapshot
Figure 47 UPM: SWOT Analysis
Figure 48 The 3M Company: Company Snapshot
Figure 49 The 3M Company: SWOT Analysis
Figure 50 Henkel AG & Co.: Company Snapshot
Figure 51 Mondi PLC: Company Snapshot
Figure 52 Coveris Holdings S.A.: Company Snapshot
Figure 53 H.B. Fuller: Company Snapshot
Figure 54 Torraspapel Adestor: Company Snapshot
Figure 55 Marketsandmarkets Knowledge Store Snapshot
Figure 56 Marketsandmarkets Knowledge Store: Chemical & Material Industry Snapshot


Growth opportunities and latent adjacency in Pressure Labels Market