The study involved four major activities in estimating the size for 3D and 4D technology market. Exhaustive secondary research was done to collect information on the market, peer market, and parent market. The next step was to validate these findings, assumptions, and sizing with industry experts across value chains through primary research. The bottom-up approach was employed to estimate the overall market size. After that, market breakdown and data triangulation were used to estimate the market size of segments and subsegments.
Secondary Research
In the secondary research process, various sources were used to identify and collect information important for this study. These include annual reports, press releases & investor presentations of companies, white papers, technology journals, and certified publications, articles by recognized authors, directories, and databases.
Secondary research was mainly used to obtain key information about the supply chain of the industry, the total pool of market players, classification of the market according to industry trends to the bottom-most level, regional markets, and key developments from the market and technology-oriented perspectives.
Primary research was also conducted to identify the segmentation types, key players, competitive landscape, and key market dynamics such as drivers, restraints, opportunities, challenges, and industry trends, along with key strategies adopted by players operating in the 3D and 4D technology market size . Extensive qualitative and quantitative analyses were performed on the complete market engineering process to list key information and insights throughout the report.
Primary Research
Extensive primary research has been conducted after acquiring knowledge about the 3D and 4D technology market size scenario through secondary research. Several primary interviews have been conducted with experts from both demand (end users) and supply side (3D and 4D technology solution providers) across 4 major geographic regions: North America, Europe, Asia Pacific, and RoW. Approximately 80% and 20% of the primary interviews have been conducted from the supply and demand side, respectively. These primary data have been collected through questionnaires, emails, and telephonic interviews.

To know about the assumptions considered for the study, download the pdf brochure
3D and 4D Technology Market Size Estimation
In the complete market engineering process, both the top-down and bottom-up approaches were implemented, along with several data triangulation methods, to estimate and validate the size of the 3D and 4D technology market and various other dependent submarkets. Key players in the market were identified through secondary research, and their market share in the respective regions was determined through primary and secondary research. This entire research methodology included the study of annual and financial reports of the top players, as well as interviews with experts (such as CEOs, VPs, directors, and marketing executives) for key insights (quantitative and qualitative).
All percentage shares, splits, and breakdowns were determined using secondary sources and verified through primary sources. All the possible parameters that affect the markets covered in this research study were accounted for, viewed in detail, verified through primary research, and analyzed to obtain the final quantitative and qualitative data. This data was consolidated and supplemented with detailed inputs and analysis from MarketsandMarkets and presented in this report.
3D and 4D Technology Market: Bottom-Up Approach

3D and 4D Technology Market: Top-Down Approach

Data Triangulation
After arriving at the overall market size from the market size estimation process as explained above, the total market has been split into several segments and subsegments. To complete the overall market engineering process and arrive at the exact statistics for all segments and subsegments, market breakdown and data triangulation procedures have been employed, wherever applicable. The data has been triangulated by studying various factors and trends from both demand and supply sides. Along with this, the market has been validated using top-down and bottom-up approaches.
Definition
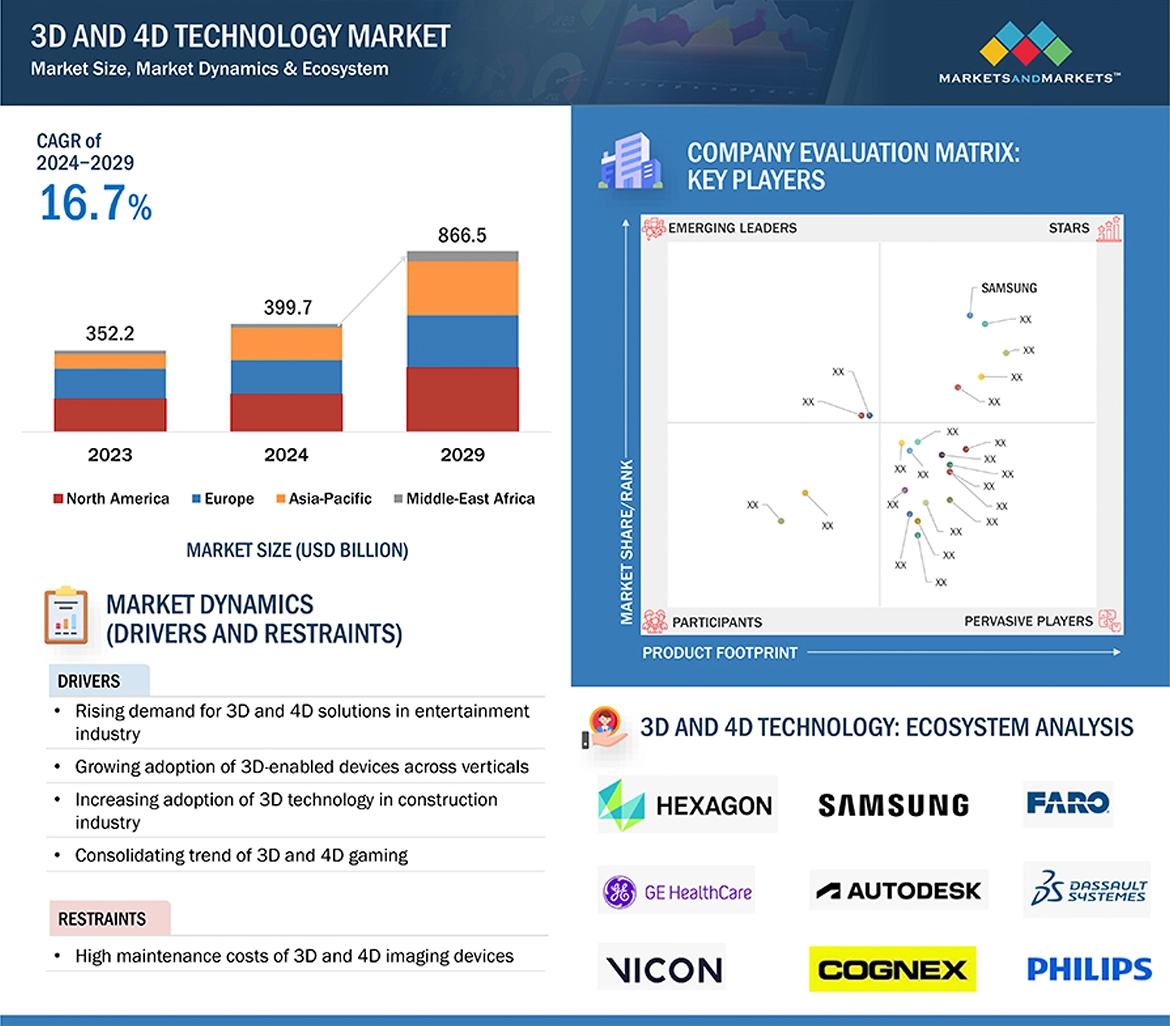
3D and 4D technology stands for three- and four-dimensional technology. 3D technology can be defined as the illusion of depth or a visual representation system that tries to create or reproduce a moving object in the third dimension. 3D technology provides users with a whole new level of experience, immersion, interaction, and realism; the technology has become a mainstream element in cinemas, televisions, the internet, video games, mobile phones, and other products.
4D technology combines the effects of 3D, along with the external physical effects with respect to time. 4D technology finds applications in 4D cinemas, games, and ultrasound systems. 4D printing is another upcoming application. 4D printing allows objects to be 3D-printed and then self-transform in shape and material property when exposed to a predetermined stimulus, such as submersion in water or exposure to heat, pressure, current, ultraviolet light, or some other sources of energy.
Key Stakeholders
-
Senior Management
-
End User
-
Finance/Procurement Department
-
R&D Department
Report Objectives
-
To describe, segment, and forecast the overall size of the 3D and 4D technology market , by solution type, end-use application, vertical, and region, in terms of value
-
To describe and forecast the global 3D and 4D technology market, by 3D and 4D input devices, in terms of volume
-
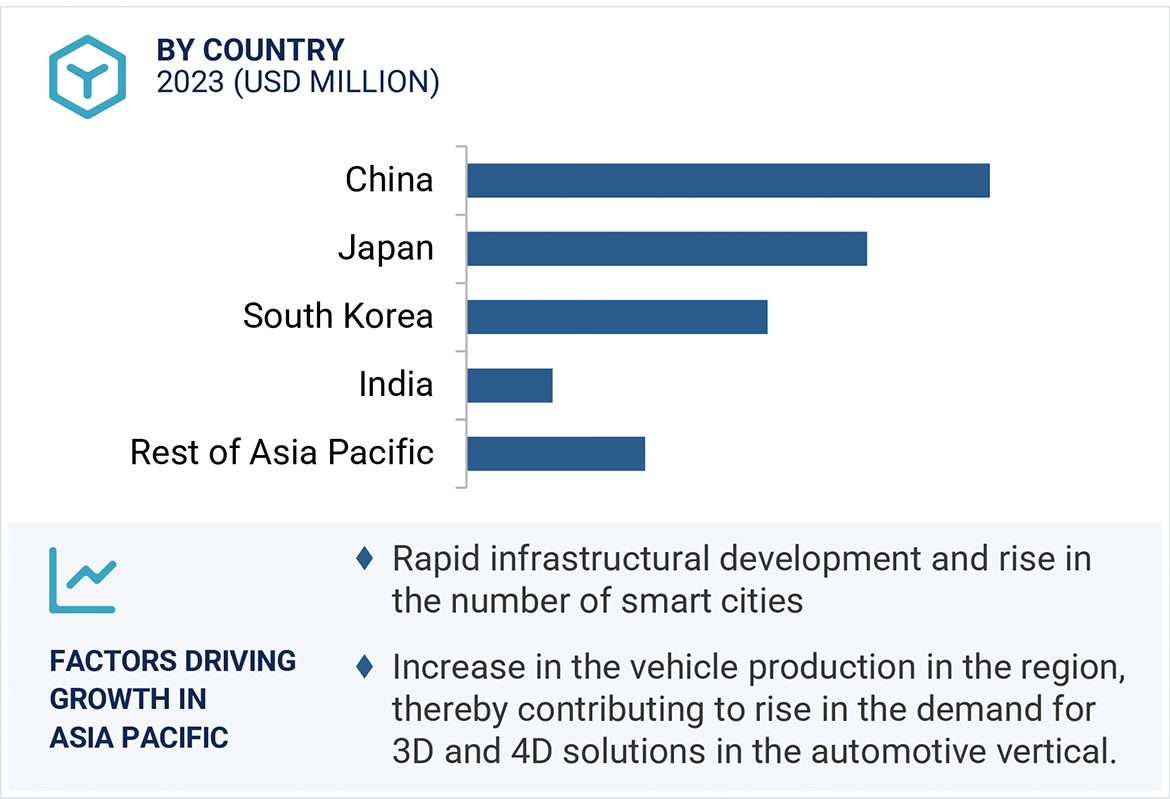
To describe and forecast the market size for various segments with regard to four main regions, namely, North America, Europe, Asia Pacific, and Rest of the World (RoW), in terms of value
-
To provide detailed information regarding major drivers, restraints, opportunities, and challenges influencing the market growth
-
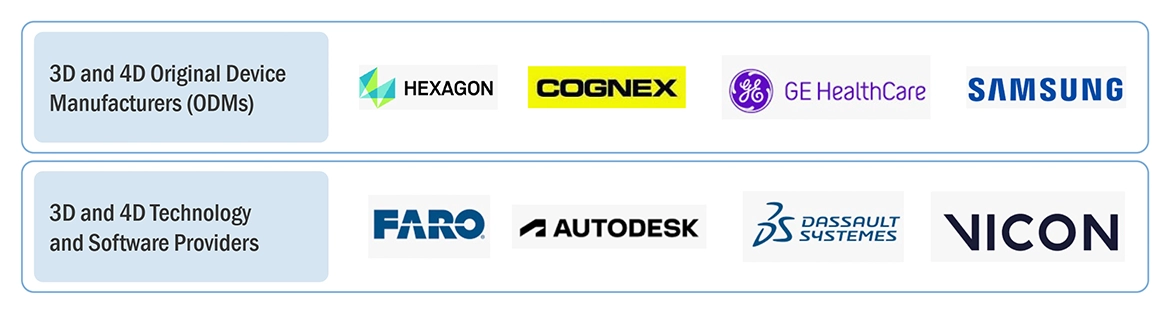
To analyze the supply chain, trends/disruptions impacting customer business, market/ecosystem map, pricing, and regulatory landscape pertaining to the 3D and 4D technology market size
-
To analyze opportunities in the market for stakeholders by identifying the high-growth segments of the market
-
To describe the value chain of 3D and 4D technology solutions in brief
-
To strategically analyze micromarkets1 with respect to individual growth trends, prospects, and contributions to the overall market
-
To profile key players and comprehensively analyze their market position in terms of their ranking and core competencies2, along with the detailed competitive landscape of the
-
market
-
To analyze competitive developments, such as product launches and developments, partnerships, agreements, expansions, acquisitions, contracts, alliances, and research & development (R&D), undertaken in the 3D and 4D technology market size
-
To benchmark market players using the proprietary ‘Company Evaluation Matrix,’ which analyzes market players on various parameters within the broad categories of business strategy excellence and strength of product portfolio
-
To analyze the probable impact of the recession on the market
Available Customizations
With the given market data, MarketsandMarkets offers customizations according to the company’s specific needs. The following customization options are available for the report:
Product Analysis
-
Product matrix that gives a detailed comparison of the product portfolio of each company
Company Information
-
Detailed analysis and profiling of additional market players (up to 7)


Zhou
Mar, 2021
Interested in market developments related to minimally invasive surgery with 3D endoscope system. .