3D Animation Market by Technology (3D Modeling, Motion Graphics, 3D Rendering, and Visual Effects), Vertical (Media and Entertainment, Healthcare and Lifesciences, Manufacturing), Services, Deployment, and Region - Global Forecast to 2022


[129 Pages Report] The 3D animation market is expected to grow from USD 12,010.0 million in 2017 to USD 21,050.0 million by 2022, at a Compound Annual Growth Rate (CAGR) of 11.9%. Increasing adoption of visual effects (VFX) in the entertainment industry is one of the crucial factors impacting the 3D animation market. VFX is majorly preferred by animators, game developers, and moviemakers in the scenario where they technically want to depict something that cannot be shot in a live environment. In addition, 3D mapping and 3D laser scanning features to assist professionals in geospatial, geological, geophysical, and mining environments to visualize and map the coordinates is gaining traction. The continuous exposure to corruption and piracy, a low level of proficiency, intense competition, and increasing price sensitivity are some of the challenges for the growth of the market.
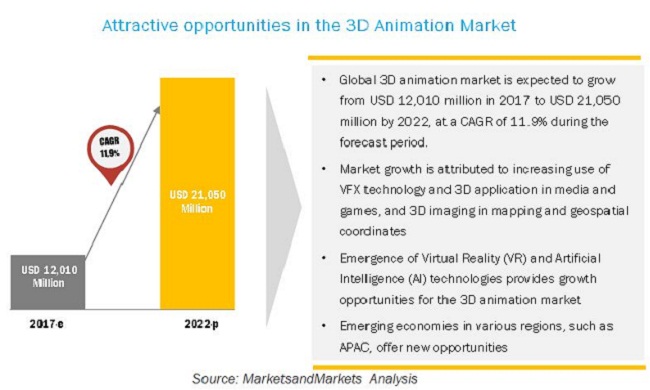
Source: MarketsandMarkets Analysis
Market Dynamics
Market Driver: Growing adoption of visual effects technology in movies
Entertainment industry is rapidly adopting the VFX, which is commonly known as visual effects, for creating visually enhanced imagery with the help of animation and computer graphics. Animators, game developers, and moviemakers prefer VFX in the scenario where they technically want to depict something that cannot be shot in a live environment and that should be simulated in a virtual world or in animation software. In this scenario, 3D animation software or tools play a vital role to depict the required scene that needs to appear real. VFX is a broad term like animation, which majorly uses camera mapping technique of creating visual effects for getting the desired output. A 3D animation software plays a crucial role in this scenario, in which still images are taken and processed using various 3D animation tools. In addition, the adoption rate of VFX technique is growing at a faster pace and offering the new professional opportunities for the animators and visual effect artists. This majorly provides the traction to the use of 3D animation technique in the entertainment industry, thereby driving the overall 3D animation market growth.
3D Animation Market: Research Design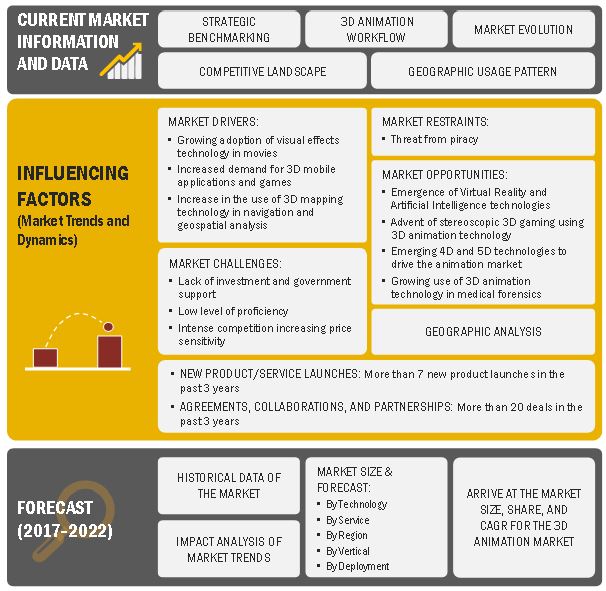
Source: MarketsandMarkets Analysis
In the service segment, the education and training services segment is expected to grow at the highest CAGR in the 3D animation market. There are a number of educational institutions and software training centers worldwide offering full-time training courses, certifications, and seasonal camps for artists, gamers, and animators. This is because there is a huge demand for professional 3D animators, modelers, graphic designers, and gaming developers.
On the basis of technology type, the visual effects segment is expected to grow with the highest CAGR in the 3D animation market. Visualization through visual imagery is one of the most efficient ways to communicate both abstract and concrete ideas. The development of animation has resulted in advanced visualization. It involves integration of actual video footages and artificial imageries to create scenes that look realistic. The Visual Effects (VFX) technology helps in developing creative effects in brand advertisement, logo, and product promotion. Apart from cinema and gaming, VFX is applied in scientific visualization, information visualization, product visualization, systems visualization, visual analytics, and similar other fields.
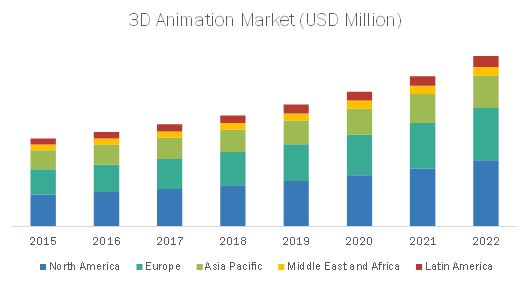
Source: MarketsandMarkets Analysis
On the basis of regions, the global 3D Animation market has been segmented into North America, Europe, Asia Pacific (APAC), Middle East and Africa (MEA), and Latin America. North America holds the largest market share and APAC is growing at the highest CAGR in the 3D animation market, however MEA and Latin America are still in the initial phase of growth stage. Lack of government initiatives and poor finance are some of the major factors, which are restraining the growth of 3D animation in these regions.
The major vendors in 3D Animation market are Adobe Systems (U.S.), Autodesk (U.S.), AutoDesSys (U.S.), Corel Corporation (Canada), Maxon Computer (Germany), NewTek, Inc. (U.S.), NVIDIA Corporation (U.S.), Pixologic, Inc. (U.S.), SideFX (Canada), and Toon Boom Animation, Inc. (Canada).
Scope of the report
|
Report Metrics |
Details |
|
Market size available for years |
2015�2022 |
|
Forecast period |
2017�2022 |
|
Forecast units |
Million (USD) |
|
Segments covered |
Component, Technology, Service, Deployment type, Verticals |
|
Geographies covered |
North America, Europe, APAC, MEA, and Latin America |
|
Companies covered |
Adobe Systems Inc. (California, U.S.), Autodesk Inc. (California, U.S.), AutoDesSys (Ohio, U.S.), Corel Corporation (Ottawa, Canada), Maxon Computer (Friedrichsdorf, Germany), NewTek Inc. (Texas, U.S.), NVIDIA Corporation (California, U.S.), Pixologic Inc. (California, U.S.), SideFx Software (Toronto, Canada), The Foundry VisionMongers Ltd. (London, U.K.), Trimble Navigation Ltd. (California, U.S.), and Toon Boom Animation Inc. (Montreal, Canada) |
The research report segments the 3D animation market into the following submarkets:
By Technology:
- 3D Modeling
- Motion Graphics
- 3D Rendering
- Visual Effects (VFX)
- Others
By Service:
- Consulting
- Support and Maintenance
- Integration and Deployment
- Education and Training
By Deployment:
- On-Premises
- On-Demand
By Verticals:
- Media and Entertainment
- Construction and Architecture
- Healthcare and Lifesciences
- Manufacturing
- Education and Academia
- Others
By Region:
- North America
- Europe
- Asia-Pacific (APAC)
- Middle East and Africa (MEA)
- Latin America
Recent Developments
|
Date |
Nature of Agreement |
Company 1 |
Company 2 |
Synergy |
|
2016 |
Partnership |
Autodesk |
RIB Software |
Autodesk partnered with RIB Software, a leading provider of 5D BIM Big Data technology for the construction engineering. This partnership facilitated the delivery of fully integrated iTWO 5D BIM enterprise solutions for architecture and construction industries. |
|
2016 |
Acquisition |
Corel Corporation |
MindManager (Spigit) |
Corel acquired MindManager, a leading mind mapping and information visualization software, from Spigit. This acquisition enabled Corel to expand its product portfolio and increase the global sales. |
|
2016 |
Partnership |
Maxon Computers |
NVIDIA |
Maxon Computers partnered with NVIDIA, a GPU and SOC developer company. This partnership enabled Maxon to get access to NVIDIA rendering technology, including its Quasi-Monte Carlo (QMC) sampling patent family, NVIDIA Iray and Material definition Language. |
|
2016 |
Partnership |
NVIDIA |
Maxon |
NVIDIA partnered with Maxon, a leading developer of professional 3D modeling, animation, painting, and rendering solutions. This partnership enabled NVIDIA to give access to its rendering technology such as NVIDIA Ray and Material Definition Language to Maxon. |
|
2016 |
Partnership |
Pixologic Inc. |
Wacom |
Pixologic partnered with Wacom, a leading manufacturer of pen tablets, interactive pen displays, and digital interface solutions. This partnership enabled Pixologic to offer a 3D intuitive pen, capable of creating 3D design on PC to its commercial clients. |
The report will help the market leaders and new entrants in the 3D Animation market in the following ways:
- The report segments the market into various subsegments, hence it covers the market comprehensively. It provides the closest approximations of the revenue numbers for the overall market and the subsegments. The market numbers are further split across different regions.
- The report helps in understanding the overall growth of the market. It provides information on the key market drivers, restraints, challenges, and opportunities.
- The report helps in understanding the competitors better and provides more insights to strengthen the organization�s position in the market. The study also presents the positioning of the key players based on their product offerings and business strategies.
To speak to our analyst for a discussion on the above findings, click Speak to Analyst
 Exclusive indicates content/data unique to MarketsandMarkets and not available with any competitors.
Table of Contents
1 Introduction
1.1 Objectives of the Study
1.2 Market Definition
1.3 Market Scope
1.4 Years Considered for the Study
1.5 Currency
1.6 Stakeholders
2 Research Methodology
2.1 Research Data
2.1.1 Secondary Data
2.1.2 Primary Data
2.1.2.1 Breakdown of Primaries
2.1.2.2 Key Industry Insights
2.2 Market Size Estimation
2.3 Research Assumptions
2.4 Limitations
3 Executive Summary
4 Premium Insights
4.1 Attractive Market Opportunities in the 3D Animation Market
4.2 3D Animation Software Market, By Vertical and Region, 2017
4.3 Lifecycle Analysis, By Region, 2017�2022
4.4 Market Investment Scenario
4.5 Global Market By Technology, 2017�2022
5 3D Animation Market Overview and Industry Trends
5.1 Introduction
5.2 Market Dynamics
5.2.1 Drivers
5.2.1.1 Growing Adoption of Visual Effects Technology in Movies
5.2.1.2 Increasing Demand for 3D Mobile Applications and Games
5.2.1.3 Increase in the Use of 3D Mapping Technology in Navigation and Geospatial Analysis
5.2.2 Restraints
5.2.2.1 Threat From Piracy
5.2.3 Opportunities
5.2.3.1 Emergence of Virtual Reality and Artificial Intelligence Technologies
5.2.3.2 Advent of Stereoscopic 3D Gaming Using 3D Animation Technology
5.2.3.3 Emerging 4D and 5D Technologies to Drive the Animation Market
5.2.3.4 Growing Use of 3D Animation Technology in Medical Forensics
5.2.4 Challenges
5.2.4.1 Lack of Investment and Government Support
5.2.4.2 Low Level of Proficiency
5.2.4.3 Intense Competition Increasing Price Sensitivity
5.3 3D Animation Workflow
5.4 Strategic Benchmarking
5.5 Evolution
6 Market Analysis, By Component
6.1 Introduction
6.2 Technology
6.3 Service
7 3D Animation Market Analysis, By Technology
7.1 Introduction
7.2 3D Modeling
7.3 Motion Graphics
7.4 3D Rendering
7.5 Visual Effects
7.6 Others
8 3D Animation Market Analysis, By Service
8.1 Introduction
8.2 Consulting
8.3 Support and Maintenance
8.4 Integration and Deployment
8.5 Education and Training
9 3D Animation Market Analysis, By Deployment
9.1 Introduction
9.2 On-Premises
9.3 On-Demand
10 3D Animation Market Analysis, By Vertical
10.1 Introduction
10.2 Media and Entertainment
10.3 Construction and Architecture
10.4 Education and Academia
10.5 Manufacturing
10.6 Healthcare and Life Sciences
10.7 Others
11 3D Animation Geographic Analysis
11.1 Introduction
11.2 North America
11.2.1 Us
11.2.2 Canada
11.3 Europe
11.3.1 UK
11.3.2 Germany
11.4 Asia-Pacific
11.4.1 China
11.4.2 Japan
11.5 Middle East And Africa
11.5.1 Mena
11.5.2 Sub-Saharan Africa
12 3D Animation Vendor Dive Analysis
12.1 Overview
12.2 Competitive Leadership Mapping
12.2.1 Visionary Leaders
12.2.2 Innovators
12.2.3 Dynamic Differentiators
12.2.4 Emerging Companies
12.3 Strength Of Product Portfolio
12.4 Business Strategy Excellence
12.5 Vendor Ranking Analysis
13 Company Profiles
(Business Overview, Products & Services, Key Insights, Recent Developments, SWOT Analysis, MnM View)*
13.1 Adobe Systems Inc.
13.2 Autodesk Inc.
13.3 Autodessys
13.4 Corel Corporation
13.5 Maxon Computer
13.6 Newtek Inc.
13.7 Nvidia Corporation
13.8 Pixologic Inc.
13.9 Sidefx Software
13.10 The Foundry Visionmongers Ltd.
13.11 Trimble Navigation Ltd.
13.12 Toon Boom Animation Inc.
*Details on Business Overview, Products & Services, Key Insights, Recent Developments, SWOT Analysis, MnM View Might Not Be Captured in Case of Unlisted Companies.
14 Appendix
14.1 Industry Excerpts
14.2 Discussion Guide
14.3 Knowledge Store: MarketsandMarkets Subscription Portal
14.4 Available Customizations
14.5 Related Reports
14.6 Author Details
List of Tables (103 Tables)
Table 1 3D Animation Market Size, By Component, 2015�2022 (USD Million)
Table 2 Market Size, By Technology, 2015�2022 (USD Million)
Table 3 Technology: Market Size, By Region, 2015�2022 (USD Million)
Table 4 3D Modeling Market Size, By Region, 2015�2022 (USD Million)
Table 5 Motion Graphics Market Size, By Region, 2015�2022 (USD Million)
Table 6 3D Rendering Market Size, By Region, 2015�2022 (USD Million)
Table 7 Visual Effects Market Size, By Region, 2015�2022 (USD Million)
Table 8 Others Market Size, By Region, 2015�2022 (USD Million)
Table 9 3D Animation Market Size, By Services, 2015�2022 (USD Million)
Table 10 Services: Market Size, By Region, 2015�2022 (USD Million)
Table 11 Consulting Market Size, By Region, 2015�2022 (USD Million)
Table 12 Support and Maintenance Market Size, By Region, 2015�2022 (USD Million)
Table 13 Integration and Deployment Market Size, By Region, 2015�2022 (USD Million)
Table 14 Education and Training Market Size, By Region, 2015�2022 (USD Million)
Table 15 3D Animation Market Size, By Deployment, 2015�2022 (USD Million)
Table 16 Deployment: Market Size, By Region, 2015�2022 (USD Million)
Table 17 On-Premises: Market Size, By Region, 2015�2022 (USD Million)
Table 18 On-Demand: Market Size, By Region, 2015�2022 (USD Million)
Table 19 3D Animation Market Size, By Vertical, 2015�2022 (USD Million)
Table 20 Vertical: Market Size, By Region, 2015�2022 (USD Million)
Table 21 Media and Entertainment: Market Size, By Region, 2015�2022 (USD Million)
Table 22 Construction and Architecture: Market Size, By Region, 2015�2022 (USD Million)
Table 23 Education and Academia: Market Size, By Region, 2015�2022 (USD Million)
Table 24 Manufacturing: Market Size, By Region, 2015�2022 (USD Million)
Table 25 Healthcare and Life Sciences: Market Size, By Region, 2015�2022 (USD Million)
Table 26 Others: Market Size, By Region, 2015�2022 (USD Million)
Table 27 Asia-Pacific is Expected to Exhibit the Highest CAGR in the Market During the Forecast Period
Table 28 3D Animation Market Size, By Region, 2015�2022 (USD Million)
Table 29 North America: Market Size, By Component, 2015-2022 (USD Million)
Table 30 North America: Market Size, By Technology, 2015-2022 (USD Million)
Table 31 North America: Market Size, By Service, 2015�2022 (USD Million)
Table 32 North America: Market Size, By Deployment, 2015�2022 (USD Million)
Table 33 North America: Market Size, By Vertical, 2015�2022 (USD Million)
Table 34 US: Market Size, By Component, 2015-2022 (USD Million)
Table 35 US: Market Size, By Technology, 2015-2022 (USD Million)
Table 36 US: Market Size, By Service, 2015�2022 (USD Million)
Table 37 US: Market Size, By Deployment, 2015�2022 (USD Million)
Table 38 US: Market Size, By Vertical, 2015�2022 (USD Million)
Table 39 Canada: Market Size, By Component, 2015-2022 (USD Million)
Table 40 Canada: Market Size, By Technology, 2015-2022 (USD Million)
Table 41 Canada: Market Size, By Service, 2015�2022 (USD Million)
Table 42 Canada: Market Size, By Deployment, 2015�2022 (USD Million)
Table 43 Canada: Market Size, By Vertical, 2015�2022 (USD Million)
Table 44 Europe: 3D Animation Market Size, By Component, 2015-2022 (USD Million)
Table 45 Europe: Market Size, By Technology, 2015-2022 (USD Million)
Table 46 Europe: Market Size, By Service, 2015�2022 (USD Million)
Table 47 Europe: Market Size, By Deployment, 2015�2022 (USD Million)
Table 48 Europe: Market Size, By Vertical, 2015�2022 (USD Million)
Table 49 UK: 3D Animation Market Size, By Component, 2015-2022 (USD Million)
Table 50 UK: Market Size, By Technology, 2015-2022 (USD Million)
Table 51 UK: Market Size, By Service, 2015�2022 (USD Million)
Table 52 UK: Market Size, By Deployment, 2015�2022 (USD Million)
Table 53 UK: Market Size, By Vertical, 2015�2022 (USD Million)
Table 54 Germany: 3D Animation Market Size, By Component, 2015-2022 (USD Million)
Table 55 Germany: Market Size, By Technology, 2015-2022 (USD Million)
Table 56 Germany: Market Size, By Service, 2015�2022 (USD Million)
Table 57 Germany: Market Size, By Deployment, 2015�2022 (USD Million)
Table 58 Germany: Market Size, By Vertical, 2015�2022 (USD Million)
Table 59 Asia-Pacific: 3D Animation Market Size, By Component, 2015-2022 (USD Million)
Table 60 Asia-Pacific: Market Size, By Technology, 2015-2022 (USD Million)
Table 61 Asia-Pacific: Market Size, By Service, 2015�2022 (USD Million)
Table 62 Asia-Pacific: Market Size, By Deployment, 2015�2022 (USD Million)
Table 63 Asia-Pacific: Market Size, By Vertical, 2015�2022 (USD Million)
Table 64 China: 3D Animation Market Size, By Component, 2015-2022 (USD Million)
Table 65 China: Market Size, By Technology, 2015-2022 (USD Million)
Table 66 China: Market Size, By Service, 2015�2022 (USD Million)
Table 67 China: Market Size, By Deployment, 2015�2022 (USD Million)
Table 68 China: Market Size, By Vertical, 2015�2022 (USD Million)
Table 69 Japan: 3D Animation Market Size, By Component, 2015-2022 (USD Million)
Table 70 Japan: Market Size, By Technology, 2015-2022 (USD Million)
Table 71 Japan: Market Size, By Service, 2015�2022 (USD Million)
Table 72 Japan: Market Size, By Deployment, 2015�2022 (USD Million)
Table 73 Japan: Market Size, By Vertical, 2015�2022 (USD Million)
Table 74 Middle East and Africa: 3D Animation Market Size, By Component, 2015-2022 (USD Million)
Table 75 Middle East and Africa: Market Size, By Technology, 2015-2022 (USD Million)
Table 76 Middle East and Africa: Market Size, By Service, 2015�2022 (USD Million)
Table 77 Middle East and Africa: Market Size, By Deployment, 2015�2022 (USD Million)
Table 78 Middle East and Africa: Market Size, By Vertical, 2015�2022 (USD Million)
Table 79 MENA: 3D Animation Market Size, By Component, 2015-2022 (USD Million)
Table 80 MENA: Market Size, By Technology, 2015-2022 (USD Million)
Table 81 MENA: Market Size, By Service, 2015�2022 (USD Million)
Table 82 MENA: Market Size, By Deployment, 2015�2022 (USD Million)
Table 83 MENA: Market Size, By Vertical, 2015�2022 (USD Million)
Table 84 SUB-SAHARAN AFRICA: 3D Animation Market Size, By Component, 2015-2022 (USD Million)
Table 85 SUB-SAHARAN AFRICA: Market Size, By Technology, 2015-2022 (USD Million)
Table 86 SUB-SAHARAN AFRICA: Market Size, By Service, 2015�2022 (USD Million)
Table 87 SUB-SAHARAN AFRICA: Market Size, By Deployment, 2015�2022 (USD Million)
Table 88 SUB-SAHARAN AFRICA: Market Size, By Vertical, 2015�2022 (USD Million)
Table 89 Latin America: 3D Animation Market Size, By Component, 2015-2022 (USD Million)
Table 90 Latin America: Market Size, By Technology, 2015-2022 (USD Million)
Table 91 Latin America: Market Size, By Services, 2015�2022 (USD Million)
Table 92 Latin America: Market Size, By Deployment, 2015�2022 (USD Million)
Table 93 Latin America: Market Size, By Vertical, 2015�2022 (USD Million)
Table 94 Brazil: 3D Animation Market Size, By Component, 2015-2022 (USD Million)
Table 95 Brazil: Market Size, By Technology, 2015-2022 (USD Million)
Table 96 Brazil: Market Size, By Services, 2015�2022 (USD Million)
Table 97 Brazil: Market Size, By Deployment, 2015�2022 (USD Million)
Table 98 Brazil: Market Size, By Vertical, 2015�2022 (USD Million)
Table 99 Mexico: 3D Animation Market Size, By Component, 2015-2022 (USD Million)
Table 100 Mexico: Market Size, By Technology, 2015-2022 (USD Million)
Table 101 Mexico: Market Size, By Services, 2015�2022 (USD Million)
Table 102 Mexico: Market Size, By Deployment, 2015�2022 (USD Million)
Table 103 Mexico: Market Size, By Vertical, 2015�2022 (USD Million)
List of Figures (57 Figures)
Figure 1 3D Animation Market: Market Segmentation
Figure 2 Regional Scope
Figure 3 Market: Research Design
Figure 4 Breakdown of Primary Interviews: By Company, Designation, and Region
Figure 5 Data Triangulation
Figure 6 Market Size Estimation Methodology: Bottom-Up Approach
Figure 7 Market Size Estimation Methodology: Top-Down Approach
Figure 8 3D Animation Market: Assumptions
Figure 9 North America is Estimated to Hold the Largest Market Share in 2017
Figure 10 Fastest- Growing Segments of the Global 3D Animation Market
Figure 11 On-Premises Deployment Model is Estimated to Hold the Major Market Share in 2017
Figure 12 Growth Trends in the Global Market
Figure 13 Media and Entertainment Vertical is Estimated to Hold the Largest Market Share in 2017
Figure 14 Regional Lifecycle: Asia-Pacific is Expected to Exhibit the Highest Growth Potential During the Forecast Period
Figure 15 Global Market Scenario
Figure 16 Visual Effects, 3D Rendering, and Motion Graphics Technologies are Expected to Hold the Highest Growth Rate During the Forecast Period
Figure 17 Market Drivers, Restraints, Opportunities, and Challenges
Figure 18 3D Animation Market Workflow
Figure 19 Market Strategic Benchmarking
Figure 20 Market Timeline
Figure 21 Services Segment is Expected to Grow at A Higher CAGR During the Forecast Period
Figure 22 Visual Effects Segment is Expected to Grow at the Highest CAGR During the Forecast Period
Figure 23 Education and Training Services Segment is Expected to Grow at the Highest CAGR During the Forecast Period
Figure 24 On-Demand Segment is Expected to Grow at A Higher CAGR During the Forecast Period
Figure 25 Manufacturing Vertical is Expected to Grow at the Highest CAGR During the Forecast Period
Figure 26 Asia-Pacific: an Attractive Destination in the 3D Animation Market, 2017�2022
Figure 27 North America Market Snapshot
Figure 28 Asia-Pacific Market Snapshot
Figure 29 Dive Chart
Figure 30 Adobe Systems Inc.: Company Snapshot (2015)
Figure 31 Adobe Systems Inc.: Product Offering Scorecard
Figure 32 Adobe Systems Inc.: Business Strategy Scorecard
Figure 33 Autodesk Inc.: Company Snapshot
Figure 34 Autodesk Inc.: Product Offering Scorecard
Figure 35 Autodesk Inc.: Business Strategy Scorecard
Figure 36 Autodessys: Product Offering Scorecard
Figure 37 Autodessys: Business Strategy Scorecard
Figure 38 Corel Corporation: Product Offering Scorecard
Figure 39 Corel Corporation: Business Strategy Scorecard
Figure 40 Maxon Computer: Product Offering Scorecard
Figure 41 Maxon Computer: Business Strategy Scorecard
Figure 42 Newtek Inc.: Product Offering Scorecard
Figure 43 Newtek Inc.: Business Strategy Scorecard
Figure 44 Nvidia Corporation: Company Snapshot
Figure 45 Nvidia Corporation: Product Offering Scorecard
Figure 46 Nvidia Corporation: Business Strategy Scorecard
Figure 47 Pixologic Inc.: Product Offering Scorecard
Figure 48 Pixologic Inc.: Business Strategy Scorecard
Figure 49 Sidefx Software: Product Offering Scorecard
Figure 50 Sidefx Software: Business Strategy Scorecard
Figure 51 The Foundry Visionmongers Ltd: Product Offering Scorecard
Figure 52 The Foundry Visionmongers Ltd: Business Strategy Scorecard
Figure 53 Trimble Navigation Ltd: Company Snapshot
Figure 54 Trimble Navigation Ltd: Product Offering Scorecard
Figure 55 Trimble Navigation Ltd: Business Strategy Scorecard
Figure 56 Toon Boom Animation Inc.: Product Offering Scorecard
Figure 57 Toon Boom Animation Inc.: Business Strategy Scorecard


Growth opportunities and latent adjacency in 3D Animation Market
Understanding 3D animation and graphics market
Understanding VFX and 3D animation market
Understanding 3D animation by hardware and graphics market
Understanding 3D animation, graphics and related market
Understanding 3D animation and graphics market
Understanding 3D modeling and graphics market
Understanding 3D animation market
Understanding 3D animation and graphics market
Understanding the virtual reality industry