
3D Printing Market Size, Share & Trends, 2025 To 2030

3D Printing Market by Offering (Printers, Materials, Software, Services), Technology [Fused Deposition Modeling (FDM), Stereolithography (SLA), Selective Laser Sintering (SLS)], Process, Application, Vertical - Global Forecast to 2030


OVERVIEW
Source: Secondary Research, Interviews with Experts, MarketsandMarkets Analysis
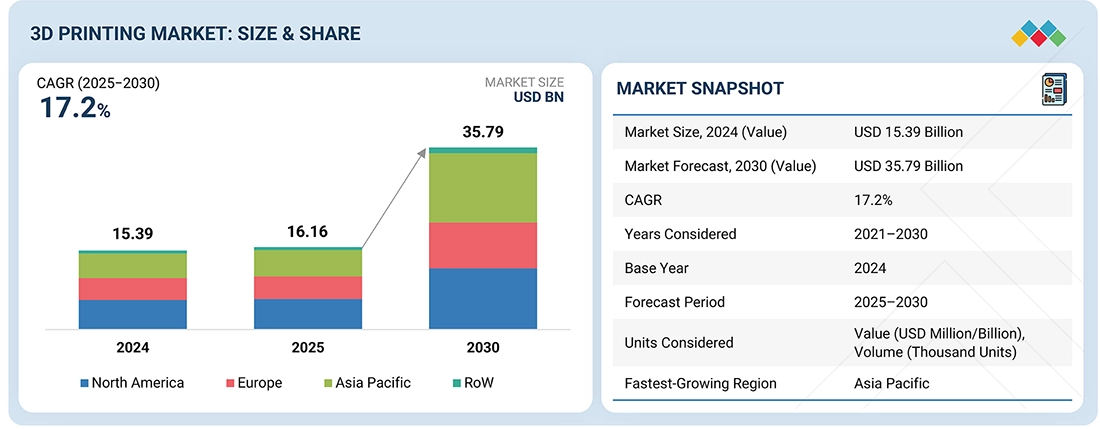
The global 3D printing market was estimated at USD 15.39 billion in 2024 and is predicted to increase from USD 16.16 billion in 2025 to USD 35.79 billion by 2030, expanding at a CAGR of 17.2%. The growth is driven by advancements in additive manufacturing technologies and rising demand for customized products.
KEY TAKEAWAYS
-
BY OFFERINGIndustrial printers are estimated to account for a major share of the 3D printing market due to their ability to handle large-scale, high-precision production and a wide variety of advanced materials.
-
BY TECHNOLOGYFused deposition modeling (FDM) is estimated to be the largest market in the 3D printing market due to its cost-effectiveness, ease of use, and wide material compatibility.
-
BY PROCESSVat photopolymerization is projected to grow at a significant rate in the 3D printing market because it delivers superior surface finish and high accuracy and is increasingly adopted in healthcare and dental applications for producing intricate, customized parts.
-
BY APPLICATIONThe rising demand for 3D-printed automobile parts and components is projected to drive the growth of the functional part manufacturing application demand.
-
BY VERTICALThe increasing development of autonomous and electric vehicles and the focus on mass customization are projected to fuel the demand for 3D printers in the automotive segment.
-
BY REGIONAsia Pacific is projected to grow at a high CAGR in the 3D printing market, driven by the rising adoption of 3D printing technology in various verticals, including automotive, consumer goods, healthcare, and industrial.
-
COMPETITIVE LANDSCAPEProminent market players have adopted both organic and inorganic strategies, including partnerships and investments. Stratasys (US), EOS GmbH (Germany), and HP Development Company, L.P. (US) have entered into a number of agreements and partnerships to address the growing demand for 3D printing in innovative applications.
The 3D printing market is witnessing significant growth due to advancements in additive manufacturing technologies and the rising demand for customized products. Increased global government investments in 3D printing initiatives, along with the availability of a wide range of industrial-grade materials such as metals, polymers, and ceramics, have further accelerated adoption. Key industries, including healthcare, automotive, aerospace, and consumer goods, are leveraging 3D printing for rapid prototyping, personalized production, and mass customization.
TRENDS & DISRUPTIONS IMPACTING CUSTOMERS' CUSTOMERS
The expansion of disruptive additive technologies, which enable faster prototyping, functional part manufacturing, and highly customized production, is driving the impact on customers' businesses in the 3D printing market. Automation, AI integration, and new material innovations, such as composites and biocompatible substrates, are redefining the ecosystem, directly improving cost efficiency, design flexibility, and sustainability.
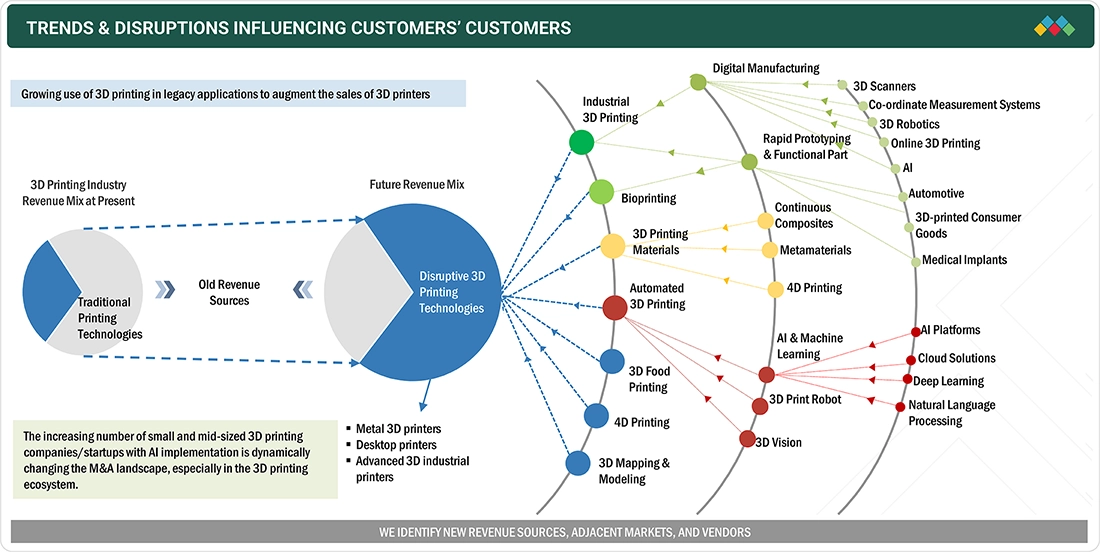
Source: Secondary Research, Interviews with Experts, MarketsandMarkets Analysis
MARKET DYNAMICS
Level
-
Ease in manufacturing of customized products

-
Reduction in manufacturing costs and process downtime

Level
-
Lack of standardized testing methods to verify mechanical properties of 3D printing materials and high raw material costs

-
Inadequate design and process control data due to lack of printing material specifications

Level
-
Increasing demand for medical products and supplies in post-pandemic scenario

-
Rapid advancements in printing technologies and materials and development of knowledge and skill progression frameworks

Level
-
Ensuring consistent quality of final 3D-printed product with repeatable and stable production processes

-
Threat of copyright infringement

Source: Secondary Research, Interviews with Experts, MarketsandMarkets Analysis
Driver: Ease in manufacturing of customized products
3D printing enables the manufacturing of personalized products according to individual needs and requirements. 3D printing companies provide customized services such as basic design development by designers, allowing customers to co-design the product. Ongoing technological advancements in existing 3D printing technologies, reduced printer costs, and the availability of various materials have enabled the easy manufacturing of customized products.
Restraint: Lack of standardized testing methods to verify mechanical properties of 3D printing materials and high raw material costs
The 3D printing market faces restraints due to high raw material costs and the lack of standardized testing methods. Materials used in 3D printing are limited and costly, and require high purity, making production expensive. Moreover, the absence of standardized methods to verify mechanical properties affects accuracy, reproducibility, and reliability, thereby hindering large-scale adoption across industries.
Opportunity: Increasing demand for medical products and supplies in post-pandemic scenario
The post-pandemic surge in demand for medical products has created strong opportunities for 3D printing. Its flexibility enables rapid prototyping, localized manufacturing, and personalized medical solutions, reducing supply chain risks and improving patient outcomes. Innovations like GMP-produced pharma inks highlight their role in producing customized medicines, ensuring healthcare systems remain resilient, agile, and better prepared for evolving needs.
Challenge: Ensuring consistent quality of final 3D-printed product with repeatable and stable production processes
A key challenge in 3D printing is ensuring consistent quality and repeatability of final products, especially in aerospace and medical sectors. Limited material options, along with variations in technology, temperature, and pressure, impact precision and performance. These factors make it difficult to achieve stable, reproducible production processes, restricting the scalability of highly customized 3D-printed products.
3D Printing Market: COMMERCIAL USE CASES ACROSS INDUSTRIES
| COMPANY | USE CASE DESCRIPTION | BENEFITS |
|---|---|---|
 |
Industrial and office 3D printing solutions for prototyping, manufacturing aids, and end-use parts across automotive, aerospace, healthcare, and education sectors | Faster product development, cost reduction in prototyping, customization of end-use parts, and improved design flexibility |
 |
Metal and polymer additive manufacturing systems for aerospace, automotive, medical implants, and industrial tooling | High precision manufacturing, lightweight components, complex geometries, and reduced material waste |
 |
Multi Jet Fusion 3D printing for functional prototypes, production parts, and customized products in consumer goods, healthcare, and industrial applications | High-speed production, consistent quality, cost-effective short runs, and scalability for mass customization |
 |
Full-spectrum 3D printing solutions including plastics, metals, and healthcare-specific 3D printing for surgical guides, dental models, and industrial components | Streamlined workflows, improved patient-specific solutions in healthcare, and accelerated product innovation |
 |
Additive manufacturing for aerospace engines, industrial machinery, and energy equipment | Lightweight, high-performance parts, reduced assembly steps, and increased operational efficiency |
Logos and trademarks shown above are the property of their respective owners. Their use here is for informational and illustrative purposes only.
MARKET ECOSYSTEM
The 3D printing ecosystem involves R&D centers & institutes, material providers, software providers, printer providers, service providers, and end users. Each collaborates to advance the market by sharing knowledge, resources, and expertise to attain end innovation in this field. Manufacturers, such as Stratasys (US), EOS GmbH (Germany), HP Development Company, L.P. (US), 3D Systems, Inc. (US), and General Electric Company (US), are at the core of the market and are responsible for developing 3D printing offerings for various applications.
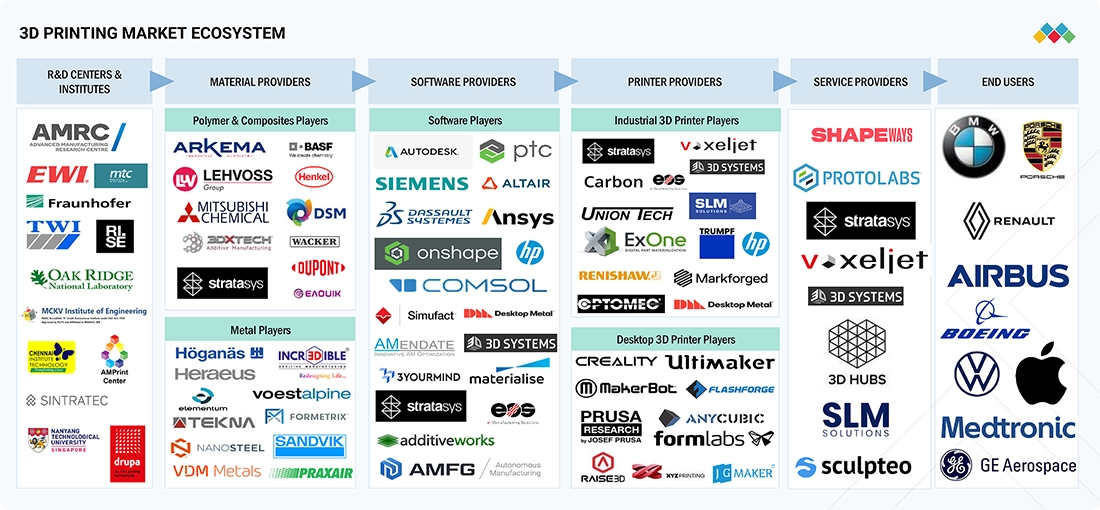
Logos and trademarks shown above are the property of their respective owners. Their use here is for informational and illustrative purposes only.
MARKET SEGMENTS
Source: Secondary Research, Interviews with Experts, MarketsandMarkets Analysis
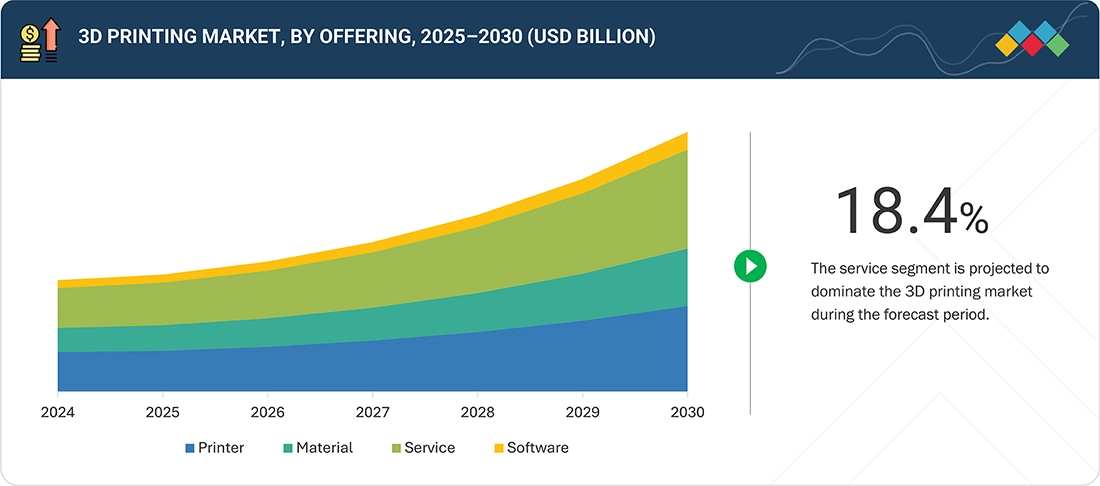
3D Printing Market, by Offering
The 3D printing market's services segment is estimated to account for the largest market share in 2030 as demand for outsourced, on-demand manufacturing grows across various industries. Verticals like healthcare, aerospace, and automotive, which had adopted 3D printing early on, are now using services to optimize capital expenditure and operational complexity. With advancements in printing technologies and the availability of various high-performance materials, businesses are outsourcing design, prototyping, and manufacturing to service providers that provide competitive costs and rapid turnaround. This is particularly valuable for generating customized and intricate components that standard manufacturing cannot readily replicate.
3D Printing Market, by Technology
Stereolithography (SLA) is estimated to grow at a high CAGR in the forecast period due to its ability to deliver exceptional precision, fine detail, and smooth surface finishes, making it ideal for industries like healthcare, dental, and jewelry. Its versatility with photopolymer resins supports a wide range of applications, from functional prototypes to end-use parts. Additionally, advancements in resin formulations and printer affordability are driving wider adoption, further strengthening SLA’s position as a leading 3D printing technology.3D printing automotive market is increasingly used for rapid prototyping, tooling, and production of lightweight, complex components that improve design efficiency and reduce development cycles. It also supports customization, low-volume manufacturing, and faster innovation across vehicle platforms.
3D Printing Market, by Process
Powder bed fusion (PBF) is estimated to account for the largest market share due to its ability to produce complex, high-strength, and lightweight parts with excellent accuracy and durability. Widely adopted in aerospace, automotive, and healthcare, PBF supports metal and polymer materials, enabling functional prototyping and end-use production. Its scalability for industrial applications, compatibility with advanced materials, and continuous improvements in speed and efficiency make it the most dominant 3D printing process for high-performance, mission-critical manufacturing needs.
3D Printing Market, by Application
The functional part manufacturing segment is expected to experience a high CAGR in the 3D printing market due to the significant advancement in printing technology that facilitates the effective, high-volume production of mechanically robust parts. Developments such as continuous liquid interface production (CLIP), high-speed sintering (HSS), and multi-jet printing significantly lower print times, along with increasing design complexity and material compatibility. These technologies enable the production of high-performance components with improved strength, heat tolerance, and longevity, which make them ideal for stressful applications.3D concrete printing is transforming the construction market by enabling automated, faster construction of complex building structures with reduced material waste and labor requirements. The technology supports innovative architectural designs and improves efficiency in residential and infrastructure projects.
3D Printing Market, by Vertical
The automotive vertical is projected to grow at a high rate in the 3D printing market due to rising demand for lightweight, durable, and customized components that enhance fuel efficiency and performance. Automakers are increasingly adopting 3D printing for rapid prototyping, tooling, and even end-use parts, significantly reducing production time and costs. The technology also supports design flexibility for complex geometries and electric vehicle components.
REGION
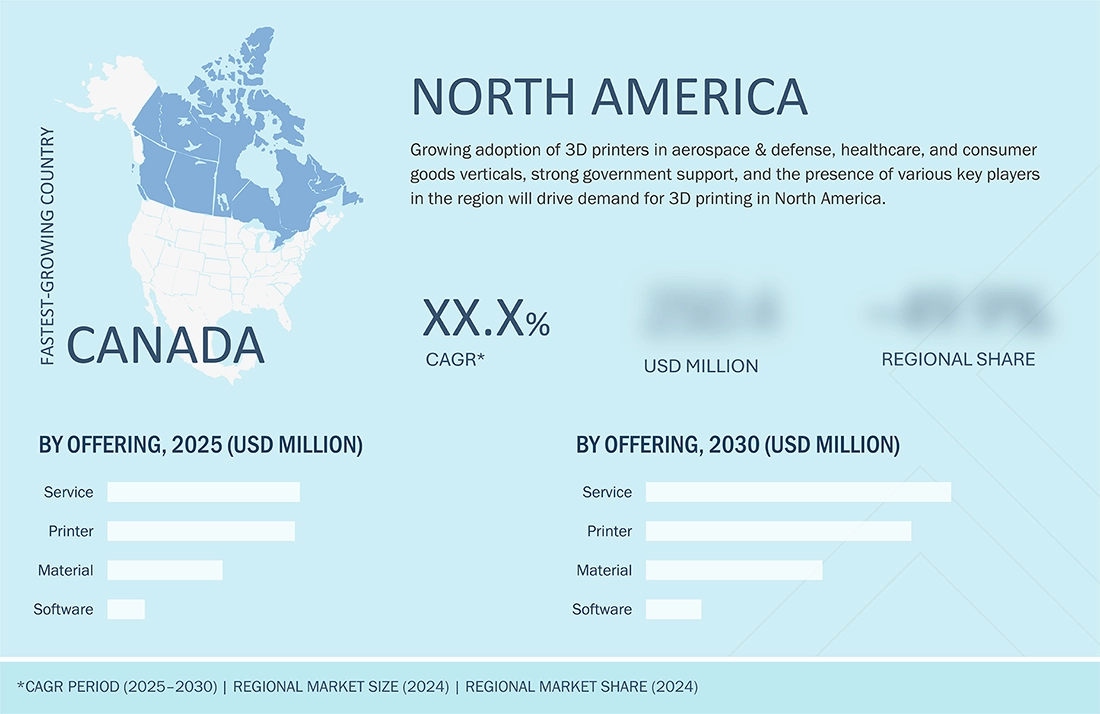
North America to hold largest market share in global 3D printing market during forecast period
North America is projected to be the largest regional market for 3D printing due to its strong ecosystem of technology providers, material suppliers, and early adopters across industries such as aerospace, automotive, healthcare, and consumer goods. The region benefits from significant government and private investments in additive manufacturing research, alongside robust intellectual property frameworks that encourage innovation. Companies like Stratasys, 3D Systems, and GE lead in commercializing advanced 3D printing technologies, particularly in metal and polymer applications.
The Europe 3D printing market is expected to reach USD 9.04 billion by 2030, up from USD 4.40 billion in 2025, at a CAGR of 15.5% from 2025 to 2030. Market expansion is fueled by increasing adoption of additive manufacturing in the aerospace, automotive, and healthcare sectors, along with rising demand for customized, lightweight parts. Moreover, advancements in metal 3D printing, the growing industrial digitization under Industry 4.0, and significant government funding for manufacturing innovation and sustainability are boosting the adoption of 3D printing technologies across Europe.
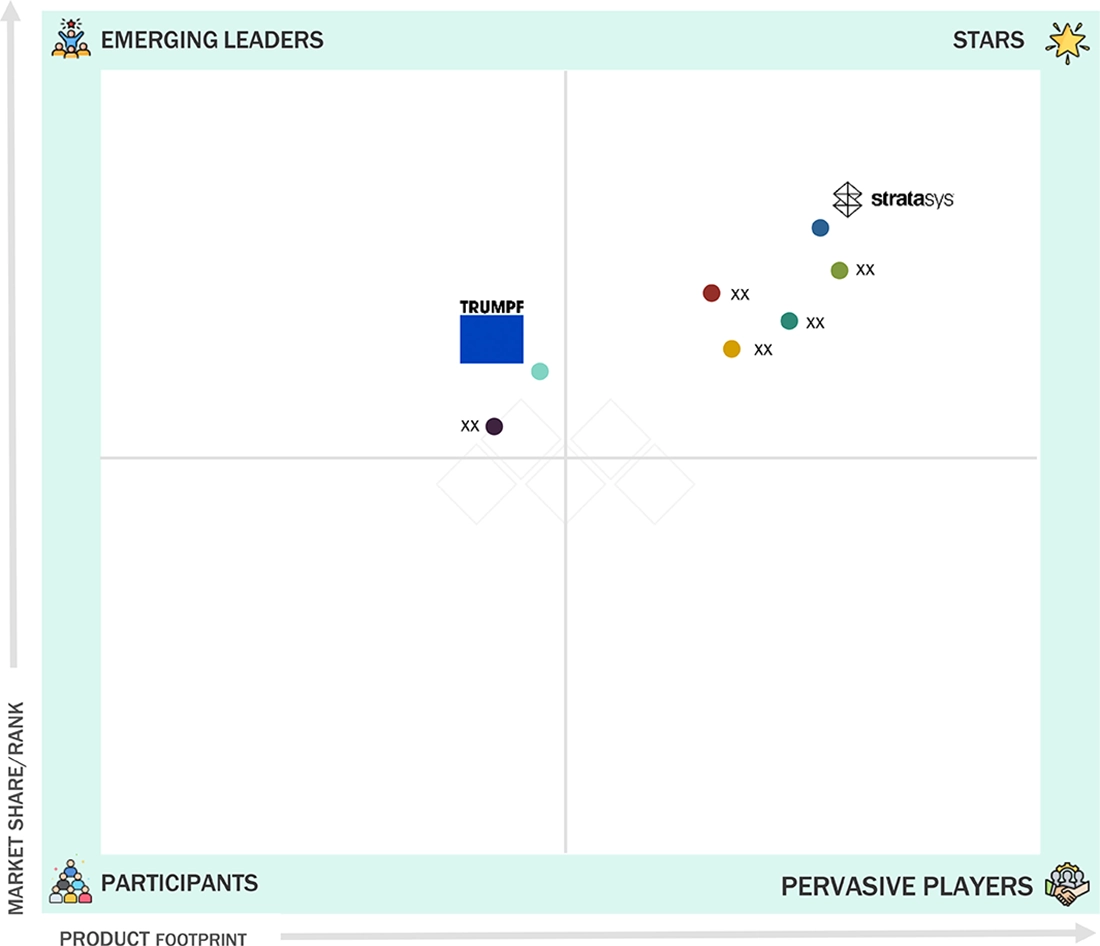
3D Printing Market: COMPANY EVALUATION MATRIX
In the 3D printing market matrix, Stratasys (Star) leads with a strong market share and broad product portfolio, driven by its expertise in polymer 3D printing solutions, extensive customer base, and wide adoption across industries such as healthcare, aerospace, and automotive. TRUMPF (Emerging Leader) is gaining prominence with its advanced metal 3D printing technologies, leveraging its expertise in laser systems to deliver high-performance industrial solutions. While Stratasys dominates through scale and diversified applications, TRUMPF shows strong potential.
Source: Secondary Research, Interviews with Experts, MarketsandMarkets Analysis
KEY MARKET PLAYERS
MARKET SCOPE
| REPORT METRIC | DETAILS |
|---|---|
| Market Size, 2025 (Value) | USD 16.16 Billion |
| Market Forecast, 2030 (Value) | USD 35.79 Billion |
| Growth Rate | CAGR of 17.2% from 2025 to 2030 |
| Years Considered | 2021–2030 |
| Base Year | 2024 |
| Forecast Period | 2025–2030 |
| Units Considered | Value (USD Million/Billion), Volume (Thousand Units) |
| Report Coverage | Revenue Forecast, Company Ranking, Competitive Landscape, Growth Factors, and Trends |
| Segments Covered |
|
| Regions Covered | North America, Asia Pacific, Europe, Rest of the World |
WHAT IS IN IT FOR YOU: 3D Printing Market REPORT CONTENT GUIDE
DELIVERED CUSTOMIZATIONS
We have successfully delivered the following deep-dive customizations:
| CLIENT REQUEST | CUSTOMIZATION DELIVERED | VALUE ADDS |
|---|---|---|
| Industrial OEM (Automotive/Aerospace) |
|
|
| 3D Printer Manufacturer |
|
|
| Material Supplier (Polymers, Metals, Composites) |
|
|
| Healthcare Provider/Medical Device OEM |
|
|
RECENT DEVELOPMENTS
- April 2025 : 3D Systems unveiled three new application-specific 3D printing solutions: the Figure 4 135 platform for high-mix, low-volume production, a process-optimizing module for EXT Titan Pellet printers, and QuickCast Diamond for precision casting. Figure 4 135 offered rapid, tooling-free production with high accuracy, ideal for sectors like electronics, motorsports, and healthcare.
- March 2025 : Stratasys?Ltd unveiled the Neo800+, a large-format SLA 3D printer, at the AMUG conference, later showcased at Rapid?+?TCT. Building on the Neo800, it integrated ScanControl+ to boost print speeds by up to 50%, while maintaining high accuracy. Enhanced features included vacuum protection, Z-stage collision detection, and environmental monitoring, reducing post-processing and improving reliability for aerospace, automotive, and industrial applications.
- June 2024 : Materialise and ArcelorMittal partnered to enhance metal 3D printing using Materialise’s next-gen build processor and ArcelorMittal’s AdamIQ steel powders. The collaboration aimed to optimize laser powder bed fusion (LPBF) by improving speed, quality, and cost-efficiency. This MOU would help develop and validate new applications and alloys for steel additive manufacturing, enhancing productivity and performance.
Table of Contents
 Exclusive indicates content/data unique to MarketsandMarkets and not available with any competitors.
Methodology
The research process for this technical, market-oriented, and commercial study of the 3D printing market included the systematic gathering, recording, and analysis of data about companies operating in the market. It involved the extensive use of secondary sources, directories, and databases (Factiva, Oanda, and OneSource) to identify and collect relevant information. In-depth interviews were conducted with various primary respondents, including experts from core and related industries and preferred manufacturers, to obtain and verify critical qualitative and quantitative information as well as to assess the growth prospects of the market. Key players in the 3D printing market were identified through secondary research, and their market rankings were determined through primary and secondary research. This included studying annual reports of top players and interviewing key industry experts, such as CEOs, directors, and marketing executives.
Secondary Research
In the secondary research process, various secondary sources were used to identify and collect information for this study. These include annual reports, press releases, and investor presentations of companies, as well as whitepapers, certified publications, and articles from recognized associations and government publishing sources. Research reports from a few consortia and councils were also consulted to structure qualitative content. Secondary sources included corporate filings (such as annual reports, investor presentations, and financial statements); trade, business, and professional associations; white papers; Journals and certified publications; articles by recognized authors; gold-standard and silver-standard websites; directories; and databases. Data was also collected from secondary sources, such as the International Trade Centre (ITC) and the International Monetary Fund (IMF).
List of key secondary sources
|
Source |
Web Link |
|
NATIONAL INSTITUTE OF STANDARDS AND TECHNOLOGY |
https://www.nist.gov/additive-manufacturing |
|
US National Science Foundation |
https://new.nsf.gov/funding/opportunities/advanced-manufacturing-am |
|
US Government Accountability Office |
https://www.gao.gov/ |
|
The International Trade Administration, US Department of Commerce |
https://www.trade.gov/ |
|
US Department of Energy |
https://www.energy.gov/ |
|
US Department of Health & Human Services |
https://www.cdc.gov/niosh/index.htm |
|
European Commission |
https://commission.europa.eu/index_en |
|
National Institute of Advanced Industrial Science and Technology (AIST) |
https://www.aist.go.jp/index_en.html |
|
American Society for Testing and Materials (ASTM) |
https://www.astm.org/ |
|
CSA Group Testing & Certification Inc |
https://www.csagroup.org/ |
|
International Electrotechnical Commission (IEC) |
https://www.iec.ch/homepage |
|
The British Standards Institution |
https://www.bsigroup.com/en-IN/ |
|
Ministry of Economy, Trade and Industry |
https://www.meti.go.jp/english/ |
|
Additive Manufacturing Green Trade Association (AMGTA) |
https://amgta.org/ |
Primary Research
Extensive primary research was conducted after understanding and analyzing the 3D printing market scenario through secondary research. Several primary interviews were conducted with key opinion leaders from both demand- and supply-side vendors across four major regions—North America, Europe, Asia Pacific, and RoW. Approximately 30% of the primary interviews were conducted with the demand side, and 70% with the supply side. Primary data was collected through questionnaires, emails, and telephonic interviews. Various departments within organizations, such as sales, operations, and administration, were contacted to provide a holistic viewpoint in the report.

Note: Other designations include technology heads, media analysts, sales managers, marketing managers, and product managers.
The three tiers of the companies are based on their total revenues as of 2023: Tier 1: >USD 1 billion, Tier 2: USD 500 million–1 billion, and Tier 3: USD 500 million.
To know about the assumptions considered for the study, download the pdf brochure
Market Size Estimation
In the complete market engineering process, top-down and bottom-up approaches and several data triangulation methods have been used to estimate and forecast the market size for the overall market segments and subsegments listed in this report. Extensive qualitative and quantitative analyses have been performed on the complete market engineering process to list the key information/insights throughout the report. The following table explains the process flow of the market size estimation.
The key players in the market were identified through secondary research, and their rankings in the respective regions were determined through primary and secondary research. This entire procedure involved the study of the annual and financial reports of top players, as well as interviews with industry experts such as chief executive officers, vice presidents, directors, and marketing executives, for quantitative and qualitative key insights. All percentage shares, splits, and breakdowns were determined using secondary sources and verified through primary sources. All parameters that affect the markets covered in this research study were accounted for, viewed in extensive detail, verified through primary research, and analyzed to obtain the final quantitative and qualitative data. This data was consolidated, supplemented with detailed inputs and analysis from MarketsandMarkets, and presented in this report.
Bottom-Up Approach
- Identifying the entities in the 3D printing market influencing the entire market, along with the related players, including material, printer, software, and service providers
- Analyzing major manufacturers of 3D printing systems, studying their portfolios, and understanding different types of printers, including desktop and industrial ones
- Analyzing the trends pertaining to the use of different types of 3D printers for different kinds of applications, technologies, and processes
- Tracking the ongoing and upcoming market developments, such as investments made, R&D activities, government support, product launches, collaborations, and partnerships, and forecasting the market based on these developments and other critical parameters
- Carrying out multiple discussions with key opinion leaders to understand the different types of printers and materials, services, verticals, technologies, and recent trends in the market, thereby analyzing the breakup of the scope of work carried out by major companies
- Arriving at the market estimates by analyzing revenues of the companies generated from each type of printer, material, software, and service, and then combining the same to get the market estimate
- Segmenting the overall market into various other market segments
- Verifying and cross-checking the estimate at every level from the discussion with key opinion leaders, such as CXOs, directors, and operations managers, and finally with the domain experts in MarketsandMarkets
- Studying various paid and unpaid sources of information, such as annual reports, press releases, white papers, and databases
Top-Down Approach
- Focusing initially on top-line investments and expenditures being made in the ecosystems of the 3D printing market
- Calculating the market size considering the revenues generated by players through the sales of 3D printers, materials, software, and services
- Further segmenting on the basis of R&D and key developments in key market areas
- Further segmenting on the basis of the mapping usage of 3D printing for different applications and verticals
- Building and developing the information related to the revenues generated by players through offerings
- Conducting multiple on-field discussions with key opinion leaders across major companies involved in the development of 3D printing technology
- Estimating the geographic split using secondary sources based on various factors such as the number of players in a specific country and region, the role of major players in the market for the development of innovative products, adoption and penetration rates in a particular country for various end-user applications, government support, investments, and others
3D Printing Market : Top-Down and Bottom-Up Approach

Data Triangulation
After arriving at the overall size of the 3D printing market through the process explained above, the overall market has been split into several segments. Data triangulation procedures have been employed to complete the overall market engineering process and arrive at the exact statistics for all the segments, wherever applicable. The data has been triangulated by studying various factors and trends from both the demand and supply sides. The market has also been validated using both top-down and bottom-up approaches.
Market Definition
Three-dimensional (3D) printing is the process of building a real 3D object from a digital model by joining thin layers of materials (which might be in solid, powder, or liquid forms), usually layer upon layer in horizontal cross-section, unlike subtractive manufacturing methods. It is also known as additive manufacturing (AM) or freeform fabrication. 3D printing is the most common term in the consumer markets, while AM is mainly used in the industrial markets. 3D printing is used for prototyping, tooling, and functional part manufacturing. The manufactured functional parts are used in various verticals, such as automotive, aerospace, healthcare, jewelry, education, tooling, consumer goods, and art & architecture.
Key Stakeholders
- 3D printing product and solution providers
- 3D printing-related service providers
- 3D printing material and accessory providers
- 3D printing consulting companies
- 3D printing assembly companies
- 3D printing software providers
- 3D printing-related associations, organizations, forums, and alliances
- Government and corporate offices
- Venture capitalists, private equity firms, and start-up companies
- Distributors and traders
- End users willing to know more about 3D printing technologies and the latest technological developments in the 3D printing market
Report Objectives
- To define, describe, segment, and forecast the size of the 3D printing market, in terms of offering, technology, process, vertical, application, and region
- To forecast the size of the market segments for four major regions—North America, Europe, Asia Pacific, and RoW
- To give detailed information regarding drivers, restraints, opportunities, and challenges influencing the growth of the market
- To provide a value chain analysis, ecosystem analysis, case study analysis, patent analysis, Trade analysis, technology analysis, pricing analysis, key conferences and events, key stakeholders and buying criteria, Porter’s five forces analysis, investment and funding scenario, and regulations pertaining to the market
- To provide a detailed overview of the value chain analysis of the 3D printing ecosystem
- To strategically analyze micromarkets with regard to individual growth trends, prospects, and contributions to the total market
- To analyze opportunities for stakeholders by identifying high-growth segments of the market
- To strategically profile the key players, comprehensively analyze their market positions in terms of ranking and core competencies, and provide a competitive market landscape.
- To analyze strategic approaches such as product launches, acquisitions, agreements, and partnerships in the 3D printing market.
Available customizations:
With the given market data, MarketsandMarkets offers customizations according to the company’s specific needs. The following customization options are available for the report:
Company Information
- Detailed analysis and profiling of additional market players (up to seven)
Key Questions Addressed by the Report
How big is 3d printing market?
The global 3D printing market was estimated at USD 15.39 billion in 2024 and is predicted to increase from USD 16.16 billion in 2025 to USD 35.79 billion by 2030, expanding at a CAGR of 17.2%. The growth is driven by advancements in additive manufacturing technologies and rising demand for customized products..
What is the market for 3d printing?
The 3D printing market, also known as additive manufacturing, includes technologies, materials, software, and services used to create three-dimensional objects layer by layer from digital designs. The market covers industrial, commercial, and consumer applications across multiple sectors..
Who are the leading players in the global 3D printing market companies?
Leading players operating in the global 3D printing market include Stratasys (US), EOS GmbH (Germany), HP Development Company, L.P. (US), 3D Systems, Inc. (US), and General Electric Company (US).
How is 3D printing used in the healthcare market?
3D printing is used in healthcare to create patient-specific implants, prosthetics, dental devices, and anatomical models, enabling improved customization, better clinical outcomes, and faster medical innovation.
What is the size of the global 3D printing market?
The global 3D printing market is estimated to be valued at USD 16.16 billion in 2025 and reach USD 35.79 billion by 2030, growing at a CAGR of 17.2% from 2025 to 2030.
Need a Tailored Report?
Customize this report to your needs
Get 10% FREE Customization
Customize This ReportPersonalize This Research
- Triangulate with your Own Data
- Get Data as per your Format and Definition
- Gain a Deeper Dive on a Specific Application, Geography, Customer or Competitor
- Any level of Personalization
Let Us Help You
- What are the Known and Unknown Adjacencies Impacting the 3D Printing Market
- What will your New Revenue Sources be?
- Who will be your Top Customer; what will make them switch?
- Defend your Market Share or Win Competitors
- Get a Scorecard for Target Partners

Custom Market Research Services
We Will Customise The Research For You, In Case The Report Listed Above Does Not Meet With Your Requirements
Get 10% Free CustomisationGrowth opportunities and latent adjacency in 3D Printing Market


Erin
Nov, 2016
SWOT analysis Porter's 5 Forces Barriers to Entry. I am a student and cannot afford to buy the full report on 3d printing, your help is appreciated! .
Miguel
Dec, 2016
Interested in finding out about Food and Biomedical printing market. Please send me a cost for the report..
Alejandro
May, 2019
Wish to have a better understanding of the markets and trends for 3D Printing and how they will influence the local Mexican market, needs of plastic materials according to the main markets and growth..
Pete
Jan, 2014
I am interested in knowing the below information- Market sizes, segmentation, and estimated growth. Variety of Healthcare and Building/Industrial product and service categories..
sushant
Apr, 2022
To understand the trajectory of consumer adoption of 3d printing services. Opportunities in consumer side vs B2B segment. .
utkarsh
Apr, 2019
We want to emerge in 3D prototyping industry and want to know the market size and opportunity..
Roy
Sep, 2019
I am looking for an up to date global market reports on 3D printing and conventional injection molding. Can you provide a free sample for reference?.
Marc
Jun, 2019
We are planning to set up an R&D ALM technology platform in Vernon France. I need some market figures to substantiate our claim that Additive manufacturing is a disruptive technology that will affect all manufacturing..
Maximilian
Jun, 2014
We are looking for the 3D printing healthcare market in particular. I want to ask how much the healthcare chapter would cost and whether it would be possible to buy it separate from the rest of the report. We are looking for the market size of the 3D printing healthcare market (some numbers, growth rates etc.). If you could contact me tomorrow right away that would be more than awesome..
Heddy
May, 2019
I am a communication and marketing intern at IMCD. I would like to request a pdf brochure of 3D printing as part of my assignment..
william
Mar, 2019
I am writing a report as part of my part time degree at university, as part of the business side of the degree. I have to write a report on a business. I have chosen a 3D printing business and require information regarding the growth of the market and sustainability etc..
Josef
Apr, 2019
I am very interested in how you have developed its 3D printing report - about 5 years ago I didn't have such a good experience with one of your reports..
Natalia
Nov, 2015
I'm interested on this chapters: 5.4.2 Market Restraints 5.4.2.1 Issues Related to Material Availability, Cost, Quality, Development & Validation, Standardization, and Characterization 5.4.2.1.1 Material Availability & Cost 5.4.2.1.2 Material Development & Validation 5.4.2.1.3 Material Standardization & Characterization 5.4.2.1.4 Material Quality 5.4.2.2 Lack of Standardized Equipment and Process Control .
Nirmal
Jun, 2016
I am currently studying my MBA. I am writing a thesis on the 3d printing industry. Due to my budget constraints, is there any possibility of getting the market info on the filaments section as well as market data on the paints that could be applied to 3D printed objects ( DIY 3d printed object paints)? Any information would be really helpful..
Fahima
May, 2019
We are a team that research about Holographic 3D printing. We need some help about product development, potential customer segment, SLA 3D printing limitations, Resin or photo polymer. Please provide a pdf brochure of the report..
Alexey
Apr, 2019
There is the need for researching market of 3D-Printing of our time for developing new technologies which improves product of 3D-printers. Can I get a pdf brochure of 3D printing report?.
Matthew
Nov, 2017
I would be particularly interested in the information related to the applications of 3D printing in the healthcare setting.
Helena
Apr, 2016
I am interested in the following - 1. Applications of 3D printing, especially in medicine. 2. Expected social changes induced by 3D printing. .
Adam
Feb, 2014
I am interested in what the report has to say about the market for 3D printers that print metal for a project I am working on..
Sandra
Aug, 2014
I am doing some research into the competitive landscape of 3D printing and would be grateful if you can clarify whether your report has some of the data I am looking for . Primarily, I am looking for: - Total 3D Printing market segmented by technology (revenue and units) - Each technology segmented by company (e.g. how what % of the total FDM market revenue was Strategy) - Total 3D Printing market segmented by company (revenue and units) - Competitive offering analysis by company? I know your table of contents mentions some of the above, but if you can confirm which of the above you have that would be great..
Harb
Sep, 2019
Trying to learn about both technologies and market size related Metal Additive Manufacturing industry. Any more information will be helpful..
Harb
Sep, 2019
Trying to learn about both technologies and market size related Metal Additive Manufacturing industry. Any more information will be helpful..
Max
Sep, 2019
I am writing content for 3D Printed Talent's new website and would like to gain valuable statistics on the AM industry, in particular the employment aspects. From reading the abstract there is a lot here that is relevant to my needs..
jorge
Jan, 2016
Can I get more information about the emerging technologies and trends in the 3D printing market?.
Carlos
Nov, 2013
I am interested in the following chapters of the 3d printing report: SLS and EBM (metal additive manufacturing) in medical sector, mainly orthopedic applications, USA, rest of America, EU, Asia-Pacific, ROW..
Meike
Mar, 2016
I'm interested in the size of EBM market as for this technology vacuum is needed. It would be very helpful if you could send me a sample of this report..
Dan
Mar, 2020
I am studying the 3D Printing market and would like to know the market size for the US. Also, is there a secondary market for used equipment?.
Antonio
Jun, 2019
I am currently working on a project to define the overall strategy for HP MJP in the US. I would like access to this information on 3d printing to get a overall view and do a benchmark analysis about the opportunities we might have in the US..
Nicole
Feb, 2019
Do you provide the 3D printing report only for specific chapters? I am interested in the Application and Geography chapter of the report..
Anthony
Dec, 2018
I'm doing a broad research on the 3D printing market and therefore I'm interested in your 230 pages document about it..
Antonio
Dec, 2019
I am doing a market research and benchmark analysis in order to define the 3D printing strategy for HP in Latam. Can you share a PDF copy of this report?.
Michael
Dec, 2014
I am looking for the following information: Market Size and Number of Machines (Projection) for 3D Printing concepts that use Energy Curing (UV). Preferably specific to Polymer-Type concepts.
Joffrey
Nov, 2013
I'm interested in theses chapters: 4. 3D Printing Market Overview 7. 3D Printing Market By Application 9. Competitive Landscape.
Kavitha
Nov, 2015
I am looking to have analysis of the market in Middle-East 1. Advanced manufacturing (with a specific focus on 3D printing) 2. Applied mechanics 3. Automotive: Smart Materials, Adaptive Structures and Intelligent Systems 4. Bioengineering: Nano engineering for Medicine and Biology 5. Design engineering 6. Energy: Renewable, Solar, Sustainability, Transition 7. Gas Turbines 8. Hydraulic fracturing 9. Mechatronics .
Prabir
Nov, 2015
Material Characterization and Component qualification. Interested in seeing samples of chapter 3, and sections 5.3, 7.4, 7.5, and 8.3 of 3D printing market report.
Yasser
Nov, 2014
Thank you for sending a free sample of the most economical 3D printers market in The UK and GCC countries.
Giulia
Oct, 2015
I am interested in knowing the areas of interest of major companies operating with 3D printing technology, in particular fashion and fabric development..
rania
Oct, 2014
In addition to the list above, I am interested in information about the 3d printing services market, bureaus sales and competition, service bureaus challenges for getting clients, opportunities for providing services etc..
Nikolai
Sep, 2017
We provides prototyping, 3D printing, and manufacturing services for its PCB design and 3D modeling. We are interested in this report on 3D printing and would like to get more information about the same..
J�rg
Sep, 2019
Is it possible to have a sample of the 3D printing report to see if it is suitable for us?.
chinthaka
Sep, 2016
I have an interest to know the said , hence send me necessary details for me to commence with the requirements. Will it cost more than $ 5000 ? Request details of all type of printing by 3 D system. .
Daniel
Sep, 2014
I am specifically interested in 3D/FDM substrate markets by polymer type and converter or producer of filament..
Frederik
Sep, 2019
I'm writing my bachelor thesis about the impact of 3D-Printing on the existing supply chains and I would like to ask if I can get a free copy of the report "3D Printing Market by Offering (Printer, Material, Software, Service), Process (Binder Jetting, Direct Energy Deposition, Material Extrusion, Material Jetting, Powder Bed Fusion), Application, Vertical, Technology, and Geography - Global Forecast to 2024". If you need any further information don't hesitate to contact me..
Malek
Aug, 2019
We are opening a new line of 3d printing and additive manufacturing in the Middle East especially in Lebanon. Can I get a free sample of this report?.
Andreas
Aug, 2014
I am interested in 3D printing market data concerning thermoplastics material use. More concretely, I am interested in polyolefin (polypropylene, polyethylene). Do you have any market data that breaks down the thermoplastics used? In addition, do you have information about further trends in this regard?.
Pratyaksh
Aug, 2019
I am interested in the following - 1. Scalability with Additive Manufacturing 2. Durability of materials as far as industrial-grade fasteners are concerned 3. Supply side considerations..
Manolo
Aug, 2019
We are about to carry out a market scouting 2019 for additional 3D manufacturers and service providers both for metallic and non-metallic. A market scouting was already carried out in 2016 and we want to get an update..
Andy
Jul, 2014
We have 3D printers which make sand moldings to produce metal castings in short lead time. I would like to have the market size and volume for prototyping parts in industrial and energy industries..
Bradley
Jul, 2016
Is it possible to purchase just the following tables from the report? Table 69 Market, By Service, 2014�2022 (USD Million) Table 70 3D Printing Services Market, By Technology, 2014�2022 (USD Million) Table 71 3D Printing Services Market, By Vertical, 2014�2022 (USD Million) Table 72 3D Printing Services Market, By Application, 2014�2022 (USD Million) Table 73 3D Printing Services Market, By Region, 2014-2022.
Anthony
Jul, 2019
I'm looking for the biggest players in the 3D consumer printing materials market because I may be interested in selling 3D consumer printing materials..
Dipl.-Ing..Feyyaz
Jun, 2016
I am a PHD student and my topic of research is related to 3D printing. Do you provide a free sample of this report?.
Markus
May, 2019
As a board member of a start-up company I would like to get a high-level overview about the 3D printing market, in particular about the North America and Europe regions..
Cornelius
May, 2019
Wanting to find some statistics for projected growth of the 3D printing market, both in general and with regards to specific technologies, as well as key growth industries. .
R.VISHNUVARDHAN
May, 2017
We are interested to continue with your support for our research on 3D-printing. Our institute is entitled with well furnished "RESEARCH AND DEVELOPMENT CENTER" . We are expecting a sample of 'PLA, Aluminum filament from you. If it gives better result than the earlier one's, we are ready to get all the filaments from your company..
Dr.
May, 2017
We are interested to step forward with your support to do our research on 3D-printing, our institute is entitled with well furnished "RESEARCH AND DEVELOPMENT CENTER" we are expecting a sample of 'CARBON FIBER OR Aluminum filament from you. If it gives better result than the earlier one's, we are ready to get all the filaments from your company..
User
Apr, 2020
kindly provide some sales strategy for 3d printer sales.
Keaton
Apr, 2019
Looking to start a business in the 3D printing market and need information about the market as a whole to determine whether or not the business plan is viable..
Sarah
Apr, 2019
I am a graduate student working on a marketing plan for an additive manufacturing company. Do you provide free samples of reports?.
Sarah
Apr, 2019
Searching for detailed information on the additive manufacturing market to assess the viability of a new market entrant. Having access to your extensive research as soon as possible would be extremely helpful. .
rakesh
Apr, 2015
I want to explore the 3D printing Market, different technology, different applications, limitations of process machines and materials. Also, I want to know the global forecast especially Indian market. Economics of 3D printing..
Volker
Apr, 2014
Do you provide only country specific data for 3D printing report?.
jochen
Mar, 2019
I am involved in development of polymers for SLA, DLP, Polymer Solutions, create new application Areas and optimize characteristics of 3D printed object towards longer lifetime and stability/reliability. Please provide a sample for this report..
Jorge
Mar, 2016
I want to know the potential for 3d Printing and services in Colombia, South America. I am looking for partnerships..
Dmitry
Feb, 2018
We have task in university course to write short article about market share of 3D printing. Can you share some information?.
Roberto
Feb, 2019
I'm currently studying the market of 3D printing in Puerto Rico and the United States and I want to know the number of people uses 3D Printing for hobby or home use. .
Tim
Feb, 2019
I oversee the world's first additive manufacturing & design graduate program and teach 3D printing/additive manufacturing courses. I want to make sure that our courses and graduates are aligned to meet the demands that you (and others) are forecasting. Can I get a sample of the report?.
Rushana
Jan, 2018
I want to know more about 3D printing technology and latest technological developments in the 3D printing market..