Advanced Process Control Market by Revenue Source (Software And Services), Application (Oil & Gas, Petrochemicals, Water & Wastewater, Chemicals, Power, Paper & Pulp, Pharmaceuticals, Food) And By Geography- Analysis & Forecast (2014 � 2020)


The advanced process control (APC) encompasses a broad range of sophisticated technologies and tools that are used to optimize plant performances across a range of applications. The advanced process control market comprises of APC software and related services .The overall application market is comprised primarily of process industries where APC tools are used to optimize plant performance.
The major market for advance process control is considered to be in APAC, however ROW and North America are growing at a high CAGR. The application market for advanced process control can be divided into oil and gas, petrochemicals, water & wastewater, chemicals, power, paper & pulp, pharmaceuticals, food & beverages, and others. Oil and gas accounts highest market size in advanced process control market and this trend is expected to continue during the forecasted period.
The report provides the profile of major companies in the advanced process control market. The report also provides the competitive landscape of the key players, which indicates the growth strategy in the market. The report covers the entire value chain for the market which includes an in-depth view on the software & services, and application market. The advanced process control market is expected to reach $1,465.62 million by 2020, at a CAGR of 11.79% from 2014 to 2020.
The advanced process control market report provides the market dynamics like drivers, restraints, and opportunities. Apart from the market segmentation, the report also includes critical market data and qualitative information for each application, along with the qualitative analysis, such as the Porter�s five force analysis, value chain analysis, and market crackdown analysis.
The major players in the advanced process control market include: ABB Ltd. (Switzerland), Aspen Technology, Inc. (U.S.), Emerson Electric Co. (U.S.), General Electric Co. (U.S.), Honeywell International, Inc. (U.S.), Rockwell Automation, Inc. (U.S.), Rudolph Technologies, Inc. (U.S.), and Schneider Electric SE (France), among others. The detailed explanation of the different market segments is given below:
Market by Revenue Source:
The advanced process control market, by revenue generator, is segmented into APC software, and APC services.
Market by application:
The major applications of advanced process control include oil and gas, petrochemicals ,water & wastewater, chemicals, power, paper & pulps, pharmaceuticals, food & beverages, and others (mining and cement).
Market by geography:
The market is segmented by geography into four different regions; namely North America (U.S., Canada, and Mexico), Europe (France, Germany, U.K., Russia, and Others), APAC (China, India, Indonesia, Malaysia, Japan, and Others), and the Rest of the world (Middle East, Africa and South America).
Advanced process control (APC) encompasses a broad range of sophisticated technologies and tools that are used to optimize plant performances across a range of applications. It is used to optimize plant performance and stabilize plant operations by minimizing the fluctuations of key process variables. Today, APC technology is available all across the globe and is being increasingly used in new applications apart from its conventional use in oil & gas and petrochemical industry.
Advanced process control has several advantages like improved production capacity, minimized power consumption, lower feedstock variability to downstream units, better analysis and modification of operating objectives as per new requirements, improved monitoring of key performance indicators, increased process safety, reduction in process setting time, increase in equipment reliability, and better operational understanding of the entire plant over conventional process control technology. Use of advanced process control software allows monitoring of process parameters at a granular level as compared to normal process control technology. This allows for better monitoring of process parameters and helps in predictive maintenance of the system. With more stability, all plant equipment can be operated efficiently, leading to an increase in the production capacity and thus, plant profitability. However, these economic benefits can only be sustained by periodic maintenance and up-gradation of the system. In fact, APC services form the major revenue source for advanced process control vendors.
This report describes the market trends, drivers, and challenges for the advanced process control market and forecasts the market from 2014 to 2020 on the basis of revenue generator, applications, and geography. The factor which is driving the advanced process control market includes rising demand for energy efficient production process, safety and security concern, and demand for a software systems which can predict the failure at the component level.
Advanced Process Control Market 2014 - 2020
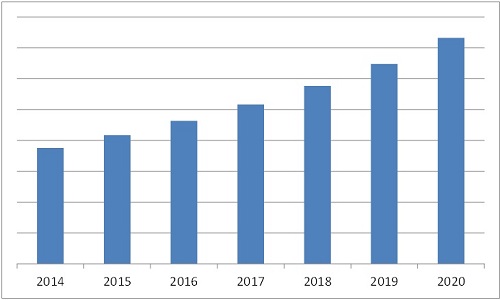
Source: MarketsandMarkets
The advanced process control market is expected to increase at a CAGR of 11.79% from 2014 to 2020. Oil and gas industry is the major application market of advanced process control. It accounts a market share of ~30% during 2013 and is expected to grow at a CAGR of 12.81% from 2014 to 2020. With the development of shale gas it has become important to implement advanced process control systems which can help in minimizing the capital expenditure, operating expenditure, and any other negative impact on the environmental by automating the entire production process. Implementation of advanced process control can virtually eliminate the involvement of human and thus it reduces the risk of safety at production floor. APAC dominates the advanced process control market in terms of revenue generation with a highest market share of ~26% in 2013; growing at a CAGR of 11.85% from 2014 to 2020. India and China market with regards to market accounts a collective market share of ~54% during 2013.
The major players involved in the development of advanced process control market include: ABB Ltd. (Switzerland), Aspen Technology, Inc. (U.S.), Emerson Electric Co. (U.S.), General Electric Co. (U.S.), Honeywell International, Inc. (U.S.), Rockwell Automation, Inc. (U.S.), Rudolph Technologies, Inc. (U.S.), and Schneider Electric SE (France).
 Exclusive indicates content/data unique to MarketsandMarkets and not available with any competitors.
Table of Contents
1 Introduction (Page No. - 14)
1.1 Objectives of the Study
1.2 Advanced Process Control Market Definition
1.3 Study Scope
1.3.1 Market Covered
1.3.2 Years Considered for the Study
1.4 Currency & Pricing
1.5 Distribution Channel Participants
1.6 Limitations
1.7 Stakeholders
2 Research Methodology (Page No. - 18)
2.1 Research Data
2.1.1 Secondary Data
2.1.1.1 Key Data From Secondary Sources
2.1.2 Primary Data
2.1.2.1 Key Data From Primary Sources
2.1.2.2 Key Industry Insights
2.1.2.3 Breakdown of Primaries
2.2 Factor Analysis
2.2.1 Introduction
2.2.2 Demand-Side Analysis
2.2.2.1 Growth in Oil Production
2.2.2.2 Increase in Natural Gas Production
2.2.2.3 Increase in Electricity Generation
2.2.3 Supply-Side Analysis
2.2.3.1 Less Number of APC Experts
2.2.3.2 Difficulty in Selling APC Software
2.3 Market Size Estimation
2.3.1 Bottom-Up Approach
2.3.2 Top-Down Approach
2.4 Market Breakdown & Data Triangulation
2.5 Research Assumptions and Limitations
2.5.1 Assumptions
2.5.2 Limitations
3 Executive Summary (Page No. - 30)
4 Premium Insights - Advance Process Control Market (Page No. - 34)
4.1 Advanced Process Control Market, 2014-2020 ($Million)
4.2 APC Market- Top Three Application Segments
4.3 APC Market in Different Regions
4.4 APC Market, By Country
4.5 APC Market, By Application
4.6 APC Market, By Revenue Source
5 Market Overview (Page No. - 37)
5.1 Introduction
5.2 Evolution
5.3 Market Segmentation
5.3.1 APC Advanced Process Control Market, By Application
5.3.2 APC Advanced Process Control Market By Revenue Source
5.3.3 APC Advanced Process Control Market By Geography
5.4 Market Dynamics
5.4.1 Drivers
5.4.1.1 Rising Demand for Energy Efficient Production Process is Expected to Create A Demand for APC Systems
5.4.1.2 Rising Safety and Security Concerns Are Expected to Boost the Demand of APC Systems
5.4.1.3 Demand for A Software System Which Can Predict Failure at the Component Level
5.4.1.4 Changing Workforce is Expected to Increase the Demand of APC Systems
5.4.1.5 Increasing Importance of Regulatory Compliance is Expected to Boost the Demand APC Systems
5.4.1.6 Implementation of APC Has Become Inevitable for Manually Uncontrollable Processes
5.4.1.7 Availability of Sophisticated Tools Allows Measurement and Storage of Critical Data for APC
5.4.2 Restraints
5.4.2.1 Improper Or Non-Maintenance of APC is Expected to Diminish the Profits
5.4.2.2 Lack of Data Control is Hampering the Implementation of APC Systems
5.4.3 Opportunities
5.4.3.1 Faster Implementation of Software With Ease of Maintenance
5.4.3.2 Improving Data Accuracy Can Improve the Performance of the Overall System
5.4.4 Challenge
5.4.4.1 Implementation Cost of the APC is Higher
5.4.5 Burning Issue
5.4.5.1 Acceptance From Operator Before APC Implementation
6 Industry Trend (Page No. - 47)
6.1 Introduction
6.2 Value Chain Analysis
6.3 Porter�s Five Forces Analysis
6.3.1 Competitive Rivalry
6.3.2 Threat of Substitutes
6.3.3 Bargaining Power of Buyers
6.3.4 Bargaining Power of Suppliers
6.3.5 Threat of New Entrants
6.4 Strategic Benchmarking
6.4.1 Development of New Products and Upgrading Existing Products
6.4.2 Growth Strategies
7 Market Analysis, By Revenue Source (Page No. - 54)
7.1 Introduction
7.2 Software
7.2.1 Standalone APC Software
7.2.2 Customized APC Software
7.2.3 Types of APC
7.2.3.1 Advanced Regulatory Control
7.2.3.2 Multivariable Model Predictive Control
7.2.3.3 Inferential Control
7.2.3.4 Sequential Control
7.2.3.5 Compressor Control
7.3 Services
8 Market Analysis, By Application (Page No. - 67)
8.1 Introduction
8.2 Oil and Gas
8.3 Petrochemicals
8.4 Water & Wastewater
8.5 Chemicals
8.6 Power
8.7 Paper and Pulp
8.8 Pharmaceuticals
8.9 Food & Beverages
8.10 Others
9 Geographic Analysis (Page No. - 82)
9.1 Introduction
9.2 North America
9.2.1 U.S.
9.2.2 Canada
9.2.3 Mexico
9.3 Europe
9.3.1 France
9.3.2 Germany
9.3.3 U.K.
9.3.4 Russia
9.3.5 Others
9.4 APAC
9.4.1 China
9.4.2 India
9.4.3 Indonesia
9.4.4 Malaysia
9.4.5 Japan
9.4.6 Others
9.5 ROW
9.5.1 Middle East
9.5.2 Africa
9.5.3 South America
10 Competitive Landscape (Page No. - 108)
10.1 Overview
10.2 Advanced Process Control Market Share Analysis, APC Market
10.3 Competitive Situation and Trends
10.3.1 New Product Launches and Product Upgrades
10.3.2 AGreements, Contracts, and Alliances
10.3.3 Mergers and Acquisitions
10.3.4 Expansions and Technology Acquisitions
10.3.5 Other Developments
11 Company Profiles (Page No. - 116)
11.1 Introduction
(Overview, Financials, Products & Services, Strategy, and Developments)*
11.2 ABB Ltd.
11.3 Aspen Technology, Inc.
11.4 Emerson Electric Co.
11.5 General Electric Co.
11.6 Honeywell International, Inc.
11.7 Rockwell Automation, Inc.
11.8 Rudolph Technologies, Inc.
11.9 Schneider Electric SE
11.10 Siemens AG
11.11 Yokogawa Electric Corp.
*Details on Overview, Financials, Product & Services, Strategy, and Developments Might Not Be Captured in Case of Unlisted Companies.
12 Appendix (Page No. - 157)
12.1 Insights of Industry Experts
12.2 Discussion Guide
12.3 Introducing RT: Real Time Market Intelligence
12.4 Available Customizations
12.5 Related Reports
List of Tables (71 Tables)
Table 1 Rising Demand for an Energy Efficient Production Process is Expected to Boost the Growth of APC Technology
Table 2 Improper Maintenance of APC is Expected to Diminish the Benefits
Table 3 Data Accuracy is Expected to Boost the Performance
Table 4 Cost of Deploying APC is Expected to Be A Challenge for the End Users
Table 5 Advanced Process Control Market Size, By Revenue Source, 2013-2020 (Million) 55
Table 6 APC Software Market Size, By Application, 2013-2020 ($Million)
Table 7 APC Software Market Size, By Region, 2013-2020 ($Million)
Table 8 APC Software Market Size, By North America, 2013-2020 ($Million)
Table 9 APC Software Market Size, By Europe, 2013-2020 ($Million)
Table 10 APC Software Market Size, By APAC, 2013-2020 ($Million)
Table 11 APC Software Market Size, By ROW, 2013-2020 ($Million)
Table 12 APC Services Market Size, By Application, 2013-2020 ($Million)
Table 13 APC Services Market Size, By Region, 2013-2020 ($Million)
Table 14 North America: APC Services Market Size, By Country, 2013-2020 ($Million) 64
Table 15 Europe: APC Services Market Size, By Country, 2013-2020 ($Million)
Table 16 APAC: APC Services Market Size, By Country, 2013-2020 ($Million)
Table 17 ROW: APC Services Market Size, By Region, 2013-2020 ($Million)
Table 18 Market Size, By Application, 2013-2020 ($Million) 68
Table 19 Oil and Gas Market Size, By Revenue Source, 2013-2020 ($Million)
Table 20 Oil and Gas Market Size, By Region, 2013-2020 ($Million)
Table 21 Petrochemicals Market Size, By Revenue Source, 2013-2020 ($Million)
Table 22 Petrochemicals Market Size, By Region, 2013-2020 ($Million)
Table 23 Water & Wastewater Market Size, By Revenue Source, 2013-2020 ($Million) 72
Table 24 Water & Wastewater Market Size, By Region, 2013-2020 ($Million)
Table 25 Chemicals Market Size, By Revenue Source, 2013-2020 ($Million)
Table 26 Chemicals Market Size, By Region, 2013-2020 ($Million)
Table 27 Power Market Size, By Revenue Source, 2013-2020 ($Million)
Table 28 Power Market Size, By Region, 2013-2020 ($Million)
Table 29 Paper & Pulp Market Size, By Revenue Source, 2013-2020 ($Million)
Table 30 Paper & Pulp Market Size, By Region, 2013-2020 ($Million)
Table 31 Pharmaceuticals Market Size, By Revenue Source, 2013-2020 ($Million)
Table 32 Pharmaceuticals Market Size, By Region, 2013-2020 ($Million)
Table 33 Food & Beverages Market Size, By Revenue Source, 2013-2020 ($Million)
Table 34 Food & Beverages Market Size, By Region, 2013-2020 ($Million)
Table 35 Others Application Market Size, By Revenue Source, 2013-2020 ($Million) 81
Table 36 Others Application Market Size, By Region, 2013-2020 ($Million)
Table 37 Market Size, By Region, 2013-2020 ($Million)
Table 38 U.S.: Advanced Process Control Market Size, By Revenue Source, 2013-2020 ($Million)
Table 39 Canada: Advanced Process Control Market Size, By Revenue Source, 2013-2020 ($Million)
Table 40 Mexico: Market Size, By Revenue Source, 2013-2020 ($Million)
Table 41 North America: Market Size, By Country, 2013-2020 ($Million)
Table 42 North America: Market Size, By Revenue Source, 2013-2020 ($Million) 89
Table 43 North America: Advanced Process Control Market Size, By Application, 2013-2020 ($Million)
Table 44 France: Market Size, By Revenue Source, 2013-2020 ($Million)
Table 45 Germany: Market Size, By Revenue Source, 2013-2020 ($Million)
Table 46 U.K.: Market Size, By Revenue Source, 2013-2020 ($Million)
Table 47 Russia: Advanced Process ControlMarket Size, By Revenue Source, 2013-2020 ($Million)
Table 48 Other Countries: Market Size, By Revenue Source, 2013-2020 ($Million) 94
Table 49 Europe: Market Size, By Country, 2013-2020 ($Million) 94
Table 50 Europe: Market Size, By Revenue Source, 2013-2020 ($Million)
Table 51 Europe: Market Size, By Application, 2013-2020 ($Million)
Table 52 China: Advanced Process ControlMarket Size, By Revenue Source, 2013-2020 ($Million)
Table 53 India: Market Size, By Revenue Source, 2013-2020 ($Million)
Table 54 Indonesia: Market Size, By Revenue Source, 2013-2020 ($Million)
Table 55 Malaysia: Market Size, By Revenue Source, 2013-2020 ($Million)
Table 56 Japan: Advanced Process ControlMarket Size, By Revenue Source, 2013-2020 ($Million)
Table 57 Other Countries: APC Market Size, By Revenue Source, 2013-2020 ($Million) 101
Table 58 APAC: APC Market Size, By Country, 2013-2020 ($Million) 101
Table 59 APAC: APC Market Size, By Revenue Source, 2013-2020 ($Million)
Table 60 APAC: APC Market Size, By Application, 2013-2020 ($Million)
Table 61 Middle East: Market Size, By Revenue Source, 2013-2020 ($Million)
Table 62 Africa: Market Size, By Revenue Source, 2013-2020 ($Million)
Table 63 South America: Market Size, By Revenue Source, 2013-2020 ($Million) 105
Table 64 ROW: Market Size, By Region, 2013-2020 ($Million) 105
Table 65 ROW: Market Size, By Revenue Source, 2013-2020 ($Million)
Table 66 ROW: Market Size, By Application, 2013-2020 ($Million)
Table 67 New Product Launches and Product Upgrades, 2012 - 2014
Table 68 Agreements, Contracts, and Alliances, 2012-2014
Table 69 Mergers and Acquisitions, 2012-2014
Table 70 Expansions and Technology Acquisitions, 2012-2014
Table 71 Other Developments, 2011-2014
List of Figures (89 Figures)
Figure 1 APC Market, By Application
Figure 2 Research Design
Figure 3 Oil Production (Thousand Barrels Per Day)
Figure 4 Oil Production in 2013 Across By Geography (%)
Figure 5 Natural Gas Production (Billion Cubic Meters)
Figure 6 Natural Gas Production in 2013 By Geography (%)
Figure 7 Electricity Generation (Terawatt-Hours)
Figure 8 Electricity Generation in 2013 By Geography (%)
Figure 9 Market Size Estimation Methodology: Bottom-Up Approach
Figure 10 Market Size Estimation Methodology: Top-Down Approach
Figure 11 Data Triangulation
Figure 12 Assumptions of the Research Study
Figure 13 Limitations of the Study
Figure 14 Advanced Process Control Market Size, 2013-2020 ($Million)
Figure 15 Power Sector Will Drive the APC Market During the Forecast Period
Figure 16 Power and Water & Wastewater Are High Potential Application Areas
Figure 17 APAC Accounts Largest Market Share in 2014
Figure 18 Attractive Market Opportunities in the APC Market
Figure 19 Power is Expected to Grow at the Fastest CAGR Among All the APC Applications
Figure 20 Oil and Gas Application Accounts for the Largest Share in the APC Market
Figure 21 India: Growing at High CAGR in the APC Market
Figure 22 Oil and Gas Application Segment Will Continue to Dominate the APC Market From 2014 to 2020
Figure 23 APC Services Are Expected to Grow at the Highest CAGR as Compared to the APC Software
Figure 24 Evolution of APC
Figure 25 Rising Demand for an Energy Efficient Process and Improved Product Quality is Expected to Boost the Growth
Figure 26 Value Chain Analysis: Major Value is Added During the Implementation of the APC
Figure 27 Porter�s Five Forces Analysis
Figure 28 Competitive Rivalry
Figure 29 Threat of Substitutes
Figure 30 Bargaining Power of Buyers
Figure 31 Bargaining Power of Suppliers
Figure 32 Threat of New Entrants
Figure 33 Recent Product Launches and Product Upgrades
Figure 34 Recent Acquisitions By Market Leaders in the APC Market
Figure 35 Service Segment Accounts for the Largest Market Size in the APC Market
Figure 36 Types of Advanced Regulatory Controls
Figure 37 Multivariable MPC Workflow
Figure 38 Implementation of APC in the Power Segment is Expected to Grow at the Highest CAGR
Figure 39 The U.S. is Expected to Account for the Highest Market Size By 2020
Figure 40 Middle East Accounts for the Highest Market Share in the APC Software Market
Figure 41 The APC Service Market is Expected to Dominate the ROW Region By 2020 64
Figure 42 China Holds the Largest Market Size in the APC Service Market in 2014
Figure 43 The Oil and Gas Segment Accounts for the Highest Market Size in the APC Systems
Figure 44 The APC Service for Oil and Gas Application is Expected to Grow at the Highest CAGR
Figure 45 Asia-Pacific Accounts for the Highest Market Size in Terms of the Implementation of APC in Petrochemicals
Figure 46 Implementation of APC in Water and Wastewater Application Was the Highest in ROW
Figure 47 The APC Services for Chemicals Application Are Expected to Grow at the Highest CAGR
Figure 48 The APC Software�s Market Size for Power Application is Expected to Get Doubled By 2020
Figure 49 Huge Demand of APC for Power Application is Expected From the Asia-Pacific Region
Figure 50 Huge Demand for APC Services is Expected From the Paper and Pulps Application
Figure 51 The Demand of APC Services in the Pharmaceutical Applications is Expected to Grow at the Highest CAGR
Figure 52 A Huge Demand for APC Systems is Expected From the Food and Beverages Market in the Asia-Pacific Region
Figure 53 Geographic Snapshot (2013)- the ROW Region Drives the Growth of the APC Technology
Figure 54 ROW & APAC � an Attractive Destination for All Application Categories
Figure 55 The U.S. is Expected to Grow at the Highest CAGR Among the North American Countries
Figure 56 The North American Market Snapshot: Demand Will Be Driven By the Increasing Complexities in the Production Process
Figure 57 APC Services Are Set to Be the Highest Revenue Source for APC Vendors in the Canadian Market
Figure 58 The APC Services Are Expected to Grow at the Highest CAGR in North America
Figure 59 France and Germany Are Expected to Grow at High CAGR Among the European Regions
Figure 60 APC Services to Outpace the Growth of the APC Software in Russia
Figure 61 Russia Has the Largest Market Share in the European APC Market
Figure 62 APAC Market Snapshot � China is Expected to Be the Most Lucrative Market
Figure 63 APC Services to Grow at A High CAGR in India
Figure 64 China Dominates the APAC APC Market
Figure 65 APC Services to Grow at A High CAGR in APAC
Figure 66 Middle East to Outpace Africa and South America in Growth in the ROW APC Market
Figure 67 APC Services to Grow Faster Than the APC Software in ROW
Figure 68 Companies Adopting Mergers and Acquisitions as the Key Growth Strategy Over the Last Three Years
Figure 69 Emerson Electric Co. Grew at the Fastest Rate Between 2011 - 2013
Figure 70 APC Market Share, By Key Player, 2013
Figure 71 Market Evaluation Framework-Significant Product Developments Have Fuelled the Growth and Innovation in 2014
Figure 72 Battle for Market Share: New Product Launches and Product Upgrades Was the Key Strategy
Figure 73 Geographic Revenue Mix of the Top 5 Market Players
Figure 74 Competitive Benchmarking of the Key Market Players (2010-2013): Emerson Electric Co. and Rockwell Automation, Inc. Emerged as the Dark Horses
Figure 75 ABB Ltd. : Business Overview
Figure 76 ABB Ltd. SWOT Analysis
Figure 77 Aspen Technology, Inc.: Business Overview
Figure 78 Emerson Electric Co. : Business Overview
Figure 79 Emerson Electric Co. SWOT Analysis
Figure 80 General Electric Co.: Business Overview
Figure 81 Honeywell International, Inc. : Business Overview
Figure 82 Honeywell International, Inc. SWOT Analysis
Figure 83 Rockwell Automation, Inc. : Business Overview
Figure 84 Rudolph Technologies, Inc. : Business Overview
Figure 85 Schneider Electric SE : Business Overview
Figure 86 Schneider Electric SE SWOT Analysis
Figure 87 Siemens AG : Business Overview
Figure 88 Siemens AG SWOT Analysis
Figure 89 Yokogawa Electric Corp.: Business Overview


Growth opportunities and latent adjacency in Advanced Process Control Market