Aerospace and Defense Telemetry Market

Aerospace and Defense Telemetry Market Size, Share & Industry Growth Analysis Report by Platform (Ground, Airborne, Marine, Space, Weapons, UAVs), Technology (Wired and Wireless Telemetry), Component ( Receiver, Transmitter, Antenna, Processors), Application, and Geography- Global Forecast to 2027

Report Code: AS 2238 May, 2022, by marketsandmarkets.com

Updated on : May 10, 2023

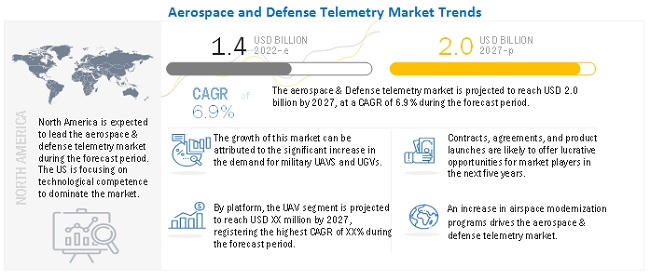
[217 Pages Report] The Aerospace and Defense Telemetry Market is expected to grow from USD 1.4 billion in 2022 to USD 2.0 billion by 2027, at a CAGR of 6.9% from 2022 to 2027. The Aerospace and Defense Telemetry Industry is driven by factors such as increase in airspace modernization programs, increasing demand for military UAVs, development of compact telemetry systems for UAVs, etc.

Aerospace and Defense Telemetry Market

To know about the assumptions considered for the study, Request for Free Sample Report

The COVID-19 pandemic has caused a large-scale impact on economies across the world. The global manufacturing of telemetry systems, components, and assembly lines have been impacted. COVID-19 has led to several challenges for many industries. The Aerospace & defense industry is no exception to that. The budget allotted to the defense sector has been reduced by several countries due to the COVID-19 pandemic. This puts most research projects on hold. The export of aerospace and defense telemetry to several countries in the Middle East, Africa, and Latin America has also been reduced. All these scenarios affect the development of aerospace and defense telemetry.

Aerospace and Defense Telemetry Market Dynamics

Driver : Increase in airspace modernization programs

Airspace modernization programs include designing new antennas to increase the connectivity of aircraft. For instance, in March 2021, a new antenna that offers flexible installation options for special-purpose aircraft was designed by ThinKom Solutions (US). The company developed a new variant of its Variable Inclination Continuous Transverse Stub (VICTS) antenna for government and military beyond-line-of-sight (BLoS) applications. Initial units of the product are currently undergoing integration, with formal qualification scheduled to begin soon.

Modernizing and overhauling airspace to enhance safety and minimize flight delays is a prime focus area in North American and European countries. Better routing decisions, improved pilot communication, and enhanced efficiency are some benefits of airspace modernization. It involves the installation of new technologies and components to communicate effectively with air traffic managers, perform multidimensional aircraft tracking, and improve navigation by generating images of forward external scene topography. These airspace modernization programs, when implemented successfully, help save fuel, enhance the quality of air, and reduce carbon emissions. This drives the market for aerospace & defense telemetry

Restraint : Long product certification duration

Aerospace & defense telemetry systems and component manufacturers are required to obtain certification before launching a new product in the market. Multiple tests and iterations are required for manufacturers to reach the highest level of safety, which leads to complex and delayed approval periods that further leads to production delay. For instance, as per stated by one of the primary respondent, any product related approvals from Federal Aviation Administration (FAA), that provides certification to region like North America, could take around three years. These delays in certification process from regulatory authorities like FAA may restrain the growth of aerospace and defense telemetry market.

Opportunity : Development of low cost miniaturized telemetry systems

The cost of electronic components has reduced significantly due to large-scale manufacturing and integration of circuits into single PCBs. This has made it possible to manufacture telemetry systems and components at low rates. The antennas, a telemetry component is being widely used across various industries due to their efficiency, reliability, and affordability. The large scale miniaturization of electronic comonents are being used in order to reduce the overall size of antennas, as a result, they can be easily accommodated in small spaces. It also further results in limited fuel and power consumption. In addition, it also helps manufacturers in reducing the size of UAVs and other satellites. As a result, the development of small-sized antennas at low costs offers lucrative growth opportunities for various players operating in the aerospace & defense telemetry market.

Challenges : Lack of skilled workforce

Critical land, marine, airborne, and space operations rely on well-qualified personnel for various tasks such as R&D, patent development, and software development & application. Thus, the recruitment of a technical workforce forms a crucial part of ensuring innovation in business processes and products in the defense industry. Countries such as Morocco, South Africa, Nigeria, Somalia, Kenya, Bangladesh, Nepal, and Bhutan lack a skilled technical workforce in the defense industry. Potential workforce issues affect the safety and effectiveness of operations, which further limits the number of missions that the systems can handle. Thus, this acts as a challenge to the growth of the aerospace & defense telemetry market.

UAV segment of the aerospace and defense telemetry market by platform, to grow at highest CAGR during the forecast period

Based on platform, the UAV segment is projected to grow from USD 187 million in 2022 to USD 320 million by 2027, at a CAGR of 11.4% during the forecast period. The growth can be attributed to the increasing use of UAVs across various industries, as well as increasing demand of UAVs for both military and commercial application.

Wireless telemetry segment to command the aerospace and defense telemetry market by technology, during the forecast period

The wireless telemetry segment is expected to lead the aerospace and defense telemetry market during the forecast period. This segment accounted for a share of 62.3% of the market in 2022. The growth can be attributed to the higher adoption of wireless telemetry technology owing to the ease of operation and maintenance.

Receiver segment to command the aerospace and defense telemetry market by component, during the forecast period

The receiver telemetry segment is expected to lead the aerospace and defense telemetry market during the forecast period. The market is projected to grow from USD 477 million in 2022 to USD 685 million in 2027, growing at a CAGR of 7.5% from 2022 to 2027.

The North America market is projected to contribute the largest share from 2022 to 2027

Rotator Cuff Injury Treatment  Market by Region

To know about the assumptions considered for the study, download the pdf brochure

Emerging Industry Trends

Miniaturization of Antenna

Research & development on antennas to reduce the size and weight and increase power have led to the development of integrated antennas. Research to make antennas invisible to the naked eye is still underway; these small antennas will be integrated into various platforms such as ships, military vehicles, and manpacks.

Flexible hybrid electronics (FHE) technology is a result of R&D undertaken by the electronics and high precision printing industries. With the help of FHE technology, manufacturers can build integrated antennas that are lightweight and can be conformed to the curves of the human body while preserving full operational integrity. FHE technology can revolutionize the aerospace & defense telemetry market by integrating multiple ultra-thin silicon components with high precision, printing them with conductive and active inks, and pasting them on stretchable substrates.

Aerospace and Defense Telemetry Industry Companies: Top
Key Market Players

The Aerospace and Defense Telemetry Companies are dominated by globally established players such as L3harris Technologies (US), Honeywell International Inc (US), General Dynamics Corporation (US), Lockheed Martin (US), Maxar Technologies (US). The report covers various industry trends and new technological innovations in the Aerospace and Defense Telemetry market for the period, 2018-2027.

Get online access to the report on the World's First Market Intelligence Cloud

  • Easy to Download Historical Data & Forecast Numbers
  • Company Analysis Dashboard for high growth potential opportunities
  • Research Analyst Access for customization & queries
  • Competitor Analysis with Interactive dashboard
  • Latest News, Updates & Trend analysis
Request Sample

Scope of the Report

Report Metric

Details

Market size available for years

2018–2027

Base year considered

2021

Forecast period

2022-2027

Forecast units

Value (USD Million)

Segments covered

By Platform, By Application, By Component, By technology

Geographies covered

North America, Europe, Asia Pacific, Middle East, Rest of the World.

Companies covered

L3harris Technologies (US), Honeywell International Inc (US), General Dynamics Corporation (US), Lockheed Martin Corporation (US), Maxar Technologies (US), Ruag International Holding Ltd (Switzerland), BAE Systems (UK), among others. (24 Companies)

The study categorizes the aerospace and defense telemetry market based on platform, application, component, technology, and region

By Platform

  • Ground
    • Ground Stations
      • Fixed
      • Mobile
    • Armored vehicles/Land Vehicle
  • Airborne
    • Commercial
      • Fixed
      • Rotary
    • Military
      • Fixed
      • Rotary
  • Marine
    • Commercial
    • Military
  • Space
    • Satellite
    • Launchers
  • Weapons
  • UAVs

By Application

  • Avionics
  • Air Vehicle Test
  • Flight Test Instrumentation
  • Distributed Data Acquisition System
  • Flight Termination System

By Technology

  • Wired Telemetry
    • Electrical Cables
    • Fiber Optic Cables
  • Wireless Telemetry
    • Short-range Radio Telemetry
    • Microwave Telemetry

By Component

  • Receivers
  • Transmitters
  • Antennas
  • Processors

By Region

  • North America
  • Asia Pacific
  • Europe
  • Rest of the World

Recent Developments

  • In February 2022, Lockheed Martin received a manufacturing contract from Smiths Interconnect to manufacture High Gain High Sensitivity (HGHS) Antenna systems to protect US Navy ships from threats during mission-critical operations.
  • In January 2022, L3Harris Technologies was awarded an IDIQ contract by the US Marine for multi-channel handheld and vehicular radio systems.

Frequently Asked Questions (FAQ):

To speak to our analyst for a discussion on the above findings, click Speak to Analyst

TABLE OF CONTENTS
 
1 INTRODUCTION (Page No. - 22)
    1.1 OBJECTIVES OF THE STUDY
    1.2 MARKET DEFINITION
    1.3 STUDY SCOPE
           1.3.1 AEROSPACE & DEFENSE TELEMETRY MARKET SEGMENTATION
           1.3.2 REGIONAL SCOPE
           1.3.3 YEARS CONSIDERED FOR THE STUDY
    1.4 INCLUSIONS AND EXCLUSIONS
           TABLE 1 INCLUSIONS AND EXCLUSIONS IN AEROSPACE & DEFENSE TELEMETRY MARKET
    1.5 CURRENCY & PRICING
    1.6 STUDY LIMITATIONS
    1.7 MARKET STAKEHOLDERS
    1.8 SUMMARY OF CHANGES
 
2 RESEARCH METHODOLOGY (Page No. - 27)
    2.1 RESEARCH DATA
           FIGURE 1 REPORT PROCESS FLOW
           FIGURE 2 RESEARCH DESIGN
           2.1.1 SECONDARY DATA
           2.1.2 PRIMARY DATA
                    2.1.2.1 Key data from primary sources
                    2.1.2.2 Key primary sources
                               FIGURE 3 BREAKDOWN OF PRIMARY INTERVIEWS: BY COMPANY TYPE, DESIGNATION,  AND REGION
           2.1.3 DEMAND-SIDE INDICATORS
           2.1.4 SUPPLY-SIDE ANALYSIS
    2.2 MARKET SIZE ESTIMATION
           2.2.1 SEGMENTS AND SUBSEGMENTS
    2.3 RESEARCH APPROACH & METHODOLOGY
           2.3.1 BOTTOM-UP APPROACH
                    TABLE 2 AEROSPACE & DEFENSE TELEMETRY MARKET ESTIMATION PROCEDURE
                    FIGURE 4 MARKET SIZE ESTIMATION METHODOLOGY: BOTTOM-UP APPROACH
           2.3.2 TOP-DOWN APPROACH
                    FIGURE 5 MARKET SIZE ESTIMATION METHODOLOGY: TOP-DOWN APPROACH
    2.4 DATA TRIANGULATION
           FIGURE 6 DATA TRIANGULATION
           2.4.1 TRIANGULATION THROUGH PRIMARY AND SECONDARY RESEARCH
    2.5 GROWTH RATE ASSUMPTIONS
    2.6 ASSUMPTIONS FOR THE RESEARCH STUDY
    2.7 RISKS
 
3 EXECUTIVE SUMMARY (Page No. - 35)
    FIGURE 7 UAV PLATFORM TO REGISTER HIGHEST CAGR DURING FORECAST PERIOD
    FIGURE 8 WIRELESS TECHNOLOGY TO LEAD MARKET DURING FORECAST PERIOD
    FIGURE 9 RECEIVERS SEGMENT TO DOMINATE MARKET DURING FORECAST PERIOD
    FIGURE 10 NORTH AMERICA TO HOLD LARGEST SHARE OF AEROSPACE & DEFENSE TELEMETRY MARKET IN 2022
 
4 PREMIUM INSIGHTS (Page No. - 38)
    4.1 ATTRACTIVE GROWTH OPPORTUNITIES IN AEROSPACE & DEFENSE TELEMETRY MARKET
           FIGURE 11 INCREASING DEMAND FOR UAVS AND SATELLITES DRIVES MARKET GROWTH
    4.2 AEROSPACE & DEFENSE TELEMETRY MARKET, BY PLATFORM
           FIGURE 12 GROUND PLATFORM TO COMMAND MARKET FROM 2018 TO 2027
    4.3 AEROSPACE & DEFENSE TELEMETRY MARKET, BY AIRBORNE PLATFORM
           FIGURE 13 COMMERCIAL SUBSEGMENT TO DOMINATE MARKET FROM 2018 TO 2027
    4.4 NORTH AMERICA AEROSPACE & DEFENSE TELEMETRY MARKET, BY TECHNOLOGY
           FIGURE 14 WIRELESS TECHNOLOGY TO LEAD MARKET FROM 2018 TO 2027
    4.5 AEROSPACE & DEFENSE TELEMETRY MARKET, BY COUNTRY
           FIGURE 15 INDIA PROJECTED TO BE FASTEST-GROWING MARKET FROM 2022 TO 2027
 
5 MARKET OVERVIEW (Page No. - 41)
    5.1 INTRODUCTION
    5.2 MARKET DYNAMICS
           FIGURE 16 AEROSPACE & DEFENSE TELEMETRY MARKET: DRIVERS, RESTRAINTS, OPPORTUNITIES, AND CHALLENGES
           5.2.1 DRIVERS
                    5.2.1.1 Increase in airspace modernization programs
                    5.2.1.2 Increasing demand for military UAVs
                               FIGURE 17 DEMAND FOR MILITARY UNMANNED AIR VEHICLES (2016-2021)
                    5.2.1.3 Emergence of modern warfare systems
                               TABLE 3 ELECTRONIC WARFARE SYSTEMS MARKET, BY REGION, 2016 VS. 2021 (USD MILLION)
                    5.2.1.4 Development of compact telemetry systems for UAVs
                    5.2.1.5 Customized SATCOM-on-the-move solutions for unmanned ground vehicles
                    5.2.1.6 Increasing defense budget of countries
                               TABLE 4 DEFENSE BUDGET, BY COUNTRY, 2020 (USD BILLION)
           5.2.2 RESTRAINTS
                    5.2.2.1 Long product certification duration
                    5.2.2.2 High development and maintenance cost of infrastructure
           5.2.3 OPPORTUNITIES
                    5.2.3.1 Development of low-cost and miniaturized telemetry systems
                    5.2.3.2 Demand for high rate of data transmission
           5.2.4 CHALLENGES
                    5.2.4.1 Lack of skilled workforce
                    5.2.4.2 Electromagnetic compatibility challenges in military vehicles
                    5.2.4.3 System requirement and design constraints
    5.3 RANGES AND SCENARIOS
           FIGURE 18 IMPACT OF COVID-19 ON AEROSPACE & DEFENSE TELEMETRY MARKET: GLOBAL SCENARIOS
    5.4 VALUE CHAIN ANALYSIS OF AEROSPACE & DEFENSE TELEMETRY MARKET
           FIGURE 19 VALUE CHAIN ANALYSIS
    5.5 TRENDS/DISRUPTION IMPACTING CUSTOMER BUSINESS
           5.5.1 REVENUE SHIFT AND NEW REVENUE POCKETS FOR AEROSPACE & DEFENSE TELEMETRY MANUFACTURERS
                    FIGURE 20 REVENUE SHIFT FOR AEROSPACE & DEFENSE TELEMETRY MARKET PLAYERS
    5.6 AEROSPACE & DEFENSE TELEMETRY MARKET ECOSYSTEM
           5.6.1 PROMINENT COMPANIES
           5.6.2 PRIVATE AND SMALL ENTERPRISES
           5.6.3 MARKET ECOSYSTEM
                    FIGURE 21 ECOSYSTEM: AEROSPACE & DEFENSE TELEMETRY MARKET
                    TABLE 5 AEROSPACE & DEFENSE TELEMETRY: MARKET ECOSYSTEM
    5.7 PATENT ANALYSIS
    5.8 INNOVATION AND PATENT REGISTRATIONS
           TABLE 6 INNOVATION & PATENT REGISTRATION, 2013-2021
    5.9 AVERAGE SELLING PRICE OF AEROSPACE & DEFENSE TELEMETRY PRODUCTS
           5.9.1 AVERAGE SELLING PRICE TRENDS OF MILITARY ANTENNAS, 2020 (USD MILLION)
           5.9.2 AVERAGE SELLING PRICE TRENDS OF MILITARY SENSORS, 2020 (USD MILLION)
                    TABLE 7 AVERAGE SELLING PRICE TRENDS OF MILITARY SENSORS,  2020 (USD MILLION)
    5.10 PRICING ANALYSIS
           5.10.1 AVERAGE SELLING PRICES OF COMPONENTS OFFERED BY KEY PLAYERS
                    FIGURE 22 AVERAGE SELLING PRICES OF TELEMETRY COMPONENTS
    5.11 PORTER’S FIVE FORCES ANALYSIS
                    FIGURE 23 PORTER’S FIVE FORCES ANALYSIS FOR AEROSPACE & DEFENSE TELEMETRY
                    TABLE 8 AEROSPACE & DEFENSE TELEMETRY: PORTER’S FIVE FORCES ANALYSIS
           5.11.1 THREAT OF NEW ENTRANTS
           5.11.2 THREAT OF SUBSTITUTES
           5.11.3 BARGAINING POWER OF SUPPLIERS
           5.11.4 BARGAINING POWER OF BUYERS
           5.11.5 INTENSITY OF COMPETITIVE RIVALRY
    5.12 TRADE DATA STATISTICS
           5.12.1 IMPORT DATA STATISTICS
                    TABLE 9 IMPORT VALUE TELEMETRY SYSTEM, INDIA (INR)
           5.12.2 KEY CONFERENCES & EVENTS, 2022-2023
                    TABLE 10 AEROSPACE & DEFENSE TELEMETRY MARKET: DETAILED LIST OF CONFERENCES & EVENTS
    5.13 TARIFF AND REGULATORY LANDSCAPE
           5.13.1 REGULATORY BODIES, GOVERNMENT AGENCIES, AND OTHER ORGANIZATIONS
                    TABLE 11 NORTH AMERICA: REGULATORY BODIES, GOVERNMENT AGENCIES, AND OTHER ORGANIZATIONS
                    TABLE 12 EUROPE: REGULATORY BODIES, GOVERNMENT AGENCIES, AND OTHER ORGANIZATIONS
                    TABLE 13 ASIA PACIFIC: REGULATORY BODIES, GOVERNMENT AGENCIES, AND OTHER ORGANIZATIONS
                    TABLE 14 MIDDLE EAST: REGULATORY BODIES, GOVERNMENT AGENCIES, AND  OTHER ORGANIZATIONS
           5.13.2 REGULATORY LANDSCAPE
                    5.13.2.1 North America
    5.14 KEY STAKEHOLDERS & BUYING CRITERIA
           5.14.1 KEY STAKEHOLDERS IN BUYING PROCESS
                    FIGURE 24 INFLUENCE OF STAKEHOLDERS IN BUYING PROCESS OF AEROSPACE & DEFENSE TELEMETRY ACROSS THREE APPLICATIONS
                    TABLE 15 INFLUENCE OF STAKEHOLDERS IN BUYING PROCESS OF AEROSPACE & DEFENSE TELEMETRY ACROSS APPLICATIONS (%)
           5.14.2 BUYING CRITERIA
                    FIGURE 25 KEY BUYING CRITERIA OF AEROSPACE & DEFENSE TELEMETRY, BY APPLICATION
                    TABLE 16 KEY BUYING CRITERIA OF AEROSPACE & DEFENSE TELEMETRY, BY APPLICATION
 
6 INDUSTRY TRENDS (Page No. - 63)
    6.1 INTRODUCTION
    6.2 TECHNOLOGY TRENDS
           6.2.1 MULTI-MATERIAL 3D PRINTING OF COMPONENTS
           6.2.2 MINIATURIZATION OF ANTENNAS
           6.2.3 DEVELOPMENT OF ACTIVE ELECTRONICALLY SCANNED ARRAY (AESA)
           6.2.4 OPTOELECTRONIC SOLUTIONS
           6.2.5 MILITARY ANALOG TO DIGITAL CONVERTERS (ADC) IN TELEMETRY SYSTEMS
           6.2.6 INCREASING USE OF OPEN ARCHITECTURE SOFTWARE
           6.2.7 ADVANCED COMPUTER OPERATED RADIO FREQUENCY
           6.2.8 INCREASE IN USE OF SOFTWARE-DEFINED RADIO
    6.3 TECHNOLOGY ANALYSIS
    6.4 USE CASE ANALYSIS
           6.4.1 ULTRA-RUGGED INERTIAL MEASUREMENT UNITS
           6.4.2 NEXT-GENERATION DIGITAL CABIN PRESSURE CONTROL AND MONITORING SYSTEM FOR AIRCRAFT
    6.5 IMPACT OF MEGATRENDS
           6.5.1 DEVELOPMENT OF SMART ANTENNAS
           6.5.2 MULTI-BAND, MULTI-MISSION (MBMM) ANTENNA
           6.5.3 HYBRID BEAMFORMING METHODS
 
7 AEROSPACE & DEFENSE TELEMETRY MARKET, BY PLATFORM (Page No. - 68)
    7.1 INTRODUCTION
           FIGURE 26 AIRBORNE SEGMENT PROJECTED TO DOMINATE DURING FORECAST PERIOD
           TABLE 17 AEROSPACE & DEFENSE TELEMETRY MARKET, BY PLATFORM, 2018–2021 (USD MILLION)
           TABLE 18 AEROSPACE & DEFENSE TELEMETRY MARKET, BY PLATFORM, 2022–2027 (USD MILLION)
    7.2 AIRBORNE
           7.2.1 ENSURED CONNECTIVITY THROUGH MULTIPLE SATELLITES FUELS SEGMENT
           7.2.2 COMMERCIAL
                    TABLE 19 COMMERCIAL: AEROSPACE & DEFENSE TELEMETRY MARKET, BY AIRCRAFT TYPE,  2018–2021 (USD MILLION)
                    TABLE 20 COMMERCIAL: AEROSPACE & DEFENSE TELEMETRY MARKET, BY AIRCRAFT TYPE,  2022–2027 (USD MILLION)
                    7.2.2.1 Fixed
                    7.2.2.2 Rotary
           7.2.3 MILITARY
                    TABLE 21 MILITARY: AEROSPACE & DEFENSE TELEMETRY MARKET, BY AIRCRAFT TYPE,  2018–2021 (USD MILLION)
                    TABLE 22 MILITARY: AEROSPACE & DEFENSE TELEMETRY MARKET, BY AIRCRAFT TYPE,  2022–2027 (USD MILLION)
                    7.2.3.1 Fixed
                    7.2.3.2 Rotary
    7.3 GROUND
           7.3.1 DEPLOYMENT OF ADVANCED GROUND VEHICLES TO DRIVE MARKET
                    TABLE 23 AEROSPACE & DEFENSE TELEMETRY MARKET, BY GROUND PLATFORM,  2018–2021 (USD MILLION)
                    TABLE 24 AEROSPACE & DEFENSE TELEMETRY MARKET, BY GROUND PLATFORM,  2022–2027 (USD MILLION)
           7.3.2 GROUND STATIONS
                    7.3.2.1 Fixed
                    7.3.2.2 Mobile
           7.3.3 ARMORED VEHICLES/LAND VEHICLES
    7.4 SPACE
           7.4.1 SEGMENT DRIVEN BY WIDE-SCALE APPLICATION OF SATELLITES TO DETECT & TRACK BALLISTIC MISSILES
           7.4.2 SATELLITES
           7.4.3 LAUNCHERS
    7.5 WEAPONS
           7.5.1 ADVANCED TELEMETRY FOR HYPERSONIC APPLICATIONS TO DRIVE SEGMENT
    7.6 MARINE
           7.6.1 INCREASING MARITIME WARFARE BOOSTS DEMAND
                    TABLE 25 MARINE: AEROSPACE & DEFENSE TELEMETRY MARKET, BY TYPE, 2018–2021 (USD MILLION)
                    TABLE 26 MARINE: AEROSPACE & DEFENSE TELEMETRY MARKET, BY TYPE, 2022–2027 (USD MILLION)
           7.6.2 COMMERCIAL
           7.6.3 MILITARY
    7.7 UNMANNED AERIAL VEHICLES
           7.7.1 INCREASING USE OF UAVS FOR RECONNAISSANCE AND SURVEILLANCE ACTIVITIES TO BOOST DEMAND
 
8 AEROSPACE & DEFENSE TELEMETRY MARKET, BY APPLICATION (Page No. - 76)
    8.1 INTRODUCTION
    8.2 AVIONICS
           8.2.1 ADVANCED AVIONICS USED TO FACILITATE COMMUNICATION
    8.3 AIR VEHICLE TEST
           8.3.1 ADVANCED AIR VEHICLE TEST SYSTEMS PROVIDE BETTER COORDINATION
    8.4 FLIGHT TEST INSTRUMENTATION
           8.4.1 BETTER PILOT CONTROL BOOSTS SEGMENT
    8.5 DISTRIBUTED DATA ACQUISITION SYSTEM
           8.5.1 REAL-TIME INFLIGHT DATA MANAGEMENT FUELS SEGMENT
    8.6 FLIGHT TERMINATION SYSTEM
           8.6.1 FLIGHT TERMINATION SYSTEM USED TO INCREASE FLIGHT SAFETY
 
9 AEROSPACE & DEFENSE TELEMETRY MARKET, BY TECHNOLOGY (Page No. - 78)
    9.1 INTRODUCTION
           FIGURE 27 WIRELESS SEGMENT ESTIMATED TO LEAD MARKET IN 2022
           TABLE 27 AEROSPACE & DEFENSE TELEMETRY MARKET, BY TECHNOLOGY, 2018–2021 (USD MILLION)
           TABLE 28 AEROSPACE & DEFENSE TELEMETRY MARKET, BY TECHNOLOGY, 2022–2027 (USD MILLION)
    9.2 WIRED TELEMETRY
           9.2.1 WIRED TELEMETRY WIDELY USED FOR ENHANCED FLIGHT MANAGEMENT
           9.2.2 ELECTRIC CABLES
           9.2.3 FIBER OPTIC CABLES
    9.3 WIRELESS TELEMETRY
           9.3.1 TECHNICALLY ADVANCED WIRED TELEMETRY HELPS WITH REAL-TIME INFORMATION TRANSFER
           9.3.2 SHORT-RANGE RADIO TELEMETRY
           9.3.3 MICROWAVE TELEMETRY
 
10 AEROSPACE & DEFENSE TELEMETRY MARKET, BY COMPONENT (Page No. - 82)
     10.1 INTRODUCTION
               FIGURE 28 TRANSMITTERS SEGMENT TO LEAD AEROSPACE & DEFENSE TELEMETRY MARKET IN 2022
               TABLE 29 AEROSPACE & DEFENSE TELEMETRY MARKET, BY COMPONENT, 2018–2021 (USD MILLION)
               TABLE 30 AEROSPACE & DEFENSE TELEMETRY MARKET, BY COMPONENT, 2022–2027 (USD MILLION)
     10.2 RECEIVERS
             10.2.1 NEED TO FILTER UNWANTED SIGNALS BOOSTS DEMAND
     10.3 TRANSMITTERS
             10.3.1 MULTI-PURPOSE TRANSMITTERS WIDELY USED FOR LONG-DISTANCE COMMUNICATION
     10.4 ANTENNAS
             10.4.1 DEMAND FOR OMNIDIRECTIONAL ANTENNAS DRIVES SEGMENT
     10.5 PROCESSORS
             10.5.1 TRANSLATION OF DATA INTO INFORMATION WITH CAPABILITIES SUCH AS DATA FUSION
 
11 REGIONAL ANALYSIS (Page No. - 86)
     11.1 INTRODUCTION
               FIGURE 29 GLOBAL AEROSPACE & DEFENSE TELEMETRY MARKET SNAPSHOT
               TABLE 31 AEROSPACE & DEFENSE TELEMETRY MARKET, BY REGION, 2018–2021 (USD MILLION)
               TABLE 32 AEROSPACE & DEFENSE TELEMETRY MARKET, BY REGION,  2022–2027 (USD MILLION)
               TABLE 33 AEROSPACE & DEFENSE TELEMETRY MARKET, BY PLATFORM, 2018–2021 (USD MILLION)
               TABLE 34 AEROSPACE & DEFENSE TELEMETRY MARKET, BY PLATFORM, 2022–2027 (USD MILLION)
               TABLE 35 AIRBORNE: AEROSPACE & DEFENSE TELEMETRY MARKET, BY TYPE, 2018–2021 (USD MILLION)
               TABLE 36 AIRBORNE: AEROSPACE & DEFENSE TELEMETRY MARKET, BY TYPE, 2022–2027 (USD MILLION)
     11.2 NORTH AMERICA
             11.2.1 PESTLE ANALYSIS: NORTH AMERICA
                       FIGURE 30 NORTH AMERICA: AEROSPACE & DEFENSE TELEMETRY MARKET SNAPSHOT
                       TABLE 37 NORTH AMERICA: AEROSPACE & DEFENSE TELEMETRY MARKET, BY PLATFORM,  2018–2021 (USD MILLION)
                       TABLE 38 NORTH AMERICA: AEROSPACE & DEFENSE TELEMETRY MARKET, BY PLATFORM,  2022–2027 (USD MILLION)
                       TABLE 39 NORTH AMERICA: AEROSPACE & DEFENSE TELEMETRY MARKET, BY TECHNOLOGY,  2018–2021 (USD MILLION)
                       TABLE 40 NORTH AMERICA: AEROSPACE & DEFENSE TELEMETRY MARKET, BY TECHNOLOGY,  2022–2027 (USD MILLION)
                       TABLE 41 NORTH AMERICA: AEROSPACE & DEFENSE TELEMETRY MARKET, BY COMPONENT,  2018–2021 (USD MILLION)
                       TABLE 42 NORTH AMERICA: AEROSPACE & DEFENSE TELEMETRY MARKET, BY COMPONENT,  2022–2027 (USD MILLION)
                       TABLE 43 NORTH AMERICA: AEROSPACE & DEFENSE TELEMETRY MARKET, BY COUNTRY,  2018–2021 (USD MILLION)
                       TABLE 44 NORTH AMERICA: AEROSPACE & DEFENSE TELEMETRY MARKET, BY COUNTRY,  2022–2027 (USD MILLION)
             11.2.2 US
                       11.2.2.1 Increased spending by defense organizations and private players fuels market growth
                                   TABLE 45 US: AEROSPACE & DEFENSE TELEMETRY MARKET, BY PLATFORM,  2018–2021 (USD MILLION)
                                   TABLE 46 US: AEROSPACE & DEFENSE TELEMETRY MARKET, BY PLATFORM, 2022–2027 (USD MILLION)
                                   TABLE 47 US: AEROSPACE & DEFENSE TELEMETRY MARKET, BY TECHNOLOGY, 2018–2021 (USD MILLION)
                                   TABLE 48 US: AEROSPACE & DEFENSE TELEMETRY MARKET, BY TECHNOLOGY,  2022–2027 (USD MILLION)
             11.2.3 CANADA
                       11.2.3.1 Increasing military procurement and growing demand for UAVs drive market
                                   TABLE 49 CANADA: AEROSPACE & DEFENSE TELEMETRY MARKET, BY PLATFORM,  2018–2021 (USD MILLION)
                                   TABLE 50 CANADA: AEROSPACE & DEFENSE TELEMETRY MARKET, BY PLATFORM,  2022–2027 (USD MILLION)
                                   TABLE 51 CANADA: AEROSPACE & DEFENSE TELEMETRY MARKET, BY TECHNOLOGY,  2018–2021 (USD MILLION)
                                   TABLE 52 CANADA: AEROSPACE & DEFENSE TELEMETRY MARKET, BY TECHNOLOGY,  2022–2027 (USD MILLION)
     11.3 EUROPE
             11.3.1 PESTLE ANALYSIS: EUROPE
                       FIGURE 31 EUROPE: AEROSPACE & DEFENSE TELEMETRY MARKET SNAPSHOT
                       TABLE 53 EUROPE: AEROSPACE & DEFENSE TELEMETRY MARKET, BY PLATFORM,  2018–2021 (USD MILLION)
                       TABLE 54 EUROPE: AEROSPACE & DEFENSE TELEMETRY MARKET, BY PLATFORM,  2022–2027 (USD MILLION)
                       TABLE 55 EUROPE: AEROSPACE & DEFENSE TELEMETRY MARKET, BY TECHNOLOGY,  2018–2021 (USD MILLION)
                       TABLE 56 EUROPE: AEROSPACE & DEFENSE TELEMETRY MARKET, BY TECHNOLOGY,  2022–2027 (USD MILLION)
                       TABLE 57 EUROPE: AEROSPACE & DEFENSE TELEMETRY MARKET, BY COMPONENT,  2018–2021 (USD MILLION)
                       TABLE 58 EUROPE: AEROSPACE & DEFENSE TELEMETRY MARKET, BY COMPONENT,  2022–2027 (USD MILLION)
                       TABLE 59 EUROPE: AEROSPACE & DEFENSE TELEMETRY MARKET, BY COUNTRY,  2018–2021 (USD MILLION)
                       TABLE 60 EUROPE: AEROSPACE & DEFENSE TELEMETRY MARKET, BY COUNTRY,  2022–2027 (USD MILLION)
             11.3.2 UK
                       11.3.2.1 Increasing number of LEO constellations and high-throughput satellites boosts market
                                   TABLE 61 UK: AEROSPACE & DEFENSE TELEMETRY MARKET, BY PLATFORM,  2018–2021 (USD MILLION)
                                   TABLE 62 UK: AEROSPACE & DEFENSE TELEMETRY MARKET, BY PLATFORM, 2022–2027 (USD MILLION)
                                   TABLE 63 UK: AEROSPACE & DEFENSE TELEMETRY MARKET, BY TECHNOLOGY, 2018–2021 (USD MILLION)
                                   TABLE 64 UK: AEROSPACE & DEFENSE TELEMETRY MARKET, BY TECHNOLOGY, 2022–2027 (USD MILLION)
             11.3.3 ITALY
                       11.3.3.1 Increasing development of secure communication systems drives market
                                   TABLE 65 ITALY: AEROSPACE & DEFENSE TELEMETRY MARKET, BY PLATFORM, 2018–2021 (USD MILLION)
                                   TABLE 66 ITALY: AEROSPACE & DEFENSE TELEMETRY MARKET, BY PLATFORM, 2022–2027 (USD MILLION)
                                   TABLE 67 ITALY: AEROSPACE & DEFENSE TELEMETRY MARKET, BY TECHNOLOGY,  2018–2021 (USD MILLION)
                                   TABLE 68 ITALY: AEROSPACE & DEFENSE TELEMETRY MARKET, BY TECHNOLOGY,  2022–2027 (USD MILLION)
             11.3.4 GERMANY
                       11.3.4.1 Market driven by presence of satellite service providers and equipment manufacturers
                                   TABLE 69 GERMANY: AEROSPACE & DEFENSE TELEMETRY MARKET, BY PLATFORM,  2018–2021 (USD MILLION)
                                   TABLE 70 GERMANY: AEROSPACE & DEFENSE TELEMETRY MARKET, BY PLATFORM,  2022–2027 (USD MILLION)
                                   TABLE 71 GERMANY: AEROSPACE & DEFENSE TELEMETRY MARKET, BY TECHNOLOGY,  2018–2021 (USD MILLION)
                                   TABLE 72 GERMANY: AEROSPACE & DEFENSE TELEMETRY MARKET, BY TECHNOLOGY,  2022–2027 (USD MILLION)
             11.3.5 FRANCE
                       11.3.5.1 Presence of aircraft manufacturers boosts market
                                   TABLE 73 FRANCE: AEROSPACE & DEFENSE TELEMETRY MARKET, BY PLATFORM,  2018–2021 (USD MILLION)
                                   TABLE 74 FRANCE: AEROSPACE & DEFENSE TELEMETRY MARKET, BY PLATFORM,  2022–2027 (USD MILLION)
                                   TABLE 75 FRANCE: AEROSPACE & DEFENSE TELEMETRY MARKET, BY TECHNOLOGY,  2018–2021 (USD MILLION)
                                   TABLE 76 FRANCE: AEROSPACE & DEFENSE TELEMETRY MARKET, BY TECHNOLOGY,  2022–2027 (USD MILLION)
             11.3.6 CZECH REPUBLIC
                       11.3.6.1 Deployment of advanced ground satellite communication systems fuels market
                                   TABLE 77 CZECH REPUBLIC: AEROSPACE & DEFENSE TELEMETRY MARKET, BY PLATFORM,  2018–2021 (USD MILLION)
                                   TABLE 78 CZECH REPUBLIC: AEROSPACE & DEFENSE TELEMETRY MARKET, BY PLATFORM,  2022–2027 (USD MILLION)
                                   TABLE 79 CZECH REPUBLIC: AEROSPACE & DEFENSE TELEMETRY MARKET, BY TECHNOLOGY, 2018–2021 (USD MILLION)
                                   TABLE 80 CZECH REPUBLIC: AEROSPACE & DEFENSE TELEMETRY MARKET, BY TECHNOLOGY, 2022–2027 (USD MILLION)
             11.3.7 REST OF EUROPE
                       11.3.7.1 Increasing instances of cross-border conflicts in Rest of Europe drive market
                                   TABLE 81 REST OF EUROPE: AEROSPACE & DEFENSE TELEMETRY MARKET, BY PLATFORM,  2018–2021 (USD MILLION)
                                   TABLE 82 REST OF EUROPE: AEROSPACE & DEFENSE TELEMETRY MARKET, BY PLATFORM,  2022–2027 (USD MILLION)
                                   TABLE 83 REST OF EUROPE: AEROSPACE & DEFENSE TELEMETRY MARKET, BY TECHNOLOGY, 2018–2021 (USD MILLION)
     11.4 ASIA PACIFIC
             11.4.1 PESTLE ANALYSIS: ASIA PACIFIC
                       FIGURE 32 ASIA PACIFIC: AEROSPACE & DEFENSE TELEMETRY MARKET SNAPSHOT
                       TABLE 84 ASIA PACIFIC: AEROSPACE & DEFENSE TELEMETRY MARKET, BY PLATFORM,  2018–2021 (USD MILLION)
                       TABLE 85 ASIA PACIFIC: AEROSPACE & DEFENSE TELEMETRY MARKET, BY PLATFORM,  2022–2027 (USD MILLION)
                       TABLE 86 ASIA PACIFIC: AEROSPACE & DEFENSE TELEMETRY MARKET, BY TECHNOLOGY,  2018–2021 (USD MILLION)
                       TABLE 87 ASIA PACIFIC: AEROSPACE & DEFENSE TELEMETRY MARKET, BY TECHNOLOGY,  2022–2027 (USD MILLION)
                       TABLE 88 ASIA PACIFIC: AEROSPACE & DEFENSE TELEMETRY MARKET, BY COMPONENT,  2018–2021 (USD MILLION)
                       TABLE 89 ASIA PACIFIC: AEROSPACE & DEFENSE TELEMETRY MARKET, BY COMPONENT,  2022–2027 (USD MILLION)
                       TABLE 90 ASIA PACIFIC: AEROSPACE & DEFENSE TELEMETRY MARKET, BY COUNTRY,  2018–2021 (USD MILLION)
                       TABLE 91 ASIA PACIFIC: AEROSPACE & DEFENSE TELEMETRY MARKET, BY COUNTRY,  2022–2027 (USD MILLION)
             11.4.2 CHINA
                       11.4.2.1 Instability across borders and neighboring countries drives market
                                   TABLE 92 CHINA: AEROSPACE & DEFENSE TELEMETRY MARKET, BY PLATFORM, 2018–2021 (USD MILLION)
                                   TABLE 93 CHINA: AEROSPACE & DEFENSE TELEMETRY MARKET, BY PLATFORM, 2022–2027 (USD MILLION)
                                   TABLE 94 CHINA: AEROSPACE & DEFENSE TELEMETRY MARKET, BY TECHNOLOGY,  2018–2021 (USD MILLION)
                                   TABLE 95 CHINA: AEROSPACE & DEFENSE TELEMETRY MARKET, BY TECHNOLOGY,  2022–2027 (USD MILLION)
             11.4.3 INDIA
                       11.4.3.1 Ongoing military modernization and infrastructural revolution fuel market growth
                                   TABLE 96 INDIA: AEROSPACE & DEFENSE TELEMETRY MARKET, BY PLATFORM, 2018–2021 (USD MILLION)
                                   TABLE 97 INDIA: AEROSPACE & DEFENSE TELEMETRY MARKET, BY PLATFORM, 2022–2027 (USD MILLION)
                                   TABLE 98 INDIA: AEROSPACE & DEFENSE TELEMETRY MARKET, BY TECHNOLOGY,  2018–2021 (USD MILLION)
                                   TABLE 99 INDIA: AEROSPACE & DEFENSE TELEMETRY MARKET, BY TECHNOLOGY,  2022–2027 (USD MILLION)
             11.4.4 SINGAPORE
                       11.4.4.1 Focus on strengthening military capabilities fuels market growth
                                   TABLE 100 SINGAPORE: AEROSPACE & DEFENSE TELEMETRY MARKET, BY PLATFORM,  2018–2021 (USD MILLION)
                                   TABLE 101 SINGAPORE: AEROSPACE & DEFENSE TELEMETRY MARKET, BY PLATFORM,  2022–2027 (USD MILLION)
                                   TABLE 102 SINGAPORE: AEROSPACE & DEFENSE TELEMETRY MARKET, BY TECHNOLOGY,  2018–2021 (USD MILLION)
                                   TABLE 103 SINGAPORE: AEROSPACE & DEFENSE TELEMETRY MARKET, BY TECHNOLOGY,  2022–2027 (USD MILLION)
             11.4.5 SOUTH KOREA
                       11.4.5.1 Focus on acquiring surveillance and missile defense systems fuels market
                                   TABLE 104 SOUTH KOREA: AEROSPACE & DEFENSE TELEMETRY MARKET, BY PLATFORM,  2018–2021 (USD MILLION)
                                   TABLE 105 SOUTH KOREA: AEROSPACE & DEFENSE TELEMETRY MARKET, BY PLATFORM,  2022–2027 (USD MILLION)
                                   TABLE 106 SOUTH KOREA: AEROSPACE & DEFENSE TELEMETRY MARKET, BY TECHNOLOGY,  2018–2021 (USD MILLION)
                                   TABLE 107 SOUTH KOREA: AEROSPACE & DEFENSE TELEMETRY MARKET, BY TECHNOLOGY,  2022–2027 (USD MILLION)
             11.4.6 JAPAN
                       11.4.6.1 Increased use of satellites and SATCOM equipment for surveillance boosts market
                                   TABLE 108 JAPAN: AEROSPACE & DEFENSE TELEMETRY MARKET, BY PLATFORM,  2018–2021 (USD MILLION)
                                   TABLE 109 JAPAN: AEROSPACE & DEFENSE TELEMETRY MARKET, BY PLATFORM, 2022–2027 (USD MILLION)
                                   TABLE 110 JAPAN: AEROSPACE & DEFENSE TELEMETRY MARKET, BY TECHNOLOGY,  2018–2021 (USD MILLION)
                                   TABLE 111 JAPAN: AEROSPACE & DEFENSE TELEMETRY MARKET, BY TECHNOLOGY,  2022–2027 (USD MILLION)
             11.4.7 AUSTRALIA
                       11.4.7.1 Increasing installation of SATCOM antenna systems for ground network drives market
                                   TABLE 112 AUSTRALIA: AEROSPACE & DEFENSE TELEMETRY MARKET, BY PLATFORM,  2018–2021 (USD MILLION)
                                   TABLE 113 AUSTRALIA: AEROSPACE & DEFENSE TELEMETRY MARKET, BY PLATFORM,  2022–2027 (USD MILLION)
                                   TABLE 114 AUSTRALIA: AEROSPACE & DEFENSE TELEMETRY MARKET, BY TECHNOLOGY,  2018–2021 (USD MILLION)
                                   TABLE 115 AUSTRALIA: AEROSPACE & DEFENSE TELEMETRY MARKET, BY TECHNOLOGY,  2022–2027 (USD MILLION)
             11.4.8 NEW ZEALAND
                       11.4.8.1 Market driven by growing defense budget
                                   TABLE 116 NEW ZEALAND: AEROSPACE & DEFENSE TELEMETRY MARKET, BY PLATFORM,  2018–2021 (USD MILLION)
                                   TABLE 117 NEW ZEALAND: AEROSPACE & DEFENSE TELEMETRY MARKET, BY PLATFORM,  2022–2027 (USD MILLION)
                                   TABLE 118 NEW ZEALAND: AEROSPACE & DEFENSE TELEMETRY MARKET, BY TECHNOLOGY,  2018–2021 (USD MILLION)
                                   TABLE 119 NEW ZEALAND: AEROSPACE & DEFENSE TELEMETRY MARKET, BY TECHNOLOGY,  2022–2027 (USD MILLION)
             11.4.9 REST OF ASIA PACIFIC
                       TABLE 120 REST OF ASIA PACIFIC: AEROSPACE & DEFENSE TELEMETRY MARKET, BY PLATFORM, 2018–2021 (USD MILLION)
                       TABLE 121 REST OF ASIA PACIFIC: AEROSPACE & DEFENSE TELEMETRY MARKET, BY PLATFORM, 2022–2027 (USD MILLION)
                       TABLE 122 REST OF ASIA PACIFIC: AEROSPACE & DEFENSE TELEMETRY MARKET,  BY TECHNOLOGY, 2018–2021 (USD MILLION)
                       TABLE 123 REST OF ASIA PACIFIC: AEROSPACE & DEFENSE TELEMETRY MARKET, BY TECHNOLOGY, 2022–2027 (USD MILLION)
     11.5 REST OF THE WORLD
             11.5.1 PESTLE ANALYSIS: REST OF THE WORLD
                       TABLE 124 REST OF THE WORLD: AEROSPACE & DEFENSE TELEMETRY MARKET, BY PLATFORM, 2018–2021 (USD MILLION)
                       TABLE 125 REST OF THE WORLD: AEROSPACE & DEFENSE TELEMETRY MARKET, BY PLATFORM, 2022–2027 (USD MILLION)
                       TABLE 126 REST OF THE WORLD: AEROSPACE & DEFENSE TELEMETRY MARKET, BY TECHNOLOGY, 2018–2021 (USD MILLION)
                       TABLE 127 REST OF THE WORLD: AEROSPACE & DEFENSE TELEMETRY MARKET, BY TECHNOLOGY, 2022–2027 (USD MILLION)
                       TABLE 128 REST OF THE WORLD: AEROSPACE & DEFENSE TELEMETRY MARKET, BY COMPONENT, 2018–2021 (USD MILLION)
                       TABLE 129 REST OF THE WORLD: AEROSPACE & DEFENSE TELEMETRY MARKET, BY COMPONENT, 2022–2027 (USD MILLION)
                       TABLE 130 REST OF THE WORLD: AEROSPACE & DEFENSE TELEMETRY MARKET, BY REGION,  2018–2021 (USD MILLION)
                       TABLE 131 REST OF THE WORLD: AEROSPACE & DEFENSE TELEMETRY MARKET, BY REGION,  2022–2027 (USD MILLION)
             11.5.2 MIDDLE EAST
                       11.5.2.1 Technological advancements in telemetry systems drive market
                                   TABLE 132 MIDDLE EAST: AEROSPACE & DEFENSE TELEMETRY MARKET, BY PLATFORM,  2018–2021 (USD MILLION)
                                   TABLE 133 MIDDLE EAST AEROSPACE & DEFENSE TELEMETRY MARKET, BY PLATFORM,  2022–2027 (USD MILLION)
                                   TABLE 134 MIDDLE EAST: AEROSPACE & DEFENSE TELEMETRY MARKET, BY TECHNOLOGY,  2018–2021 (USD MILLION)
                                   TABLE 135 MIDDLE EAST: AEROSPACE & DEFENSE TELEMETRY MARKET, BY TECHNOLOGY,  2022–2027 (USD MILLION)
             11.5.3 LATIN AMERICA & AFRICA
                       11.5.3.1 Increased demand for military and commercial UAVs boosts growth
                                   TABLE 136 LATIN AMERICA & AFRICA: AEROSPACE & DEFENSE TELEMETRY MARKET, BY PLATFORM,  2018–2021 (USD MILLION)
                                   TABLE 137 LATIN AMERICA & AFRICA: AEROSPACE & DEFENSE TELEMETRY MARKET, BY PLATFORM,  2022–2027 (USD MILLION)
                                   TABLE 138 LATIN AMERICA& AFRICA: AEROSPACE & DEFENSE TELEMETRY MARKET, BY TECHNOLOGY, 2018–2021 (USD MILLION)
                                   TABLE 139 LATIN AMERICA & AFRICA: AEROSPACE & DEFENSE TELEMETRY MARKET, BY TECHNOLOGY, 2022–2027 (USD MILLION)
 
12 COMPETITIVE LANDSCAPE (Page No. - 131)
     12.1 INTRODUCTION 
     12.2 MARKET RANKING ANALYSIS OF KEY PLAYERS, 2021 
              FIGURE 33 RANKING ANALYSIS OF TOP FIVE PLAYERS: AEROSPACE & DEFENSE TELEMETRY MARKET, 2021
     12.3 MARKET SHARE ANALYSIS, 2021 
             TABLE 140 DEGREE OF COMPETITION
             FIGURE 34 SHARE OF TOP PLAYERS IN AEROSPACE & DEFENSE TELEMETRY MARKET, 2021 (%)
     12.4 COMPANY PRODUCT FOOTPRINT ANALYSIS 
             TABLE 141 COMPANY PRODUCT FOOTPRINT
             TABLE 142 COMPANY TECHNOLOGY FOOTPRINT
             TABLE 143 COMPANY REGION FOOTPRINT
     12.5 COMPANY EVALUATION QUADRANT 
             12.5.1 STAR
             12.5.2 EMERGING LEADER
             12.5.3 PERVASIVE
             12.5.4 PARTICIPANT
                        FIGURE 35 COMPETITIVE LEADERSHIP MAPPING, 2021
     12.6 START-UP EVALUATION QUADRANT 
             12.6.1 PROGRESSIVE COMPANIES
             12.6.2 RESPONSIVE COMPANIES
             12.6.3 STARTING BLOCKS
             12.6.4 DYNAMIC COMPANIES
                        FIGURE 36 COMPETITIVE LEADERSHIP MAPPING OF START-UPS, 2021
                        FIGURE 37 REVENUE ANALYSIS OF FIVE PLAYERS, 2021
                        TABLE 144 AEROSPACE & DEFENSE TELEMETRY MARKET: DETAILED LIST OF KEY STARTUP/SMES
                        TABLE 145 AEROSPACE & DEFENSE TELEMETRY MARKET: COMPETITIVE BENCHMARKING OF KEY STARTUP/SMES
     12.7 COMPETITIVE SCENARIO 
             12.7.1 DEALS
                        TABLE 146 AEROSPACE & DEFENSE TELEMETRY MARKET: DEALS, APRIL 2018–FEBRUARY 2022
             12.7.2 PRODUCT LAUNCHES
                        TABLE 147 AEROSPACE & DEFENSE TELEMETRY MARKET: PRODUCT LAUNCHES, JUNE 2020–AUGUST 2021
 
13 COMPANY PROFILES (Page No. - 148)
     13.1 INTRODUCTION 
     13.2 KEY PLAYERS 
(Business Overview, Products/Solutions/Services offered, Recent Developments, MnM View)*  
             13.2.1 L3HARRIS TECHNOLOGIES
                        TABLE 148 L3HARRIS TECHNOLOGIES: BUSINESS OVERVIEW
                        FIGURE 38 L3HARRIS TECHNOLOGIES: COMPANY SNAPSHOT
                        TABLE 149 L3HARRIS TECHNOLOGIES: PRODUCTS/SERVICES/SOLUTIONS OFFERED?
                        TABLE 150 L3HARRIS TECHNOLOGIES: PRODUCT LAUNCHES
                        TABLE 151 L3HARRIS TECHNOLOGIES: DEALS
             13.2.2 HONEYWELL INTERNATIONAL INC.
                        TABLE 152 HONEYWELL INTERNATIONAL INC.: BUSINESS OVERVIEW
                        FIGURE 39 HONEYWELL INTERNATIONAL INC.: COMPANY SNAPSHOT
                        TABLE 153 HONEYWELL INTERNATIONAL INC.: PRODUCTS/SERVICES/SOLUTIONS OFFERED
                        TABLE 154 HONEYWELL INTERNATIONAL INC.: DEALS
             13.2.3 GENERAL DYNAMICS CORPORATION
                        TABLE 155 GENERAL DYNAMICS CORPORATION: BUSINESS OVERVIEW
                        FIGURE 40 GENERAL DYNAMICS CORPORATION: COMPANY SNAPSHOT
                        TABLE 156 GENERAL DYNAMICS CORPORATION: PRODUCTS/SOLUTIONS/SERVICES OFFERED
                        TABLE 157 GENERAL DYNAMICS CORPORATION: DEALS
             13.2.4 MAXAR TECHNOLOGIES
                        TABLE 158 MAXAR TECHNOLOGIES: BUSINESS OVERVIEW
                        FIGURE 41 MAXAR TECHNOLOGIES: COMPANY SNAPSHOT
                        TABLE 159 MAXAR TECHNOLOGIES: PRODUCTS/SOLUTIONS/SERVICES OFFERED
             13.2.5 COBHAM ADVANCED ELECTRONIC SOLUTIONS
                        TABLE 160 COBHAM ADVANCED ELECTRONIC SOLUTIONS: BUSINESS OVERVIEW
                        TABLE 161 COBHAM ADVANCED ELECTRONIC SOLUTIONS: PRODUCTS/SERVICES/SOLUTIONS OFFERED?
                        TABLE 162 COBHAM ADVANCED ELECTRONIC SOLUTIONS: PRODUCT LAUNCHES
                        TABLE 163 COBHAM ADVANCED ELECTRONIC SOLUTIONS: DEALS
             13.2.6 NORSAT INTERNATIONAL INC.
                        TABLE 164 NORSAT INTERNATIONAL INC.: BUSINESS OVERVIEW
                        TABLE 165 NORSAT INTERNATIONAL INC.: PRODUCTS/SOLUTIONS/SERVICES OFFERED
             13.2.7 VIASAT INC.
                        TABLE 166 VIASAT INC.: BUSINESS OVERVIEW
                        FIGURE 42 VIASAT INC.: COMPANY SNAPSHOT
                        TABLE 167 VIASAT INC.: PRODUCTS/SOLUTIONS/SERVICES OFFERED
                        TABLE 168 VIASAT INC.: DEALS
             13.2.8 RUAG INTERNATIONAL HOLDING LTD.
                        TABLE 169 RUAG INTERNATIONAL HOLDING LTD.: BUSINESS OVERVIEW
                        FIGURE 43 RUAG INTERNATIONAL HOLDING LTD.: COMPANY SNAPSHOT
                        TABLE 170 RUAG INTERNATIONAL HOLDING LTD.: PRODUCTS/SOLUTIONS/SERVICES OFFERED
                        TABLE 171 RUAG INTERNATIONAL HOLDING LTD.: DEALS
             13.2.9 LOCKHEED MARTIN CORPORATION
                        TABLE 172 LOCKHEED MARTIN CORPORATION: BUSINESS OVERVIEW
                        FIGURE 44 LOCKHEED MARTIN CORPORATION: COMPANY SNAPSHOT
                        TABLE 173 LOCKHEED MARTIN CORPORATION: PRODUCTS/SOLUTIONS/SERVICES OFFERED?
                        TABLE 174 LOCKHEED MARTIN CORPORATION: PRODUCT/SERVICE LAUNCHES
                        TABLE 175 LOCKHEED MARTIN CORPORATION: DEALS
             13.2.10 THALES GROUP
                        TABLE 176 THALES GROUP: BUSINESS OVERVIEW
                        FIGURE 45 THALES GROUP: COMPANY SNAPSHOT
                        TABLE 177 THALES GROUP: PRODUCTS/SOLUTIONS/SERVICES OFFERED?
                        TABLE 178 THALES GROUP: DEALS
             13.2.11 RAMI
                        TABLE 179 RAMI: BUSINESS OVERVIEW
                        TABLE 180 RAMI: PRODUCTS/SOLUTIONS/SERVICES OFFERED?
             13.2.12 VERDANT TELEMETRY & ANTENNA SYSTEMS
                        TABLE 181 VERDANT TELEMETRY & ANTENNA SYSTEMS: BUSINESS OVERVIEW
                        TABLE 182 VERDANT TELEMETRY & ANTENNA SYSTEMS: PRODUCTS/SOLUTIONS/SERVICES OFFERED?
             13.2.13 SPECTRUM ANTENNA & AVIONICS SYSTEMS (P) LIMITED
                        TABLE 183 SPECTRUM ANTENNA & AVIONICS SYSTEMS (P) LIMITED: BUSINESS OVERVIEW
                        TABLE 184 SPECTRUM ANTENNA & AVIONICS SYSTEMS (P) LIMITED: PRODUCTS/SOLUTIONS/SERVICES OFFERED?
             13.2.14 JDA SYSTEMS
                        TABLE 185 JDA SYSTEMS: BUSINESS OVERVIEW
                        TABLE 186 JDA SYSTEMS: PRODUCTS/SOLUTIONS/SERVICES OFFERED?
             13.2.15 TECOM INDUSTRIES, INC
                        TABLE 187 TECOM INDUSTRIES, INC: BUSINESS OVERVIEW
                        TABLE 188 TECOM INDUSTRIES, INC: PRODUCTS/SOLUTIONS/SERVICES OFFERED?
             13.2.16 CURTISS-WRIGHT CORPORATION
                        TABLE 189 CURTISS-WRIGHT CORPORATION: BUSINESS OVERVIEW
                        FIGURE 46 CURTISS-WRIGHT CORPORATION: COMPANY SNAPSHOT
                        TABLE 190 CURTISS-WRIGHT CORPORATION: PRODUCTS/SOLUTIONS/SERVICES OFFERED
                        TABLE 191 CURTISS-WRIGHT CORPORATION: DEALS
             13.2.17 COLLINS AEROSPACE
                        TABLE 192 COLLINS AEROSPACE: BUSINESS OVERVIEW
                        TABLE 193 COLLINS AEROSPACE: PRODUCTS/SOLUTIONS/SERVICES OFFERED
                        TABLE 194 COLLINS AEROSPACE: CONTRACTS/DEALS
             13.2.18 AIRBUS
                        TABLE 195 AIRBUS: BUSINESS OVERVIEW
                        FIGURE 47 AIRBUS: COMPANY SNAPSHOT
                        TABLE 196 AIRBUS: PRODUCTS/SOLUTIONS/SERVICES OFFERED
                        TABLE 197 AIRBUS: DEALS
             13.2.19 BAE SYSTEMS
                        TABLE 198 BAE SYSTEMS: BUSINESS OVERVIEW
                        FIGURE 48 BAE SYSTEMS: COMPANY SNAPSHOT
                        TABLE 199 BAE SYSTEMS: PRODUCTS/SOLUTIONS/SERVICES OFFERED
             13.2.20 SAFRAN GROUP
                        TABLE 200 SAFRAN GROUP: BUSINESS OVERVIEW
                        FIGURE 49 SAFRAN GROUP: COMPANY SNAPSHOT
                        TABLE 201 SAFRAN GROUP: PRODUCTS/SOLUTIONS/SERVICES OFFERED
     13.3 OTHER PLAYERS 
             13.3.1 KONGSBERG
                        TABLE 202 KONGSBERG: BUSINESS OVERVIEW
                        FIGURE 50 KONGSBERG: COMPANY SNAPSHOT
                        TABLE 203 KONGSBERG: PRODUCTS/SOLUTIONS/SERVICES OFFERED
             13.3.2 ROHDE & SCHWARZ
                        TABLE 204 ROHDE & SCHWARZ: BUSINESS OVERVIEW
                        TABLE 205 ROHDE & SCHWARZ: PRODUCTS/SOLUTIONS/SERVICES OFFERED?
                        TABLE 206 ROHDE & SCHWARZ: DEALS
             13.3.3 ULTRA ELECTRONICS
                        TABLE 207 ULTRA ELECTRONICS: BUSINESS OVERVIEW
                        FIGURE 51 ULTRA ELECTRONICS: COMPANY SNAPSHOT
                        TABLE 208 ULTRA ELECTRONICS: PRODUCTS/SOLUTIONS/SERVICES OFFERED?
                        TABLE 209 ULTRA ELECTRONICS: DEALS
             13.3.4 TE CONNECTIVITY LTD.
                        TABLE 210 TE CONNECTIVITY: BUSINESS OVERVIEW
                        FIGURE 52 TE CONNECTIVITY LTD.: COMPANY SNAPSHOT
                        TABLE 211 PRODUCTS/SERVICES/SOLUTIONS OFFERED
                        TABLE 212 TE CONNECTIVITY: PRODUCT LAUNCHES
                        TABLE 213 TE CONNECTIVITY: DEALS
*Details on Business Overview, Products/Solutions/Services offered, Recent Developments, MnM View might not be captured in case of unlisted companies.  
 
14 APPENDIX (Page No. - 211)
     14.1 DISCUSSION GUIDE 
     14.2 KNOWLEDGE STORE: MARKETSANDMARKETS’ SUBSCRIPTION PORTAL 
     14.3 AVAILABLE CUSTOMIZATIONS 
     14.4 RELATED REPORTS 
     14.5 AUTHOR DETAILS 
 

The study involved four major activities in estimating the current size of the Aerospace and defense telemetry market. Exhaustive secondary research was done to collect information on the market, peer market, and parent market. The next step was to validate these findings, assumptions, and sizing with industry experts across the value chain through primary research. Both top-down and bottom-up approaches were employed to estimate the complete market size. After that, market breakdown and data triangulation were used to estimate the market size of segments and subsegments.

Secondary Research

The market share of companies offering aerospace & defense telemetry systems was arrived at based on the secondary data available through paid and unpaid sources and by analyzing the product portfolios of major companies and rating them based on their performance and quality.

In the secondary research process, sources such as government sources; SIPRI; corporate filings such as annual reports, press releases, and investor presentations of companies; white papers, journals, and certified publications; and articles by recognized authors, directories, and databases were used to identify and collect information for this study.

Secondary research was mainly used to obtain key information about the industry’s value and supply chain and to identify the key players by various products, market classifications, and segmentation according to their offerings and industry trends related to telemetry components, platforms, technologies, and regions, and key developments from both, market- and technology-oriented perspectives..

Primary Research

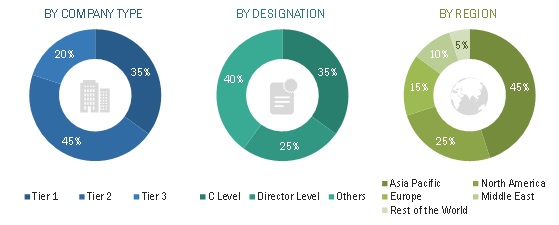
In the primary research process, various sources from the supply and demand sides were interviewed to obtain qualitative and quantitative information on the market. Primary sources from the supply side included industry experts such as vice presidents (VPs); directors from business development, marketing, and product development/innovation teams; related key executives from marine vessel manufacturers; aircraft manufacturers; aerospace & defense telemetry manufacturers; integrators; and key opinion leaders.
Rotator Cuff Injury Treatment  Market Size, and Share

To know about the assumptions considered for the study, download the pdf brochure

Market Size Estimation

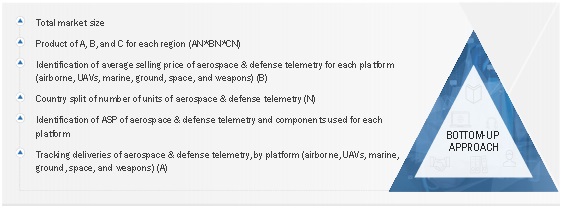
Both top-down and bottom-up approaches were used to estimate and validate the total size of the aerospace and defense telemetry market. These methods were also used extensively to estimate the size of various segments and subsegment of the market. The research methodology used to estimate the market size included the following:

  • Key players in the industry and market were identified through extensive secondary research of their product matrix and geographical presence and developments undertaken by them.
  • All percentage shares, splits, and breakdowns were determined using secondary sources and verified through primary sources.

Aerospace and defense telemetry market Size: Bottom-Up Approach
Rotator Cuff Injury Treatment  Market Size, and Share

To know about the assumptions considered for the study, download the pdf brochure

Data Triangulation

After arriving at the overall market size, the total market was split into several segments and subsegments. The data triangulation and market breakdown procedures explained below were implemented, wherever applicable, to complete the overall market engineering process and arrive at the estimated market numbers for aerospace & defense telemetry segments and subsegments. The data was triangulated by studying various factors and trends from both, the demand and supply sides. Along with this, the market size was validated using the top-down and bottom-up approaches.

The following figure indicates the market breakdown structure and the data triangulation procedure implemented in the market engineering process used to develop this report.

Report Objectives

  • To define, describe, segment, and forecast the size of the aerospace and defense telemetry market based on platform, application, component, technology, and region for the forecast period from 2022 to 2027
  • To forecast the size of various segments of the aerospace and defense telemetry market with respect to 6 major regions namely, North America, Europe, Asia Pacific, the Middle East, Rest of the World which consists of Latin America, and Africa
  • To identify and analyze key drivers, restraints, opportunities, and challenges influencing the growth of the aerospace and defense telemetry market
  • To identify the opportunities for stakeholders in the market by identifying key market and technology trends
  • To analyze competitive developments such as contracts, agreements, acquisitions & partnerships, new product launches & developments, and Research & Development (R&D) activities in the aerospace and defense telemetry market.
  • To anticipate the status of the aerospace and defense telemetry procurements by different countries, technological advancements in telemetry; and joint developments undertaken by leading players to analyze the degree of competition in the market
  • To provide a comprehensive competitive landscape of the aerospace and defense telemetry market, along with an overview of the different strategies adopted by the key market players to strengthen their position in the market

Available Customizations

MarketsandMarkets offers the following customizations for this market report:

  • Market sizing and forecast for additional countries
  • By platform, by sensor breakdown at country level
  • Additional five companies profiling

Product Analysis

  • Product matrix, which provides a detailed comparison of the product portfolio of each company in the aerospace and defense telemetry market
Custom Market Research Services

We will customize the research for you, in case the report listed above does not meet with your exact requirements. Our custom research will comprehensively cover the business information you require to help you arrive at strategic and profitable business decisions.

Request Customization

Instant Answers with GPT - Ask Now!

Ask real questions. Get complete answers !
Report Code
AS 2238
Published ON
May, 2022
Choose License Type
BUY NOW
  • SHARE
X
Request Customization
Speak to Analyst
Speak to Analyst
OR FACE-TO-FACE MEETING
PERSONALIZE THIS RESEARCH
  • Triangulate with your Own Data
  • Get Data as per your Format and Definition
  • Gain a Deeper Dive on a Specific Application, Geography, Customer or Competitor
  • Any level of Personalization
REQUEST A FREE CUSTOMIZATION
LET US HELP YOU!
  • What are the Known and Unknown Adjacencies Impacting the Aerospace and Defense Telemetry Market
  • What will your New Revenue Sources be?
  • Who will be your Top Customer; what will make them switch?
  • Defend your Market Share or Win Competitors
  • Get a Scorecard for Target Partners
CUSTOMIZED WORKSHOP REQUEST
+1-888-600-6441
  • Call Us
  • +1-888-600-6441 (Corporate office hours)
  • +1-888-600-6441 (US/Can toll free)
  • +44-800-368-9399 (UK office hours)
CONNECT WITH US
ABOUT TRUST ONLINE
©2024 MarketsandMarkets Research Private Ltd. All rights reserved
DMCA.com Protection Status Website Feedback