Amaranth Oil Market by Extraction Type (Cold Pressed, SFE, Organic Solvent), and Application (Cosmetic & Personal Care, Pharmaceutical, Food Supplements, Fragrance) - Global Trends & Forecast to 2019


[243 Pages Report] The amaranth seed oil market is expected to grow at a good CAGR of 11.9% over the next five years to be worth $700.6 million by 2019.Europe dominates the market due to the high demand for amaranth seed oil in its various end use industries. Although the European economy has still not recovered from the Euro crisis, it is expected to continue to lead this market, followed by North America and Asia-Pacific.
The factors that drive the growth in amaranth seed oil market include the beneficial properties of amaranth oil such as high squalene content, high nutrition value, its skin identical nature, and temperature versatility. The factors that prove to be a hindrance in the growth of the market are high cost of production, minimal to nil governmental support, and lack of raw material availability.
Amaranth seed oil has squalene that imparts anti-aging, anti-inflammatory, and anti-oxidation properties apart from being a natural skin identical chemical that is readily absorbed by the skin. These properties have found many applications for amaranth seed oil in cosmetics and personal care industry. The increase in demand for cosmetic and personal care products made from natural ingredients has further increased the demand for amaranth oil from this industry.
Squalene also proves beneficial for medicinal purposes with its cell rejuvenation, anti-oxidation, and immune system strengthening properties. Amaranth seed oil is increasingly being incorporated in pharmaceutical formulations to reduce the drug dosage and the related side effects. Amaranth oil, as a rich source of squalene, has also found application in cancer therapies.
Amaranth seed oil has omega-3, 6, 9 containing fatty acids that prove to be rich source of protein and vitamins. Their presence in the oil have found applications in the food supplement industry as dietary supplement capsules and dietary corrective supplements foodstuff. Amaranth oil is also used in the feed additive industry for high grade nutrition for farm animals.
The amaranth seed oil market is analyzed in terms of volume (tons) and value ($million) for all regions, and its respective major countries. The revenues from each region have been broken down by the major end-user industries, namely, cosmetic & personal care, food supplements, pharmaceuticals, and aroma (fragrance).
For this report, various secondary sources such as encyclopedia, directories, technical handbooks, company annual reports, industry association publications, world economic outlook, trade websites, and databases have been referred to identify and collect information useful for this extensive commercial study of the amaranth seed oil market. The primary sources experts from related industries and suppliers have been interviewed to obtain and verify critical information as well as to assess the future prospects and market estimations.
This report analyzes various marketing trends and establishes the most effective growth strategy in the market. It identifies market dynamics such as the drivers, restraints, opportunities, burning issues, and winning imperatives. Major companies such as Amaranth Bio Company (U.S.), AMR Amaranth a.s (Czech Republic), RusOliva (Russia), Flavex naturextracte GmbH (Germany), and Proderna Biotech Pvt. Ltd. (India), have also been profiled in this report.
Scope of the report
On the basis of region:
-
Asia-Pacific
- China
- India
- Korea
- Rest of Asia-Pacific
-
Europe
- Germany
- Italy
- France
- U.K.
- Russia
- Rest of Europe
-
North America
- U.S.
- Canada
- The Middle East & Africa
- Latin America
On the basis of extraction process:
- Supercritical fluid CO2 extraction process
- Cold pressing process
- Organic solvent (hexane) extraction process
- Other extraction process
On the basis of application:
- Cosmetics & personal care
- Food supplements
- Pharmaceuticals
- Aroma (fragrance)
- Others
The amaranth seed oil market is witnessing high growth on account of rising demand from existing and new applications that are expected to become significant in the future, especially in the European region. Europe holds major market share followed by North America and Asia-Pacific.
The amaranth seed oil market is anticipated to increase at a healthy rate annually, to reach $700.6 million, by 2019. It is primarily used in cosmetic & personal care, food supplements, pharmaceuticals, and aroma (fragrance) industry. The cosmetic & personal care industry is growing at a high rate, while the food supplement industry is experiencing steady growth. The report covers the amaranth seed oil market and its trends that concern five regions, namely, Europe, North America, Asia-Pacific, The Middle East & Africa, and Latin America; and the major countries in each region such as the U.S., Canada, Germany, France, Italy, China, India, Korea, and others.
The research and development (R&D) cost involved in terms of man hours, material, and technology are significant. There is a lot of R&D required at the micro level in amaranth seed oil to deliver a quality product. The growth in the amaranth seed oil market requires constant innovation and the introduction of new and improved products and technologies that meet the requirements. This has contributed largely to an enhanced focus on R&D by the players to bring new products with better quality as well as to decrease the cost of production by implementation of new technologies.
The raw material used for amaranth seed oil is a few select species of the amaranth crop. The amaranth crop has more than sixty identified species among which only three species are known to contain high concentration of oil. The physiology plays an important factor on the yield and quality of the oil that is expected to be produced. The amaranth oil market faces a lack of raw material availability which is also one of the major restraints for the amaranth oil market. Companies have been focusing on acquiring long term contracts for raw material supply or opting for backward integration which requires major skills and investment.
The quality of the oil also depends upon the type of extraction process that has been used for producing the oil.
Amaranth Seed Oil Market Share, by Region, 2013
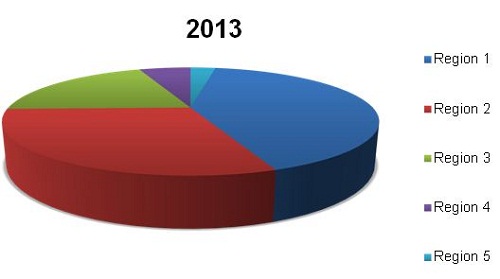
Source: MarketsandMarkets Analysis
The three major types of extraction processes used in the production of amaranth seed oil are: Supercritical fluid CO2 extraction, cold pressing, and organic solvent (hexane) extraction. Supercritical fluid CO2 extraction process produces amaranth seed oil with comparatively higher yield than the other processes. Cold pressing is expected to remain the most common method for producing amaranth oil due to a comparatively lower technology cost, better quality with preservation of more nutrients, although it has a lower yield rate. However, supercritical fluid CO2 extraction process is expected to grow at a faster pace in the future as it has a better yield with good quality as compared to the cold pressing extraction process.
 Exclusive indicates content/data unique to MarketsandMarkets and not available with any competitors.
Table Of Contents
1 Introduction (Page No. - 36)
1.1 Objectives
1.2 Scope Of The Report
1.3 Research Methodology
1.4 Important Secondary Sources
1.5 Assumptions
1.6 Key Questions Answered
2 Executive Summary (Page No. - 47)
2.1 Introduction
2.2 Industry Snapshot
3 Premium Insights (Page No. - 51)
3.1 Amaranth Seed Oil Market Segmentation
3.2 Market, By Region ($Million), 2013-2019
3.3 Market Size, By Region, 2012-2019 ($Million)
3.4 Market Share (Volume & Value), By Region, 2013
3.5 Market, By Application ($Million), 2013-2019
3.6 Market Size, By Application, 2012-2019 (Tons)
3.7 Amaranth Oil Market Size, By Application, 2012-2019 ($Million)
3.8 Amaranth Oil Market, By Extraction Type, 2013-2019 ($Million)
3.9 Amaranth Oil Market Size, By Extraction Type, 2012-2019 (Tons)
3.10 Amaranth Oil Market Size, By Extraction Type, 2012-2019 ($Million)
4 Market Overview (Page No. - 62)
4.1 Introduction
4.1.1 Amaranth Crop
4.1.2 Amaranth Seed Oil
4.2 Amaranth Seed Oil Extraction
4.2.1 Cold Pressing
4.2.2 Supercritical Fluid CO2 Extraction
4.2.3 Organic Solvent (Hexane) Extraction
4.2.4 Others
4.3 Supply & Value Chain
4.4 Market Dynamics
4.4.1 Drivers
4.4.2 Restraints
4.4.3 Opportunities
4.4.4 Winning Imperatives
4.5 Burning Issues
4.5.1 Ngo’s Endorsing Ban On Killing Of Sharks
4.5.2 Governmental Organizations Endorsing Ban On Killing Of Sharks
4.5.3 Companies Supporting Ban On Killing Of Sharks
4.5.4 Shark Killing Data
4.6 Porter’s Five Forces Analysis
4.7 Swot Analysis
4.8 Price Analysis
4.9 Amaranth Seed Oil Production: By Region
4.9.1 Asia-Pacific
4.9.2 North America
4.9.3 Latin America
4.9.4 Europe
4.9.5 The Middle East & Africa
5 Market Analysis, By Extraction Type (Page No. - 91)
5.1 Key Findings
5.2 Amaranth Seed Oil Market Analysis, By Extraction Type
5.2.1 Introduction
5.3 Amaranth Seed Oil Market
5.3.1 Sfe Amaranth Seed Oil Segment Expected To Have The Highest Growth
5.4 Supercritical CO2 Extraction
5.4.1 Use Of Sfe Technology Rising In Europe And North America
5.5 Cold Pressing
5.5.1 Cold Pressing To Continue To Dominate Large Share Of The Amaranth Seed Oil Market
5.6 Organic Solvent (Hexane) Extraction
5.6.1 Organic Solvent Extraction Likely To Experience Moderate Growth From 2014 To 2019
5.7 Other Technologies
5.7.1 Use Of Other Technologies For Amaranth Seed Oil Production Set To Experience High Growth In North America
6 Amaranth Seed Oil Market Analysis, By Application (Page No. - 104)
6.1 Key Findings
6.2 Market Analysis, By Application
6.2.1 Introduction
6.3 Amaranth Seed Oil Market
6.3.1 Cosmetics & Personal Care To Be The Biggest Consumer Of Amaranth Seed Oil
6.4 Pharmaceuticals
6.4.1 Europe Has The Largest Market Size For Pharmaceutical Applications Of Amaranth Seed Oil
6.5 Cosmetics & Personal Care
6.5.1 1highest Growth Rate In North America
6.6 Food Supplements
6.6.1 Increasing Demand In Europe And North America
6.7 Aromatics (Fragrance)
6.7.1 North America Expected To Have The Highest Growth For The Aromatics Segment
6.8 Other Applications
6.8.1 Europe Expected To Have The Highest Growth For The Other Applications Segment
7 Market Analysis, By Region (Page No. - 120)
7.1 Key Findings
7.2 Market Analysis, By Region
7.2.1 Introduction
7.3 Amaranth Seed Oil Market
7.3.1 Europe To Continue To Be The Biggest Consumer Of Amaranth Seed Oil
7.4 Europe
7.4.1 Cosmetics & Personal Care Segment Is The Biggest Consumer Of Amaranth Seed Oil In Europe
7.4.2 Sfe Technology To Witness Huge Growth In The Europe Market
7.4.3 The French Amaranth Seed Oil Market To Have The Highest Cagr In The Region
7.4.3.1 France
7.4.3.1.1 The Cosmetics & Personal Care Industry Is The Largest Segment For Amaranth Seed Oil Market In France
7.4.3.1.2 Amaranth Seed Oil Produced By Sfe Technology To Have The Highest Growth
7.4.3.2 U.K.
7.4.3.2.1 Amaranth Seed Oil Consumption Growing With Increasing Demand From Cosmetics & Personal Care Segment
7.4.3.2.2 Sfe Technology To Have The Highest Growth In The U.K. Amaranth Seed Oil Market
7.4.3.3 Germany
7.4.3.3.1 The Cosmetics & Personal Care Industry Consuming Major Share Of Amaranth Seed Oil In Germany
7.4.3.3.2 Amaranth Seed Oil Produced By Sfe Technology To Have The Highest Cagr In Germany
7.4.3.4 Russia
7.4.3.4.1 Pharmaceutical Applications To Have The Highest Growth In The Russian Amaranth Seed Oil Market
7.4.3.4.2 Sfe Technology Expected To Overtake Cold Pressing In Russia
7.4.3.5 Italy
7.4.3.5.1 Cosmetics & Personal Care To Remain The Biggest Segment For The Italian Amaranth Seed Oil Market
7.4.3.5.2 Consumption Of Sfe Amaranth Seed Oil To Be The Highest In Italy
7.4.3.6 Rest Of Europe
7.4.3.6.1 Cosmetics Segment To Account For The Major Consumption Of Amaranth Seed Oil
7.4.3.6.2 Supercritical CO2 Extracted To Have The Highest Growth Rate
7.5 North America
7.5.1 Pharmaceuticals To Be The Fastest Growing Segment In North America
7.5.2 Application Of Sfe Technology For Amaranth Seed Oil Production To Have The Highest Cagr
7.5.3 U.S. To Continue Dominating The North America Amaranth Seed Oil Market
7.5.3.1 U.S.
7.5.3.1.1 Cosmetics & Personal Care To Have The Largest Share Of The U.S. Amaranth Seed Oil Market
7.5.3.1.2
7.5.3.2 Canada
7.5.3.2.1 Pharmaceutical Applications Of Amaranth Seed Oil To Have The Highest Growth In Canada
7.5.3.2.2 Sfe Amaranth Seed Oil Accounts For The Major Share Of Amaranth Oil Consumption In Canada
7.6 Asia-Pacific
7.6.1 Pharmaceutical Segment Estimated To Have The Highest Cagr
7.6.2 Cold Pressing To Be The Most Used Technology For Producing Amaranth Seed Oil In Asia-Pacific
7.6.3 China To Have The Largest Share In The Asia-Pacific Amaranth Seed Oil Market
7.6.3.1 China
7.6.3.1.1 Cosmetics & Personal Care Is The Biggest Segment For The Chinese Amaranth Seed Oil Market
7.6.3.1.2 Cold Pressed Accounts For A Major Share Of The Total Consumption In China
7.6.3.2 India
7.6.3.2.1 Increase In Spending Power Increasing Demand For Luxury Products
7.6.3.2.2 Low Capitals Move In Favor Of Cold Pressing
7.6.3.3 Korea
7.6.3.3.1 Flourishing Cosmetics Industry Driving Growth For The Amaranth Seed Oil Market
7.6.3.3.2 Sfe Amaranth Seed Oil To Have A High Growth Rate In The Region
7.6.3.4 Rest Of Asia-Pacific
7.6.3.4.1 Cosmetics & Personal Care Industry Is The Largest Consumer Of Amaranth Seed Oil
7.6.3.4.2 Cold Pressing Is The Largest Segment In The Rest Of Asia-Pacific Market
7.7 The Middle East & Africa
7.7.1 The Middle East & Africa Amaranth Seed Oil Market Expected To Have A Below Average Growth
7.7.2 Cold Pressed Amaranth Seed Oil To Account For The Major Share Of Consumption In The Region
7.8 Latin America
7.8.1 Cosmetics & Personal Care Segment Will Be The Biggest Segment In The Region
7.8.2 Cold Pressed Amaranth Seed Oil Accounts For A Major Share Of Amaranth Oil Consumption
8 Competetive Landscape (Page No. - 204)
8.1 Producing Companies
8.2 Production Capacity, Company-Wise, 2013
8.3 Market Activity
8.4 Amaranth Oil Market: Government Initiatives
9 Company Profiles (Overview, Financial*, Products & Services, Strategy, And Developments) (Page No. - 210)
9.1 Amaranth Seed Oil Market: Company Profile List
9.2 Amr Amaranth A.S
9.3 Amaranth Bio Company
9.4 Amaranth Nord
9.5 Proderna Biotech PVT. LTD.
9.6 Flavex Naturextracte Gmbh
9.7 Nu-World Foods
9.8 Saar
9.9 Nans Products PVT. LTD.
9.10 Irel, Spol. S.R.O
9.11 Flaveko Trade Spol. S.R.O
9.12 Dk Mass S.R.O
9.13 Rusoliva PVT. LTD. *Details Might Not Be Captured In Case Of Unlisted Companies.
10 References (Page No. - 239)
10.1 References Related To Properties
10.2 References Related To Extraction
10.3 References Related To Shark Killing And Shark Liver Oil Squalene
List of Tables (112 Tables)
Table 1 Cold Pressing: Advantages And Disadvantages
Table 2 Supercritical Fluid CO2 Extraction: Advantages And Disadvantages
Table 3 Organic Solvent (Hexane) Extraction: Advantages And Disadvantages
Table 4 Amaranth Seed Oil Market: Average Selling Prices, 2012-2019 ($/Ton)
Table 5 Asia-Pacific: Production, By Country, 2013
Table 6 North America: Production, By Country, 2013
Table 7 Latin America: Production, By Country, 2013
Table 8 Europe: Production, By Country, 2013
Table 9 The Middle East & Africa: Production, By Country, 2013
Table 10 Amaranth Seed Oil Market Size, By Extraction Type, 2012–2019 (Tons)
Table 11 Amaranth Seed Oil Market Size, By Extraction Type, 2012–2019 ($Million)
Table 12 By Supercritical CO2 Extraction Process Market Size, By Region, 2012–2019 (Tons)
Table 13 By Supercritical CO2 Extraction Process Market Size, By Region, 2012–2019 ($Million)
Table 14 By Cold Pressing Market Size, By Region, 2012–2019 (Tons)
Table 15 By Cold Pressing Market Size, By Region, 2012–2019 ($Million)
Table 16 By Organic Solvent (Hexane) Extraction Process Market Size, By Region, 2012–2019 (Tons)
Table 17 By Organic Solvent (Hexane) Extraction Process Market Size, By Region, 2012–2019 ($Million)
Table 18 By Other Technologies Market Size, By Region, 2012–2019 (Tons)
Table 19 By Other Technologies Market Size, By Region, 2012–2019 ($Million)
Table 20 Amaranth Seed Oil Market Size, By Application, 2012-2019 (Tons)
Table 21 Amaranth Oil Market Size, By Application, 2012-2019 ($Million)
Table 22 In Pharmaceuticals Application Market Size, By Region, 2012-2019 (Tons)
Table 23 In Pharmaceuticals Application Market Size, By Region, 2012-2019 ($Million)
Table 24 In Cosmetics & Personal Care Application Market Size, By Region, 2012-2019 (Tons)
Table 25 In Cosmetics & Personal Care Application Market Size, By Region, 2012-2019 ($Million)
Table 26 In Food Supplements Application Market Size, By Region, 2012-2019 (Tons)
Table 27 In Food Supplements Application Market Size, By Region, 2012-2019 ($Million)
Table 28 In Aromatics (Fragrance) Application Market Size, By Region, 2012-2019 (Tons)
Table 29 In Aromatics (Fragrance) Market Size, By Region, 2012-2019 ($Million)
Table 30 In Other Applications Market Size, By Region, 2012–2019 (Tons)
Table 31 In Other Applications Market Size, By Region, 2012-2019 ($Million)
Table 32 Amaranth Seed Oil Market Size, By Region, 2012-2019 (Tons)
Table 33 Amaranth Oil Market Size, By Region, 2012-2019 ($Million)
Table 34 Europe: Amaranth Oil Market Size, By Application, 2012-2019 (Tons)
Table 35 Europe: Amaranth Seed Oil Market Size, By Application, 2012-2019 ($Million)
Table 36 Europe: Market Size, By Type, 2012-2019 (Tons)
Table 37 Europe: Amaranth Oil Market Size, By Type, 2012-2019 ($Million)
Table 38 Europe: Market Size, By Country, 2012-2019 (Tons)
Table 39 Europe: Amaranth Oil Market Size, By Country, 2012-2019 ($Million)
Table 40 France: Market Size, By Application, 2012-2019 (Tons)
Table 41 France: Amaranth Oil Market Size, By Application, 2012-2019 ($Million)
Table 42 France: Market Size, By Type, 2012-2019 (Tons)
Table 43 France: Amaranth Oil Market Size, By Type, 2012-2019 ($Million)
Table 44 U.K.: Market Size, By Application, 2012-2019 (Tons)
Table 45 U.K.: Amaranth Oil Market Size, By Application, 2012-2019 ($Million)
Table 46 U.K.: Amaranth Seed Oil Market Size, By Type, 2012-2019 (Tons)
Table 47 U.K.: Amaranth Oil Market Size, By Type, 2012-2019 ($Million)
Table 48 Germany: Market Size, By Application, 2012-2019 (Tons)
Table 49 Germany: Amaranth Oil Market Size, By Application, 2012-2019 ($Million)
Table 50 Germany: Amaranth Seed Oil Market Size, By Type, 2012-2019 (Tons)
Table 51 Germany: Amaranth Oil Market Size, By Type, 2012-2019 ($Million)
Table 52 Russia: Market Size, By Application, 2012-2019 (Tons)
Table 53 Russia: Amaranth Oil Market Size, By Application, 2012-2019 ($Million)
Table 54 Russia: Market Size, By Type, 2012-2019 (Tons)
Table 55 Russia: Amaranth Oil Market Size, By Type, 2012-2019 ($Million)
Table 56 Italy: Market Size, By Application, 2012-2019 (Tons)
Table 57 Italy: Amaranth Oil Market Size, By Application, 2012-2019 ($Million)
Table 58 Italy: Amaranth Seed Oil Market Size, By Type, 2012-2019 (Tons)
Table 59 Italy: Amaranth Oil Market Size, By Type, 2012-2019 ($Million)
Table 60 Rest Of Europe: Market Size, By Application, 2012-2019 (Tons)
Table 61 Rest Of Europe: Amaranth Oil Market Size, By Application, 2012-2019 ($Million)
Table 62 Rest Of Europe: Market Size, By Type, 2012-2019 (Tons)
Table 63 Rest Of Europe: Amaranth Oil Market Size, By Type, 2012-2019 ($Million)
Table 64 North America: Amaranth Seed Oil Market Size, By Application, 2012-2019 (Tons)
Table 65 North America Amaranth Oil: Market Size, By Application, 2012-2019 ($Million)
Table 66 North America: Amaranth Seed Oil Market Size, By Type, 2012-2019 (Tons)
Table 67 North America: Amaranth Oil Market Size, By Type, 2012-2019 ($Million)
Table 68 North America: Market Size, By Country, 2012-2019 (Tons)
Table 69 North America: Amaranth Oil Market Size, By Country, 2012-2019 ($Million)
Table 70 U.S.: Market Size, By Application, 2012-2019 (Tons)
Table 71 U.S.: Amaranth Oil Market Size, By Application, 2012-2019 ($Million)
Table 72 U.S.: Amaranth Oil Market Size, By Type, 2012-2019 (Tons)
Table 73 U.S.: Amaranth Seed Oil Market Size, By Type, 2012-2019 ($Million)
Table 74 Canada: Amaranth Oil Market Size, By Application, 2012-2019 (Tons)
Table 75 Canada: Market Size, By Application, 2012-2019 ($Million)
Table 76 Canada: Amaranth Oil Market Size, By Type, 2012-2019 (Tons)
Table 77 Canada: Market Size, By Type, 2012-2019 ($Million)
Table 78 Asia-Pacific: Amaranth Oil Market Size, By Application, 2012-2019 (Tons)
Table 79 Asia-Pacific: Amaranth Oil Market Size, By Application, 2012-2019 ($Million)
Table 80 Asia-Pacific: Amaranth Seed Oil Market Size, By Type, 2012-2019 (Tons)
Table 81 Asia-Pacific: Amaranth Oil Market Size, By Type, 2012-2019 ($Million)
Table 82 Asia-Pacific: Amaranth Oil Market Size, By Country, 2012-2019 (Tons)
Table 83 Asia-Pacific: Amaranth Seed Oil Market Size, By Country, 2012-2019 ($Million)
Table 84 China: Amaranth Oil Market Size, By Application, 2012-2019 (Tons)
Table 85 China: Market Size, By Application, 2012-2019 ($Million)
Table 86 China: Amaranth Oil Market Size, By Type, 2012-2019 (Tons)
Table 87 China: Amaranth Seed Oil Market Size, By Type, 2012-2019 ($Million)
Table 88 India: Market Size, By Application, 2012-2019 (Tons)
Table 89 India: Amaranth Oil Market Size, By Application, 2012-2019 ($Million)
Table 90 India: Amaranth Oil Market Size, By Type, 2012-2019 (Tons)
Table 91 India: Amaranth Seed Oil Market Size, By Type, 2012-2019 ($Million)
Table 92 Korea: Market Size, By Application, 2012-2019 (Tons)
Table 93 Korea: Amaranth Oil Market Size, By Application, 2012-2019 ($Million)
Table 94 Korea: Amaranth Oil Market Size, By Type, 2012-2019 (Tons)
Table 95 Korea: Amaranth Seed Oil Market Size, By Type, 2012-2019 ($Million)
Table 96 Rest Of Asia-Pacific: Market Size, By Application, 2012-2019 (Tons)
Table 97 Rest Of Asia-Pacific: Amaranth Oil Market Size, By Application, 2012-2019 ($Million)
Table 98 Rest Of Asia-Pacific: Amaranth Seed Oil Market Size, By Type, 2012-2019 (Tons)
Table 99 Rest Of Asia-Pacific: Amaranth Oil Market Size, By Type, 2012-2019 ($Million)
Table 100 The Middle East & Africa: Amaranth Seed Oil Market Size, By Application, 2012-2019 (Tons)
Table 101 The Middle East & Africa: Market Size, By Application, 2012-2019 ($Million)
Table 102 The Middle East & Africa: Amaranth Oil Market Size, By Type, 2012-2019 (Tons)
Table 103 The Middle East & Africa: Market Size, By Type, 2012-2019 ($Million)
Table 104 Latin America: Amaranth Seed Oil Market Size, By Type, 2012-2019 (Tons)
Table 105 Latin America: Amaranth Oil Market Size, By Type, 2012-2019 ($Million)
Table 106 Latin America: Market Size, By Type, 2012-2019 (Tons)
Table 107 Latin America: Amaranth Oil Market Size, By Type, 2012-2019 ($Million)
Table 108 Company Mapping
Table 109 Production Capacity, By Company, 2013
Table 110 Amaranth Seed Oil Market Activity
Table 111 Patent Analysis 2009-2013
Table 112 Amaranth Seed Oil Market: Government Initiatives & Their Effects
List of Figures (123 Figures)
Figure 1 Amaranth Seed Oil Market Segmentation
Figure 2 Research Methodology- Approach
Figure 3 Data Mining & Analysis - Triangulation
Figure 4 Research Methodology - Demand Side
Figure 5 Research Methodology - Supply Side
Figure 6 List Of Important Secondary Sources
Figure 7 Amaranth Seed Oil Market Size, By Region, Application & Extraction Type (Tons), 2013
Figure 8 Amaranth Crop Producing Regions
Figure 9 End-User Segments And Their Applications
Figure 10 Supply & Value Chain
Figure 11 Growth Strategies Followed By Companies, 2009–2014
Figure 12 Porter’s Five Forces Analysis (Summary)
Figure 13 Swot Analysis
Figure 14 Amaranth Seed Oil Market Share (Volume), By Extraction Type, 2013 Vs. 2019
Figure 15 Amaranth Seed Oil Market Share (Value), By Extraction Type, 2013 Vs. 2019
Figure 16 By Supercritical CO2 Extraction Process Market Share (Volume), By Region, 2013 Vs. 2019
Figure 17 By Supercritical CO2 Extraction Process Market Share (Value), By Region, 2013 Vs. 2019
Figure 18 By Cold Pressing Market Share (Volume), By Region, 2013 Vs. 2019
Figure 19 By Cold Pressing Market Share (Value), By Region, 2013 Vs. 2019
Figure 20 By Organic Solvent (Hexane) Extraction Process Market Share (Volume), By Region, 2013 Vs. 2019
Figure 21 By Organic Solvent (Hexane) Extraction Process Market Share (Value), By Region, 2013 Vs. 2019
Figure 22 By Other Technologies Market Share (Volume), By Region, 2013 Vs. 2019
Figure 23 By Other Technologies Market Share (Value), By Region, 2013 Vs. 2019
Figure 24 Amaranth Seed Oil Market Share (Volume), By Application, 2013 Vs. 2019
Figure 25 Market Share (Value), By Region, 2013 Vs. 2019
Figure 26 In Pharmaceuticals Application Market Share (Volume), By Region, 2013 Vs. 2019
Figure 27 In Pharmaceuticals Application Market Share (Value), By Region, 2013 Vs. 2019
Figure 28 In Cosmetics & Personal Care Application Market Share (Volume), By Region, 2013 Vs. 2019
Figure 29 In Cosmetics & Personal Care Application Market Share (Value), By Region, 2013 Vs. 2019
Figure 30 In Food Supplements Application Market Share (Volume), By Region, 2013 Vs. 2019
Figure 31 In Food Supplements Application Market Share (Value), By Region, 2013 Vs. 2019
Figure 32 In Aromatics (Fragrance) Application Market Share (Volume), By Region, 2013 Vs. 2019
Figure 33 In Aromatics (Fragrance) Market Share (Value), By Region, 2013 Vs. 2019
Figure 34 In Other Applications Market Share (Volume), By Region, 2013 Vs.2019
Figure 35 In Other Applications Market Share (Value), By Region, 2013 Vs.2019
Figure 36 Amaranth Seed Oil Market Share, By Region, 2013 Vs. 2019
Figure 37 Market Share (Value), By Region, 2013 Vs. 2019
Figure 38 Europe: Amaranth Seed Oil Market Share (Volume), By Application, 2013 Vs. 2019
Figure 39 Europe: Amaranth Oil Market Share (Value), By Application, 2013 Vs. 2019
Figure 40 Europe: Market Share (Volume), By Type, 2013 Vs. 2019
Figure 41 Europe: Market Share (Value), By Type, 2013 Vs. 2019
Figure 42 Europe: Amaranth Oil Market Share (Volume), By Country, 2013 Vs. 2019
Figure 43 Europe Amaranth Seed Oil Market Share (Value), By Country, 2013 Vs. 2019
Figure 44 France: Amaranth Oil Market Share (Volume), By Application, 2013 Vs. 2019
Figure 45 France: Market Share (Value), By Application, 2013 Vs. 2019
Figure 46 France: Amaranth Oil Market Share (Volume), By Type, 2013 Vs. 2019
Figure 47 France: Amaranth Seed Oil Market Share (Value), By Type, 2013 Vs. 2019
Figure 48 U.K.: Amaranth Oil Market Share (Volume), By Application, 2013 Vs. 2019
Figure 49 U.K.: Market Share (Value), By Application, 2013 Vs. 2019
Figure 50 U.K.: Amaranth Seed Oil Market Share (Volume), By Type, 2013 Vs. 2019
Figure 51 U.K.: Market Share (Value), By Type, 2013 Vs. 2019
Figure 52 Germany: Market Share (Volume), By Application, 2013 Vs. 2019
Figure 53 Germany: Market Share (Value), By Application, 2013 Vs. 2019
Figure 54 Germany: Amaranth Seed Oil Market Share (Volume), By Type, 2013 Vs. 2019
Figure 55 Germany: Market Share (Value), By Type, 2013 Vs. 2019
Figure 56 Russia: Market Share (Volume), By Application, 2013 Vs. 2019
Figure 57 Russia: Amaranth Seed Oil Market Share (Value), By Application, 2013 Vs. 2019
Figure 58 Russia: Market Share (Volume), By Type, 2013 Vs. 2019
Figure 59 Russia: Market Share (Value), By Type, 2013 Vs. 2019
Figure 60 Italy: Amaranth Seed Oil Market Share (Volume), By Application, 2013 Vs. 2019
Figure 61 Italy: Market Share (Value), By Application, 2013 Vs. 2019
Figure 62 Italy: Market Share (Volume), By Type, 2013 Vs. 2019
Figure 63 Italy: Market Share (Value), By Type, 2013 Vs. 2019
Figure 64 Rest Of Europe: Amaranth Seed Oil Market Share (Volume), By Application, 2013 Vs. 2019
Figure 65 Rest Of Europe: Amaranth Oil Market Share (Value), By Application, 2013 Vs. 2019
Figure 66 Rest Of Europe: Market Share (Volume), By Type, 2013 Vs. 2019
Figure 67 Rest Of Europe: Amaranth Seed Oil Market Share (Value), By Type, 2013 Vs. 2019
Figure 68 North America: Amaranth Oil Market Share (Volume), By Application, 2013 Vs. 2019
Figure 69 North America: Amaranth Oil Market Share (Value), By Application, 2013 Vs. 2019
Figure 70 North America: Amaranth Seed Oil Market Share (Volume), By Type, 2013 Vs. 2019
Figure 71 North America: Market Share (Value), By Type, 2013 Vs. 2019
Figure 72 North America: Market Share (Volume), By Country, 2013 Vs. 2019
Figure 73 North America: Amaranth Seed Oil Market Share (Value), By Country, 2013 Vs. 2019
Figure 74 U.S.: Amaranth Oil Market Share (Volume), By Application, 2013 Vs. 2019
Figure 75 U.S.: Market Share (Value), By Application, 2013 Vs. 2019
Figure 76 U.S.: Market Share (Volume), By Type, 2013 Vs. 2019
Figure 77 U.S. Amaranth Seed Oil Market Share (Value), By Type, 2013 Vs. 2019
Figure 78 Canada: Market Share (Volume), By Application, 2013 Vs. 2019
Figure 79 Canada: Market Share (Value), By Application, 2013 Vs. 2019
Figure 80 Canada: Market Share (Volume), By Type, 2013 Vs. 2019
Figure 81 Canada: Amaranth Seed Oil Market Share (Value), By Type, 2013 Vs. 2019
Figure 82 Asia-Pacific: Amaranth Oil Market Share (Volume), By Application, 2013 Vs. 2019
Figure 83 Asia-Pacific: Amaranth Oil Market Share (Value), By Application, 2013 Vs. 2019
Figure 84 Asia-Pacific: Amaranth Seed Oil Market Share (Volume), By Type, 2013 Vs. 2019
Figure 85 Asia-Pacific: Market Share (Value), By Type, 2013 Vs. 2019
Figure 86 Asia-Pacific: Market Share (Volume), By Country, 2013 Vs. 2019
Figure 87 Asia-Pacific: Market Share (Value), By Country, 2013 Vs. 2019
Figure 88 China: Market Share (Volume), By Application, 2013 Vs. 2019
Figure 89 China: Amaranth Seed Oil Market Share (Value), By Application, 2013 Vs. 2019
Figure 90 China: Market Share (Volume), By Type, 2013 Vs. 2019
Figure 91 China: Market Share (Value), By Type, 2013 Vs. 2019
Figure 92 India: Market Share (Volume), By Application, 2013 Vs. 2019
Figure 93 India: Market Share (Value), By Application, 2013 Vs. 2019
Figure 94 India: Market Share (Volume), By Type, 2013 Vs. 2019
Figure 95 India: Amaranth Seed Oil Market Share (Value), By Type, 2013 Vs. 2019
Figure 96 Korea: Amaranth Oil Market Share (Volume), By Application, 2013 Vs. 2019
Figure 97 Korea: Market Share (Value), By Application, 2013 Vs. 2019
Figure 98 Korea: Market Share (Volume), By Type, 2013 Vs. 2019
Figure 99 Korea: Market Share (Value), By Type, 2013 Vs. 2019
Figure 100 Rest Of Asia-Pacific: Amaranth Seed Oil Market Share (Volume), By Application, 2013 Vs. 2019
Figure 101 Rest Of Asia-Pacific: Market Share (Value), By Application, 2013 Vs. 2019
Figure 102 Rest Of Asia-Pacific: Market Share (Volume), By Type, 2013 Vs. 2019
Figure 103 Rest Of Asia-Pacific: Amaranth Seed Oil Market Share (Value), By Type, 2013 Vs. 2019
Figure 104 The Middle East & Africa: Market Share (Volume), By Application, 2013 Vs. 2019
Figure 105 The Middle East & Africa: Amaranth Oil Market Share (Value), By Application, 2013 Vs. 2019
Figure 106 The Middle East & Africa: Market Share (Volume), By Type, 2013 Vs. 2019
Figure 107 The Middle East & Africa: Amaranth Seed Oil Market Share (Value), By Type, 2013 Vs. 2019
Figure 108 Latin America: Market Share (Volume), By Type, 2013 Vs. 2019
Figure 109 Latin America: Market Share (Value), By Type, 2013 Vs. 2019
Figure 110 Latin America: Amaranth Seed Oil Market Share (Volume), By Type, 2013 Vs. 2019
Figure 111 Latin America: Amaranth Oil Market Share (Value), By Type, 2013 Vs. 2019
Figure 112 Amr Amaranth: Strategies
Figure 113 Amr Amaranth A.S: Swot Analysis
Figure 114 Amaranth Bio Company: Strategies
Figure 115 Amaranth Bio Company: Swot Analysis
Figure 116 Amaranth Nord’s Strategy
Figure 117 Pure CO2 Extracts (Product Type)
Figure 118 Saar: Strategies
Figure 119 Nans Products Company: Strategies
Figure 120 Irel: Strategies
Figure 121 Flaveko Trade: Strategies
Figure 122 Dk Mass: Strategies
Figure 123 Rusoliva: Strategies


Growth opportunities and latent adjacency in Amaranth Oil Market