Anionic Surfactants Market by Type (LAS, Lignosulfonates, AES/FAS, Alkyl Sulfates/Ether Sulfates, Sarcosinates, Alpha Olefin Sulfonates, Phosphate Esters), Application (Home Care, Personal Care, Oil & Gas, Construction), and Region - Global Forecast to 2022


[124 Pages Report] The global anionic surfactants market was USD 15.91 billion in 2016 and is projected to reach USD 20.10 billion by 2022, at a CAGR of 4.2% during the forecast period. In this report, 2016 is considered as the base year and the forecast period is 2017-2022. Anionic surfactants are surface active agents with an amphiphilic anion and a cation that is most commonly an alkaline metal. LAS is the most widely used anionic surfactant as an active agent in detergents for home care applications. They are used in applications as foaming, wetting, and cleaning agents, among others. The major applications of anionic surfactants include home care, personal care, and construction, among others.
Market Dynamics
Drivers
- Growth in end-use industries
- Increasing need for greener and sustainable surfactants
Restraints
- Stringent government regulations on toxic chemicals
Opportunities
- Growing bio-based surfactants market
Increasing need for greener and sustainable surfactants
The global surfactants market is primarily dominated by chemical surfactants derived from oleochemical or petrochemical sources. However, due to the rising concerns about for the safety of the environment and human health, governments and surfactant manufacturers are majorly focusing on shifting to renewable and sustainable products in every application. This has led to high demand for biologically derived products that pose a negligible threat to the environment as compared to the conventional petroleum-derived products that are toxic in nature and bio-accumulate in the marine environment. These types of surfactants are considered eco-friendly raw materials due to their high level of safety and biodegradability. The manufacturers are, therefore, keen to adapt to this changing trend of utilizing green solutions in their products.
The objectives of this study are:
- To estimate and forecast the global anionic surfactants market size, in terms of volume and value
- To provide detailed information regarding the major factors (drivers, restraints, and opportunities) influencing the growth of the market
- To define, describe, and forecast the market size by application, namely, home care, personal care, oil & gas, construction, and others
- To define, describe, and forecast the market size by type, namely, linear alkylbenzene sulfonate (LAS), lignosulfonates, alcohol ether sulfates/fatty alcohol sulfates (AES/FAS), sarcosinates, alpha olefins sulfonates (AOS), and others
- To forecast the size of the market based on five major regions, namely, Asia Pacific (APAC), North America, Europe, the Middle East & Africa, and South America
- To strategically analyze micromarkets with respect to individual growth trends, prospects, and their contribution to the overall market
- To analyze opportunities in the market for stakeholders and provide a competitive landscape of the market
- To track and analyze recent developments, such as mergers & acquisitions, expansions, and new product developments in the market
- To strategically profile the key market players and comprehensively analyze their core competencies and market shares
This research study involves extensive use of secondary sources, directories, and databases (such as Hoovers, Bloomberg BusinessWeek, and Factiva) to identify and collect information useful for this technical, market-oriented, and commercial study of the anionic surfactants market. The primary sources mainly include several industry experts from core and related industries and preferred suppliers, manufacturers, distributors, service providers, and organizations related to all segments of the industry�s supply chain. After arriving at the overall market size, the total market has been split into several segments and subsegments. The figure below illustrates the breakdown of the primary interviews based on company type, designation, and region conducted during the research study.
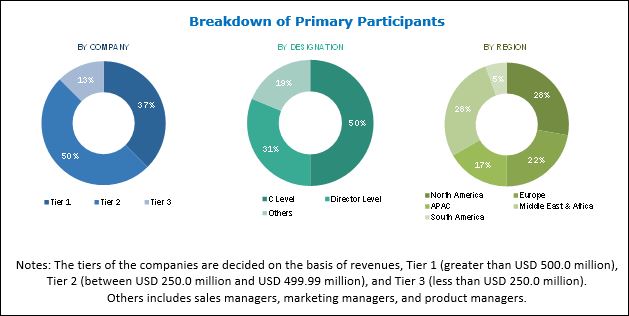
To know about the assumptions considered for the study, download the pdf brochure
The global anionic surfactants market is becoming increasingly competitive, there are many market participants, and some of these are market leaders. AkzoNobel (Netherlands), BASF (Germany), Clariant (Switzerland), DowDuPont (US), and Evonik (Germany), among others. These top players have significant control over the market and they retain their respective positions by launching new products and undertaking substantial investments to comply with regulations to produce energy efficient and environment-friendly products. Players in this market have adopted various strategies to expand their global presence and increase their market shares. New product launch, expansion, merger & acquisition, and contract & agreement are some major strategies adopted to achieve growth in the anionic surfactants market. All these factors make the anionic surfactants market highly competitive.
Market Developments
- In March 2017, Evonik Industries AG (Germany) launched a new product Surfynol 355 surfactant for application as a wetting agent.
- In May 2017, Akzo Noble N.V. (Netherlands) completed constructing a production plant in Shanghai with an investment of USD 41 million. This plant boosted the company's production base in China. Surfactants supplied by the company are used in detergents, shampoos, and functional chemical products.
- In May 2017, AkzoNobel N.V. (Netherlands) and Atul Limited (India) together agreed to start the production of monochloroacetic acid (MCA) in 2016. The production in the plant is expected to start from 2019. The strategy helped the company to enhance its position in the Asian market.
Target Audience:
- Anionic Surfactants Manufacturers
- Anionic Surfactants Dealers
- Anionic Surfactants Suppliers
- End Users, Raw Material Suppliers, and Others
Scope of the report
This report categorizes the global anionic market based on type, application, and region.
Market Segmentation, By Type:
- Linear Alkylbenzene Sulfonate
- Lignosulfonate
- Alcohol Ether Sulfates/Fatty Alcohol Sulfates
- Alkyl Sulfates/Ether Sulfates
- Sarcosinates
- Alpha Olefin Sulfonates
- Phosphate Esters
- Alkyl Naphthalene Sulfonates
- Others
- Methyl Ester Sulfonates
- Isethionates
- Taurates
- Sulfosuccinates
Market Segmentation, By Application:
- Home Care
- Personal Care
- Oil & Gas
- Construction
- Others
Market Segmentation, By Region:
- Asia Pacific
- China
- India
- Japan
- Indonesia
- Thailand
- Malaysia
- South Korea
- Australia
- Rest of Asia Pacific
- North America
- US
- Canada
- Mexico
- Europe
- Germany
- Italy
- Spain
- France
- Poland
- Russia
- UK
- Rest of Europe
- South America
- Brazil
- Argentina
- Rest of South America
- Middle East & Africa
- Saudi Arabia
- Iran
- South Africa
- Rest of Middle East & Africa
Critical questions which the report answers
- What opportunities does the market pose for bio-based surfactants
- Who are the market leaders and the strategies opted by them to maintain their market position
Available Customizations
With the given market data, MarketsandMarkets offers customizations according to the company�s specific needs. The following customization options are available for the report:
Product Analysis
- Product matrix that provides a detailed comparison of the product portfolio of each company
Regional Analysis
- Further breakdown of a region with respect to a particular country
Company Information
- Detailed analysis and profiles of additional market players (Up to five)
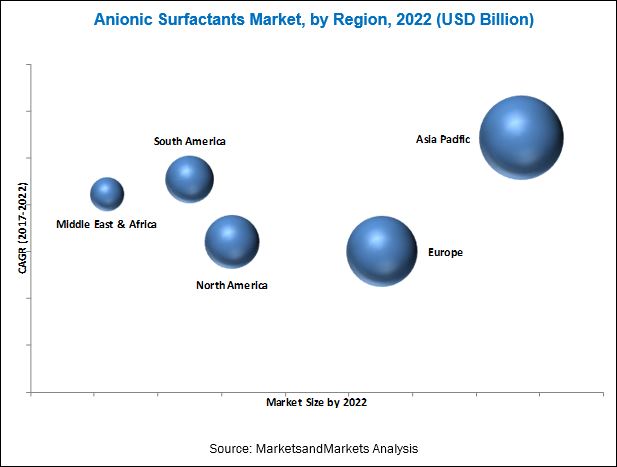
The anionic surfactants market was estimated at USD 16.36 billion and is projected to reach USD 20.10 billion by 2022, at a CAGR of 4.2% from 2017 to 2022. The market is expected to witness high growth in several growing economies of Asia Pacific and the Middle East & Africa owing to the increasing spending power, growth in the infrastructure industry, and growth in the manufacture of detergents and cosmetics. Increasing population and rising consumption of personal care products are also contributing significantly to the growth of the anionic surfactants market in Asia Pacific.
The different types of anionic surfactants are linear alkylbenzene sulfonate, lignosulfonate, alcohol ether sulfates/fatty alcohol sulfates, alkyl sulfates/ether sulfates, sarcosinates, alpha olefin sulfonates, phosphate esters, alkyl naphthalene sulfonates, and others. The anionic surfactants market is expected to grow at a steady rate during the forecast period. This is due to their wider application range, easy availability, and lower cost than other surfactants. Anionic surfactants are widely used in cleaning and related products such as detergents, soaps, cleaners, shampoos, and hand washes. These are among the largest application areas of surfactants due to which the anionic surfactants account for the majority share of the overall surfactants market.
Asia Pacific was the largest market for anionic surfactants in 2017, globally. High consumption potential, growing production capacities, competitive manufacturing costs, and high economic growth are the major driving forces for the market in the region. This dominance of Asia Pacific is mainly due to the increasing population and improving lifestyles at each financial stratum. The demand for anionic surfactants is dependent on their use in industries such as soaps & detergents and personal care products which contribute to more than 50% of its global demand. Companies are investing more on R&D to find out applications of surfactants in unconventional industry segments (petroleum industry, textile industry, paper & pulp industry, healthcare industry, and others) to increase their scope and demand. The anionic surfactants market in the Middle East & Africa is projected to register the highest growth. The factors contributing to this are the increase in the demand from the developing countries because of the increased industrialization. In the Middle East, the oil & gas industry is expected to continue to grow owing to the presence of vast reserves of crude oil and development of technologies for enhanced oil recovery. The industry will witness growth because of significant investments in re-exploring oil & gas and exploring new reserves.
Home care, personal care, and oil & gas applications to drive the growth of anionic surfactants market
Home care
Anionic surfactants are used in home care applications such as laundry detergents, dishwasher detergents, carpet cleaners, floor cleaners, and various types of fabric softeners. Anionic surfactants in detergents help remove oil, dirt, and unwanted particles from fabrics, dishes, and other surfaces. They not only remove the dirt and unwanted particles but also keep them suspended during washing, resulting in a cleaner surface. Anionic surfactants are mainly used in the soap & detergents industry due to their surface tension reduction and wettability properties.
Personal care
Anionic surfactants, when added to a liquid, reduces the surface tension. The reduction in surface tension enhances the spreading and wetting properties. Anionic surfactants are responsible for antimicrobial properties, foaming and conditioning properties (in the case of shampoos, face washes, and skin care creams), mild detergency actions, and preservative properties that are essential in the personal care industry. They also act as cleansing agents, emulsifiers, foaming agents, solubilizers, and wetting agents and hence are mainly used in make-up, skin care, hair care, oral care, and other personal care products.
Oil & Gas
The global oil & gas industry uses different specialty chemicals, including anionic surfactants, to produce oil, natural gas, and coal bed methane. The EOR technique extensively uses anionic surfactants that lead to additional oil recovery. The other applications of anionic surfactants in the oil & gas industry are well stimulation, drilling/completion, production/refining, and pipeline transport. In the oil & gas industry, anionic surfactants can be used for different purposes as emulsifiers, dispersants, corrosion inhibitors, foam controlling agents, wetting agents, suspending agents, and biocides. Major oilfield surfactants are sulfates, sulfonates, and lignosulfonates.
Critical questions the report answers:
- Where will all these developments take the industry in the mid to long term?
- What are the upcoming product type of anionic surfactants?
To speak to our analyst for a discussion on the above findings, click Speak to Analyst
The increasing awareness regarding personal health has propelled the need for personal care products. This change has led to an increased manufacturing of skin care and hair care products, thus driving the demand for anionic surfactants in the personal care market. A major change in lifestyle of consumers is witnessed in most of the developing countries, especially China and India. The development is backed by their increasing income and purchasing power. These factors have increased the demand for anionic surfactants in the personal care application in these countries.
The companies profiled in this report are AkzoNobel (Netherlands), BASF (Germany), Clariant (Switzerland), DowDuPont (US), Evonik (Germany), Croda International (US), Stepan Company (US), Huntsman (US), Kao Corporation (Japan), and Galaxy Surfactants (India), among others.
 Exclusive indicates content/data unique to MarketsandMarkets and not available with any competitors.
Table of Contents
1 Introduction (Page No. - 14)
1.1 Objectives of the Study
1.2 Market Definition
1.3 Market Scope
1.3.1 Years Considered for the Study
1.4 Currency
1.5 Unit Considered
1.6 Limitations
1.7 Stakeholders
2 Research Methodology (Page No. - 18)
2.1 Research Data
2.1.1 Secondary Data
2.1.1.1 Key Data From Secondary Sources
2.1.2 Primary Data
2.1.2.1 Key Data From Primary Sources
2.1.2.2 Key Industry Insights
2.1.2.3 Breakdown of Primary Interviews
2.2 Market Size Estimation
2.2.1 Bottom-Up Approach
2.2.2 Top-Down Approach
2.3 Data Triangulation
2.4 Assumptions
3 Executive Summary (Page No. - 26)
4 Premium Insights (Page No. - 29)
4.1 Significant Opportunities for the Anionic Surfactants Manufacturers
4.2 Anionic Surfactants Market, By Region
4.3 APAC Anionic Surfactants Market, By Application and Country
4.4 Anionic Surfactant Market, By Key Countries
4.5 Anionic Surfactants Market, By Region and Application
5 Market Overview (Page No. - 32)
5.1 Introduction
5.2 Market Dynamics
5.2.1 Drivers
5.2.1.1 Growth in End-Use Industries
5.2.1.2 Increasing Need for Greener and Sustainable Surfactants
5.2.2 Restraints
5.2.2.1 Stringent Government Regulations on Toxic Chemicals
5.2.3 Opportunities
5.2.3.1 Growing Bio-Based Surfactants Market
5.3 Porter�s Five Forces Analysis
5.3.1 Threat of New Entrants
5.3.2 Threat of Substitutes
5.3.3 Bargaining Power of Suppliers
5.3.4 Bargaining Power of Buyers
5.3.5 Intensity of Competitive Rivalry
5.4 Macroeconomic Indicators
6 Anionic Surfactants Market, By Type (Page No. - 41)
6.1 Introduction
6.2 Linear Alkylbenzene Sulfonate (LAS)
6.3 Lignosulfonates
6.4 Alcohol Ether Sulfates/Fatty Alcohol Sulfates (AES/FAS)
6.5 Alkyl Sulfates/Ether Sulfates
6.6 Sarcosinates
6.7 Alpha Olefin Sulfonates (AOS)
6.8 Phosphate Esters
6.9 Alkyl Naphthalene Sulfonates
6.10 Others
7 Anionic Surfactants Market, By Application (Page No. - 46)
7.1 Introduction
7.2 Home Care
7.3 Personal Care
7.4 Oil & Gas
7.5 Construction
7.6 Others
8 Anionic Surfactants Market, By Region (Page No. - 53)
8.1 Introduction
8.2 North America
8.2.1 By Application
8.2.2 By Country
8.2.2.1 US
8.2.2.2 Canada
8.2.2.3 Mexico
8.3 APAC
8.3.1 By Application
8.3.2 By Country
8.3.2.1 China
8.3.2.2 India
8.3.2.3 Japan
8.3.2.4 Indonesia
8.3.2.5 Thailand
8.3.2.6 Malaysia
8.3.2.7 South Korea
8.3.2.8 Australia
8.4 Europe
8.4.1 By Application
8.4.2 By Country
8.4.2.1 Germany
8.4.2.2 Italy
8.4.2.3 Spain
8.4.2.4 France
8.4.2.5 Poland
8.4.2.6 Russia
8.4.2.7 UK
8.5 Middle East & Africa
8.5.1 By Application
8.5.2 By Country
8.5.2.1 Saudi Arabia
8.5.2.2 Iran
8.5.2.3 South Africa
8.6 South America
8.6.1 By Application
8.6.2 By Country
8.6.2.1 Brazil
8.6.2.2 Argentina
9 Competitive Landscape (Page No. - 88)
9.1 Overview
9.2 Market Ranking of Key Players
9.3 Competitive Scenario
9.3.1 New Product Launch
9.3.2 Expansion
9.3.3 Contract & Agreement
9.3.4 Merger & Acquisition
10 Company Profiles (Page No. - 92)
(Business Overview, Products Offered, Recent Developments, MnM View, SWOT Analysis)*
10.1 Akzonobel N.V.
10.2 BASF SE
10.3 Clariant AG
10.4 Dowdupont
10.5 Evonik Industries AG
10.6 Croda International PLC
10.7 Stepan Company
10.8 Huntsman Corporation
10.9 Kao Corporation
10.10 Galaxy Surfactants
*Business Overview, Products Offered, Recent Developments, MnM View, SWOT Analysis Might Not Be Captured in Case of Unlisted Companies.
10.11 Other Key Market Players
10.11.1 Solvay Sa
10.11.2 Ensapol A.S.
10.11.3 Unger Fabrikker A.S.
10.11.4 Aarti Industries Limited
10.11.5 Oxiteno
10.11.6 KLK OLEO
10.11.7 Pilot Chem Corp.
10.11.8 Procter & Gamble Corporation
10.11.9 Unilever
11 Appendix (Page No. - 115)
11.1 Discussion Guide
11.2 Knowledge Store: Marketsandmarkets� Subscription Portal
11.3 Introducing RT: Real-Time Market Intelligence
11.4 Available Customizations
11.5 Related Reports
11.6 Author Details
List of Tables (90 Tables)
Table 1 Global Textile Industry, By Country, 2015 and 2025 (USD Billion)
Table 2 Crude Oil Production Statistics, Top 15 Countries, 2015�2022 (Million Tonnes)
Table 3 Natural Gas Production Statistics, Top 15 Countries, 2015�2022 (Billion Cubic Meters)
Table 4 Trends and Forecast of Construction Industry, By Country, 2015�2022 (USD Billion)
Table 5 Anionic Surfactants Market Size, By Type, 2015�2022 (Kiloton)
Table 6 Anionic Surfactant Market Size, By Type, 2015�2022 (USD Million)
Table 7 Anionic Surfactants Market Size, By Application, 2015�2022 (Kiloton)
Table 8 Anionic Surfactant Market Size, By Application, 2015�2022 (USD Million)
Table 9 Anionic Surfactants Market Size in Home Care Application, By Region, 2015�2022 (Kiloton)
Table 10 Anionic Surfactant Market Size in Home Care Application, By Region, 2015�2022 (USD Million)
Table 11 Anionic Surfactants Market Size in Personal Care Application, By Region, 2015�2022 (Kiloton)
Table 12 Anionic Surfactant Market Size in Personal Care Application, By Region, 2015�2022 (USD Million)
Table 13 Anionic Surfactants Market Size in Oil & Gas Application, By Region, 2015�2022 (Kiloton)
Table 14 Anionic Surfactant Market Size in Oil & Gas Application, By Region, 2015�2022 (USD Million)
Table 15 Anionic Surfactants Market Size in Construction Application, By Region, 2015�2022 (Kiloton)
Table 16 Anionic Surfactant Market Size in Construction Application, By Region, 2015�2022 (USD Million)
Table 17 Anionic Surfactants Market Size in Other Applications, By Region, 2015�2022 (Kiloton)
Table 18 Anionic Surfactant Market Size in Other Applications, By Region, 2015�2022 (USD Million)
Table 19 Anionic Surfactants Market Size, By Region, 2015�2022 (Kiloton)
Table 20 Anionic Surfactant Market Size, By Region, 2015�2022 (USD Million)
Table 21 North America: Anionic Surfactants Market Size, By Application, 2015�2022 (Kiloton)
Table 22 North America: Anionic Surfactant Market Size, By Application, 2015�2022 (USD Million)
Table 23 North America: Market Size, By Country, 2015�2022 (Kiloton)
Table 24 North America: Market Size, By Country, 2015�2022 (USD Million)
Table 25 US: Anionic Surfactants Market Size, By Application, 2015�2022 (Kiloton)
Table 26 US: By Market Size, By Application, 2015�2022 (USD Million)
Table 27 Canada: Anionic Surfactants Market Size, By Application, 2015�2022 (Kiloton)
Table 28 Canada: Anionic Surfactant Market Size, By Application, 2015�2022 (USD Million)
Table 29 Mexico: Anionic Surfactants Market Size, By Application, 2015�2022 (Kiloton)
Table 30 Mexico: Anionic Surfactant Market Size, By Application, 2015�2022 (USD Million)
Table 31 APAC: Anionic Surfactants Market Size, By Application, 2015�2022 (Kiloton)
Table 32 APAC: Anionic Surfactant Market Size, By Application, 2015�2022 (USD Million)
Table 33 APAC: Market Size, By Country, 2015�2022 (Kiloton)
Table 34 APAC: Market Size, By Country, 2015�2022 (USD Million)
Table 35 China: Anionic Surfactants Market Size, By Application, 2015�2022 (Kiloton)
Table 36 China: By Market Size, By Application, 2015�2022 (USD Million)
Table 37 India: Anionic Surfactants Market Size, By Application, 2015�2022 (Kiloton)
Table 38 India: Anionic Surfactant Market Size, By Application, 2015�2022 (USD Million)
Table 39 Japan: Anionic Surfactants Market Size, By Application, 2015�2022 (Kiloton)
Table 40 Japan: Anionic Surfactant Market Size, By Application, 2015�2022 (USD Million)
Table 41 Indonesia: Anionic Surfactants Market Size, By Application, 2015�2022 (Kiloton)
Table 42 Indonesia: By Market Size, By Application, 2015�2022 (USD Million)
Table 43 Thailand: By Market Size, By Application, 2015�2022 (Kiloton)
Table 44 Thailand: Anionic Surfactants Market Size, By Application, 2015�2022 (USD Million)
Table 45 Malaysia: Anionic Surfactants Market Size, By Application, 2015�2022 (Kiloton)
Table 46 Malaysia: Anionic Surfactant Market Size, By Application, 2015�2022 (USD Million)
Table 47 South Korea: By Market Size, By Application, 2015�2022 (Kiloton)
Table 48 South Korea: By Market Size, By Application, 2015�2022 (USD Million)
Table 49 Australia: By Market Size, By Application, 2015�2022 (Kiloton)
Table 50 Australia: By Market Size, By Application, 2015�2022 (USD Million)
Table 51 Europe: By Market Size, By Application, 2015�2022 (Kiloton)
Table 52 Europe: Anionic Surfactants Market Size, By Application, 2015�2022 (USD Million)
Table 53 Europe: Anionic Surfactant Market Size, By Country, 2015�2022 (Kiloton)
Table 54 Europe: Market Size, By Country, 2015�2022 (USD Million)
Table 55 Germany: By Market Size, By Application, 2015�2022 (Kiloton)
Table 56 Germany: By Market Size, By Application, 2015�2022 (USD Million)
Table 57 Italy: Anionic Surfactants Market Size, By Application, 2015�2022 (Kiloton)
Table 58 Italy: By Market Size, By Application, 2015�2022 (USD Million)
Table 59 Spain: By Market Size, By Application, 2015�2022 (Kiloton)
Table 60 Spain: Anionic Surfactants Market Size, By Application, 2015�2022 (USD Million)
Table 61 France: Anionic Surfactants Market Size, By Application, 2015�2022 (Kiloton)
Table 62 France: Anionic Surfactant Market Size, By Application, 2015�2022 (USD Million)
Table 63 Poland: Anionic Surfactants Market Size, By Application, 2015�2022 (Kiloton)
Table 64 Poland: Anionic Surfactant Market Size, By Application, 2015�2022 (USD Million)
Table 65 Russia: Anionic Surfactants Market Size, By Application, 2015�2022 (Kiloton)
Table 66 Russia: Anionic Surfactant Market Size, By Application, 2015�2022 (USD Million)
Table 67 UK: Anionic Surfactants Market Size, By Application, 2015�2022 (Kiloton)
Table 68 UK: By Market Size, By Application, 2015�2022 (USD Million)
Table 69 Middle East & Africa: Anionic Surfactants Market Size, By Application, 2015�2022 (Kiloton)
Table 70 Middle East & Africa: By Market Size, By Application, 2015�2022 (USD Million)
Table 71 Middle East & Africa: By Market Size, By Country, 2015�2022 (Kiloton)
Table 72 Middle East & Africa: By Market Size, By Country, 2015�2022 (USD Million)
Table 73 Saudi Arabia: By Market Size, By Application, 2015�2022 (Kiloton)
Table 74 Saudi Arabia: By Market Size, By Application, 2015�2022 (USD Million)
Table 75 Iran: By Market Size, By Application, 2015�2022 (Kiloton)
Table 76 Iran: By Market Size, By Application, 2015�2022 (USD Million)
Table 77 South Africa: By Market Size, By Application, 2015�2022 (Kiloton)
Table 78 South Africa: By Market Size, By Application, 2015�2022 (USD Million)
Table 79 South America: By Market Size, By Application, 2015�2022 (Kiloton)
Table 80 South America: By Market Size, By Application, 2015�2022 (USD Million)
Table 81 South America: By Market Size, By Country, 2015�2022 (Kiloton)
Table 82 South America: By Market, By Country, 2015�2022 (USD Million)
Table 83 Brazil: By Market Size, By Application, 2015�2022 (Kiloton)
Table 84 Brazil: By Market Size, By Application, 2015�2022 (USD Million)
Table 85 Argentina: By Market Size, By Application, 2015�2022 (Kiloton)
Table 86 Argentina: By Market Size, By Application, 2015�2022 (USD Million)
Table 87 New Product Launch, 2014�2017
Table 88 Expansion, 2014�2017
Table 89 Contract & Agreement, 2014�2017
Table 90 Merger & Acquisition, 2014�2017
List of Figures (28 Figures)
Figure 1 Anionic Surfactants Market Segmentation
Figure 2 Regional Market Segmentation, By Country
Figure 3 Anionic Surfactant Market: Research Design
Figure 4 Market Size Estimation: Bottom-Up Approach
Figure 5 Market Size Estimation: Top-Down Approach
Figure 6 Anionic Surfactants Market: Data Triangulation
Figure 7 Lignosulfonates Segment to Register the Highest CAGR
Figure 8 Construction Segment to Register the Highest CAGR
Figure 9 APAC to Lead the Anionic Surfactants Market
Figure 10 Growing Applications to Offer Opportunities for the Market Players
Figure 11 APAC to Be the Fastest-Growing Market
Figure 12 Home Care Segment Accounts for the Maximum Market Share in APAC
Figure 13 China to Be the Fastest-Growing Anionic Surfactants Market
Figure 14 Home Care Segment Leads the Anionic Surfactant Market in 2017
Figure 15 Overview of Factors Governing the Anionic Surfactants Market
Figure 16 Anionic Surfactants Market: Porter�s Five Forces Analysis
Figure 17 North America: Anionic Surfactants Market Snapshot
Figure 18 APAC: Anionic Surfactants Market Snapshot
Figure 19 Companies Adopted Both Organic and Inorganic Growth Strategies Between 2014 and 2017
Figure 20 Akzonobel N.V.: Company Snapshot
Figure 21 Base SE: Company Snapshot
Figure 22 Clariant AG: Company Snapshot
Figure 23 Dowdupont: Company Snapshot
Figure 24 Evonik Industries AG: Company Snapshot
Figure 25 Croda International PLC: Company Snapshot
Figure 26 Stepan Company: Company Snapshot
Figure 27 Huntsman Corporation: Company Snapshot
Figure 28 Kao Corporation: Company Snapshot


Growth opportunities and latent adjacency in Anionic Surfactants Market