Antifreeze Market By Product (Ethylene & Propylene Glycol, Glycerin), Additive Technology OE & Aftermarket (IAT, OAT, & HOAT), Vehicle Type (Passenger Car, Light & Heavy Commercial Vehicle, Construction Equipment) & Region - Global Forecast to 2021


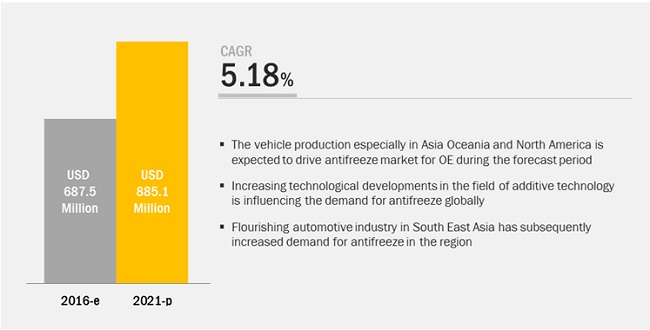
[167 Pages Report] The global antifreeze market for the automotive industry size was valued at USD 688 million in 2016, and is expected to grow at a CAGR of 5.18% during the forecast period. Increasing vehicle production, especially SUV & light truck segment and recent growing trend in trucks & buses segment in countries such as India are the key reasons driving the demand for OE market for antifreeze. Growing vehicles in operation and increased miles travelled per year is estimated to drive the demand for antifreeze in aftermarket segment.
Passenger cars are expected to witness the highest demand for antifreeze
According to OICA, the production of passenger cars around the globe has grown from 68.6 million units in 2015 to 72.1 million units in 2015 at a rate of 5.1%. The increased sales of passenger cars is due to the improved standard of living and per capita income in various countries. According to Trading Economics statistics, the U.S. GDP per capita increased from USD 50,727.8 in 2014 to USD 51,638.1 in 2015, which led to increased purchasing capabilities of consumers. Thus, the sales and production of passenger cars is increasing and leading to increased demand for engine coolant and antifreeze.
Glycerine is expected to be the fastest growing market for antifreeze, by product, in the automotive industry
Antifreeze base fluids are toxic in nature. This has compelled the manufacturers to switch to less toxic alternatives. Also, glycols used for antifreeze are manufactured from crude oil filtration, which may lead to a higher demand for fossil fuels such as crude oil and can have a negative impact on the environment. Hence, bio-based options such as glycerin are getting recognized in the market for their environment-friendly nature. These bio-based antifreezes are manufactured from materials such as corn, stover, and other oil bearing resources. Manufacturers are venturing into this market with products such as the Susterra brand of DuPont Tate & Lyle Bio Products (U.S.), which is produced using a bio-based glycol named 1, 3-Propanediol (PDO). This glycol is completely manufactured using renewable and bio-based materials and is suitable for passenger cars and other light and heavy-duty vehicles.
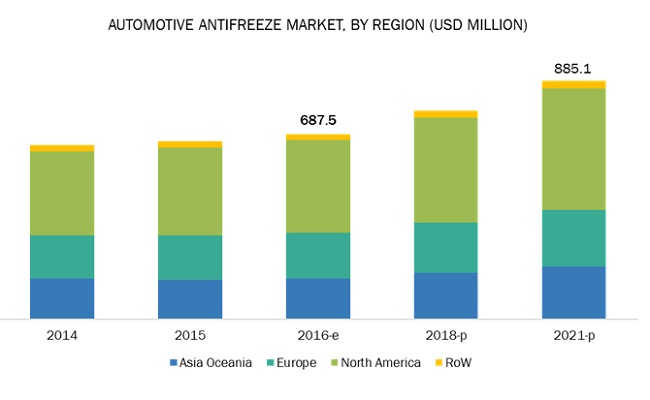
North America: Largest and fastest growing antifreeze market for the automotive industry in Original Equipment (OE) segment
The North American region leads the antifreeze market for the automotive industry, owing to the higher production and demand for large engine capacity vehicles in this region such as extended cabs. The automotive market in this region is inclined towards SUVs and light trucks, owing to their off-road capabilities and better traction in changing weather conditions. According to OICA, the light commercial vehicle production in North America increased from 10.4 million units in 2015 to 11.0 million units by 2016 at a rate of 5.7%, which is above the global growth rate of 2.7%. Also, LCVs in North America have a higher antifreeze requirement, as compared to other regions. These factors have contributed to the higher market size of automotive antifreeze in this region. Additionally, the automotive industry of North America is one of the most advanced across the globe with substantial investments in R&D activities, infrastructure, and new production facilities driving the overall automotive market.
Market Dynamics
Drivers
Increasing vehicle production and parc fueling the OE and aftermarket for antifreeze and engine coolant
The growth of automotive engine coolant market is directly linked with rising vehicle production, as coolant is essential for cooling the engine. Thus, rising vehicle production is considered as one of the most important drivers for the engine coolant in the OE market
Increasing sales of construction equipment driving the demand for engine coolant and antifreeze
Construction industry is booming owing to housing demand, construction projects, commercialization, and increased construction budgets in developing countries. Such booming construction industry needs construction equipment which leads to the increased demand of engine coolant.
Restraints
Growing demand of battery operated electric vehicles
Growing environmental concerns have given rise to the need of developing alternate technologies in the automobile industry. One such step is the development of the battery electric vehicles (BEVs). These vehicles operate on batteries and various control units which not only improve performance but also nullify emissions. Battery powered electric vehicles eliminate the application of an internal combustion engine, thus further eliminating the use of coolants.
Opportunities
Environment friendly and bio based coolants and antifreeze
The commonly used base fluid in coolants is ethylene glycol. It is a by-product of crude oil and widely accepted, given its low manufacturing and refining costs. Ethylene glycol is toxic in nature and has a sweet taste which attracts animals. This has resulted in several cases of animal poisoning. Reasons such as these have compelled the manufacturers to explore other bio based coolants that can be used as an alternative for ethylene glycol and would also contribute to environment protection.
Challenges
Engine downsizing leading to decreased demand for engine coolant and antifreeze
With the rising demand for improved fuel economy and stringent emission regulations, the demand for downsized engine is increasing. With the engine downsizing and need for higher power, the heat generated in the system has increased. Removing excess heat with the help of engine coolant and antifreeze has become a challenge for the Tier-2, Tier-1, and OEMs.
Recycling of engine coolant and antifreeze
Recycling of used antifreeze solution is considered as a viable alternative compared to disposal. The used antifreeze is hazardous to the environment and human health owing to the toxicity of ethylene glycol present as base fluid. Waste antifreeze contains high amount of heavy metals such as cadmium, lead, chromium and others which is harmful for the environment. Thus, recycling of antifreeze and coolant stands as a challenge in front of suppliers and OEMs.
Fluctuating raw material price influencing the engine coolant and antifreeze market
One of the main constituents of an engine coolant includes base fluids such as ethylene glycol, propylene glycol, and glycerin among others. These base fluids are the by-products of crude oil. A fluctuation is being observed in the prices of crude oil, which has posed a direct impact on the prices of these base fluids. This directly affects the market for coolants at a global level.
Scope of the Report
|
Report Metric |
Details |
|
Market Size Available for Years |
2014–2021 |
|
Base Year Considered |
2015 |
|
Forecast Period |
2016–2021 |
|
Forecast Units |
Value (USD million/billion) and Volume (Million Gallons) |
|
Segments Covered |
Automotive antifreeze OE market by product, automotive antifreeze market by additive technology, engine coolant aftermarket by technology, by vehicle type, construction equipment engine coolant market by application, automotive market by vehicle type, by region |
|
Geographies Covered |
Asia Oceania, Europe, North America, and RoW |
|
Companies Covered |
BP PLC (U.K.), Royal Dutch Shell PLC (Netherlands), Total (France), and Chevron Corporation (U.S.). |
This research report categorizes the automotive antifreeze market by product, by region, and engine coolant aftermarket by additive technology, by Region, construction equipment engine coolant market by application, market by vehicle type, and by region.
Global Antifreeze Market Segmentation
Antifreeze OE Market, By Product
- Ethylene Glycol
- Propylene Glycol
- Glycerin
Antifreeze Market, By Additive Technology
- IAT
- HOAT
- OAT
Engine Coolant Aftermarket, By Technology
- IAT
- HOAT
- OAT
Engine Coolant Aftermarket, By Vehicle Type
- Passenger Car
- Commercial Vehicle
Construction Equipment Engine Coolant Market Market, By Application
- Articulated Dump Truck
- Backhoe Loader
- Crawler Dozer
- Asphalt Paver
- Motor Grader
- Motor Scraper
- Crawler Loader
- Mini Excavator
- Skid-Steer Loader
- Wheeled Excavator
- Wheeled Loader < 80HP
- Wheeled Loader > 80HP
Automotive Antifreeze Market, By Vehicle Type
- Passenger Car
- Commercial Vehicle
Automotive Antifreeze Market, By Region
- Asia Oceania
- North America
- Europe
- Rest of the World
Key Market Players
The ecosystem of the antifreeze market for automotive industry consists of antifreeze manufacturers such as BP PLC (U.K.), Royal Dutch Shell PLC (Netherlands), Total (France), and Chevron Corporation (U.S.). Antifreeze is supplied to major OEMs in the automotive industry including Nissan (Japan), Ford Motor Company (U.S.), Honda (Japan), and others.
Companies have adopted the strategies of expansion, new product development, partnership, and merger & acquisition to retain its leading position in the brake friction market. Strengthening the product portfolio and global presence by building customer relationships, they have left a mark not only in the current market but also in emerging markets.
Key Questions addressed by the report
- Which antifreeze product is expected to dominate the market in the future?
- How are the players addressing the challenge of different new technologies in the automotive market?
- What are the countries having major demand of automotive antifreeze?
Available Customizations
-
HCV Antifreeze OE Market, By Country and Vehicle Type
- Truck
- Bus
-
Commercial Vehicle Engine Coolant Aftermarket, By Region and Vehicle Type
- LCV
- HCV
-
Off-Highway Engine Coolant Market, By Application & Region
- Agricultural tractors
-
Engine Coolant Additive Market, By Technology & Country
- IAT
- OAT
- HOAT
-
Antifreeze Market, By Product & Country
- Ethylene Glycol
- Propylene Glycol
- Glycerin
To speak to our analyst for a discussion on the above findings, click Speak to Analyst
 Exclusive indicates content/data unique to MarketsandMarkets and not available with any competitors.
Table of Contents
1 Introduction (Page No. - 19)
1.1 Objectives of the Study
1.2 Market Definition
1.2.1 Automotive Engine Coolant & Antifreeze
1.2.2 Comparison: Automotive Engine Coolant Additive Technology
1.3 Market Scope
1.3.1 Markets Covered
1.3.2 Years Considered in the Study
1.4 Currency
1.5 Package Size
1.6 Limitations
1.7 Stakeholders
2 Research Methodology (Page No. - 23)
2.1 Research Data
2.2 Secondary Data
2.3 Primary Data
2.3.1 Sampling Techniques & Data Collection Methods
2.3.2 Primary Participants
2.4 Factor Analysis
2.4.1 Introduction
2.4.2 Demand-Side Analysis
2.4.2.1 Impact of Per Capita Income on Antifreeze and Engine Coolant Market
2.4.2.2 Infrastructure: Roadways
2.4.3 Supply-Side Analysis
2.4.3.1 Technological Advancements in Antifreeze
2.5 Market Estimation
2.5.1 Bottom-Up Approach
2.5.2 Top-Down Approach
2.6 Market Breakdown & Data Triangulation
2.7 Assumptions
3 Executive Summary (Page No. - 35)
3.1 Introduction
3.1.1 Antifreeze OE Market, By Region
3.1.2 Antifreeze OE Market , By Vehicle Type
3.1.3 Antifreeze OE Market, By Product
3.1.4 Antifreeze OE Market — Country-Wise Growth Trends
3.1.5 Antifreeze Additive OE Market, By Technology, 2016 vs 2021
3.1.6 Engine Coolant Aftermarket, By Additive Technology & Vehicle Type, 2016 vs 2021
3.1.7 Construction Equipment Engine Coolant Market, By Application & Region, 2016 vs 2021
4 Premium Insights (Page No. - 43)
4.1 Attractive Opportunities in Automotive Antifreeze OE Market
4.2 Antifreeze OE Market, By Region, 2016 vs 2021 (USD Million)
4.3 Antifreeze OE Market, By Vehicle Type, 2016 vs 2021
4.4 Antifreeze OE Market, By Product, 2016 vs 2021
4.5 Antifreeze Additive Technology OE Market, By Volume, 2016 vs 2021
4.6 Engine Coolant Aftermarket, By Additive Technology & Vehicle Type, 2016
4.7 Construction Equipment Engine Coolant Market, By Region, 2016 vs 2021
5 Market Overview (Page No. - 48)
5.1 Introduction
5.2 Market Dynamics
5.2.1 Drivers
5.2.1.1 Increasing Vehicle Production and Parc Fueling the OE and Aftermarket for Antifreeze and Engine Coolant
5.2.1.2 Increasing Sales of Construction Equipment Driving the Demand for Engine Coolant and Antifreeze
5.2.2 Restraints
5.2.2.1 Growing Demand of Battery Operated Electric Vehicles
5.2.3 Opportunities
5.2.3.1 Environment Friendly and Bio Based Coolants and Antifreeze
5.2.4 Challenges
5.2.4.1 Engine Downsizing Leading to Decreased Demand for Engine Coolant and Antifreeze
5.2.4.2 Recycling of Engine Coolant and Antifreeze
5.2.4.3 Fluctuating Raw Material Price Influencing the Engine Coolant and Antifreeze Market
5.3 Revenue Missed: Opportunities for Antifreeze Manufacturers
5.4 Antifreeze Market - Scenarios
5.4.1 Pessimistic
5.4.2 Most Likely
5.4.3 Optimistic
5.5 Average Selling Price (ASP) Analysis
5.6 Burning Issue
5.6.1 Disposal of Engine Coolant
5.7 Porter’s Five Forces Analysis
5.7.1 Competitive Rivalry
5.7.2 Competitive Threat of New Entrants
5.7.3 Threat of Substitutes
5.7.4 Bargaining Power of Suppliers
5.7.5 Bargaining Power of Buyers
6 Automotive Antifreeze OE Market, By Product (Page No. - 66)
6.1 Introduction
6.1.1 Research Methodology
6.1.2 Assumptions
6.1.3 Industry Insights
6.2 Automotive Antifreeze Market, By Product
6.2.1 Ethylene Glycol Market for Automotive Antifreeze, By Region
6.2.2 Propylene Glycol Market for Automotive Antifreeze, By Region
6.2.3 Glycerin Market for Automotive Antifreeze, By Region
7 Automotive Antifreeze Market, By Additive Technology (Page No. - 73)
7.1 Introduction
7.1.1 Research Methodology
7.1.2 Assumptions
7.1.3 Industry Insights
7.2 Automotive Antifreeze Market, By Additive Technology
7.2.1 IAT Market for Automotive Antifreeze
7.2.2 HOAT Market for Automotive Antifreeze
7.2.3 OAT Market for Automotive Antifreeze
8 Engine Coolant Aftermarket, By Technology (Page No. - 77)
8.1 Introduction
8.1.1 Research Methodology
8.1.2 Assumptions
8.1.3 Industry Insights
8.2 Engine Coolant Aftermarket, By Additive Technology
8.2.1 IAT Market for Engine Coolant
8.2.2 HOAT Market for Engine Coolant
8.2.3 OAT Market for Engine Coolant
9 Engine Coolant Aftermarket, By Vehicle Type (Page No. - 77)
9.1 Introduction
9.1.1 Research Methodology
9.1.2 Assumptions
9.1.3 Industry Insights
9.2 Engine Coolant Aftermarket, By Vehicle Type
9.2.1 Passenger Car: Engine Coolant Aftermarket
9.2.2 Commercial Vehicle: Engine Coolant Aftermarket
10 Construction Equipment Engine Coolant Market, Application (Page No. - 87)
10.1 Introduction
10.1.1 Research Methodology
10.1.2 Assumptions
10.1.3 Industry Insights
10.2 Construction Equipment Engine Coolant Market, By Application
10.2.1 Articulated Dump Truck
10.2.2 Backhoe Loaders
10.2.3 Crawler Dozer
10.2.4 Asphalt Paver
10.2.5 Motor Grader
10.2.6 Motor Scraper
10.2.7 Crawler Loader
10.2.8 Mini Excavators
10.2.9 Skid- Steer Loaders
10.2.10 Wheeled Excavators
10.2.11 Wheeled Loaders <80hp
10.2.12 Wheeled Loaders >80hp
11 Automotive Antifreeze Market, By Vehicle Type (Page No. - 110)
11.1 Introduction
11.1.1 Research Methodology
11.1.2 Assumptions
11.1.3 Industry Insights
11.2 Passenger Car
11.3 Commercial Vehicle
12 Automotive Antifreeze Market, By Region (Page No. - 100)
12.1 Introduction
12.1.1 Research Methodology
12.1.2 Assumptions
12.1.3 Industry Insights
12.2 Automotive Antifreeze OE Market, By Region
12.3 Asia Oceania
12.3.1 Automotive Antifreeze OE Market, By Product
12.3.2 Market, By Additive Technology
12.3.3 Engine Coolant Aftermarket, By Technology
12.3.4 Construction Equipment Engine Coolant Market, By Application
12.3.5 Market, By Region
12.3.6 China
12.3.6.1 China Vehicle Production, By Vehicle Type (2012-2015)
12.3.7 India
12.3.7.1 India Vehicle Production, By Vehicle Type (2012-2015)
12.3.8 Japan
12.3.8.1 Japan Vehicle Production, By Vehicle Type (2012-2015)
12.3.9 South Korea
12.3.9.1 South Korea Vehicle Production, By Vehicle Type (2012-2015)
12.3.10 Thailand
12.3.10.1 Thailand Vehicle Production, By Vehicle Type (2012-2015)
12.3.12 Rest of Asia Ocenia
12.3.12.1 Rest of Asia Ocenia Vehicle Production, By Vehicle Type (2012-2015)
12.4 North America
12.4.1 Automotive Antifreeze OE Market, By Product
12.4.2 Market, By Additive Technology
12.4.3 Engine Coolant Aftermarket, By Technology
12.4.4 Construction Equipment Engine Coolant Market, By Application
12.4.5 Market, By Region
12.2.6 US
12.2.6.1 US Vehicle Production, By Vehicle Type (2012-2015)
12.2.7 Mexico
12.2.7.1 Mexico Vehicle Production, By Vehicle Type (2012-2015)
12.2.8 Canada
12.2.8.1 Canada Vehicle Production, By Vehicle Type (2012-2015)
12.5 Europe
12.5.1 Automotive Antifreeze OE Market, By Product
12.5.2 Market, By Additive Technology
12.5.3 Engine Coolant Aftermarket, By Technology
12.5.4 Construction Equipment Engine Coolant Market, By Application
12.5.5 Market, By Region
12.5.6 France
12.5.6.1 France Vehicle Production, By Vehicle Type (2012-2015)
12.5.7 Italy
12.5.7.1 Spain Vehicle Production, By Vehicle Type (2012-2015)
12.5.8 Spain
12.5.8.1 France Vehicle Production, By Vehicle Type (2012-2015)
12.5.9 Germany
12.5.9.1 Germany Vehicle Production, By Vehicle Type (2012-2015)
12.5.10 UK
12.5.10.1 UK Vehicle Production, By Vehicle Type (2012-2015)
12.5.12 Rest of Europe
12.5.12.1 Rest of Europe Vehicle Production, By Vehicle Type (2012-2015)
12.6 Rest of the World
12.6.1 Automotive Antifreeze OE Market, By Product
12.6.2 Market, By Additive Technology
12.6.3 Engine Coolant Aftermarket, By Technology
12.6.4 Construction Equipment Engine Coolant Market, By Application
12.6.5 Market, By Region
12.6.6 Brazil
12.6.6.1 Brazil Vehicle Production, By Vehicle Type (2012-2015)
12.6.7 Russia
12.6.7.1 Russia Vehicle Production, By Vehicle Type (2012-2015)
12.6.8 South Africa
12.6.8.1 South Africa Vehicle Production, By Vehicle Type (2012-2015)
12.6.9 RoW Others
12.6.9.1 RoW Others Vehicle Production, By Vehicle Type (2012-2015)
13 Competitive Landscape (Page No. - 131)
13.1 Introduction
13.2 Segmental Revenue of Top 5 Suppliers of Automotive Antifreeze & Engine Coolant
13.3 Competitive Situation & Trends
13.3.1 Market Evolution Framework - Significant Supply
13.4 New Product Development
13.5 Supply Contracts/Partnerships/Agreements
13.6 Expansions
14 Company Profiles (Page No. - 148)
(Business Overview, Key Insights, Recent Developments, MnM View)*
14.1 Introduction
14.2 BP P.L.C.
14.2.1 Business Overview
14.2.2 Product Portfolio
14.2.3 Recent Developments
14.2.4 SWOT Analysis
14.2.5 MnM View
14.3 Royal Dutch Shell PLC
14.3.1 Business Overview
14.3.2 Product Portfolio
14.3.3 Recent Developments
14.3.4 SWOT Analysis
14.3.5 MnM View
14.4 Total
14.4.1 Business Overview
14.4.2 Product Portfolio
14.4.3 Recent Developments
14.4.4 SWOT Analysis
14.4.5 MnM View
14.5 Chevron Corporation
14.5.1 Business Overview
14.5.2 Product Portfolio
14.5.3 Recent Developments
14.5.4 SWOT Analysis
14.5.5 MnM View
14.6 Exxon Mobil Corporation
14.6.1 Business Overview
14.6.2 Product Portfolio
14.6.3 Recent Developments
14.6.4 SWOT Analysis
14.5.5 MnM View
14.7 China Petrochemical Corporation
14.7.1 Business Overview
14.7.2 Product Portfolio
14.7.3 Recent Developments
14.8 BASF SE
14.8.1 Business Overview
14.8.2 Product Portfolio
14.8.3 Recent Developments
14.9 Cummins Inc.
14.9.1 Business Overview
14.9.2 Product Portfolio
14.9.3 Recent Developments
14.10 Motul
14.10.1 Business Overview
14.10.2 Product Portfolio
14.10.3 Recent Developments
14.11 Prestone Products Corporation
14.11.1 Business Overview
14.11.2 Product Portfolio
14.11.3 Recent Developments
14.12 Additional Companies
14.12.1 CCI Corporation
14.12.2 Sonax GmbH
14.12.3 Kost USA, Inc
14.12.4 Recochem Inc
14.12.5 Halfords Group PLC
14.12.6 Rock Oil Company PLC
14.12.7 Valvoline
*Details on Business Overview, Products Offered & Services Strategies, Key Insights, Recent Developments, MnM View Might Not Be Captured in Case of Unlisted Companies.
15 Key Innovators (Page No. - 155)
15.1 Introduction
15.2 Dupont Tate & Lyle Bio Products
15.2.1 Company Overview
15.2.2 Key Innovation
15.2.3 Impact of Innovation on Antifreeze and Engine Coolant Market
15.3 Recochem Inc.
15.3.1 Company Overview
15.3.2 Key Innovation
15.3.3 Impact of Innovation on Antifreeze and Engine Coolant Market
15.4 Evans Cooling Systems, Inc.
15.4.1 Company Overview
15.4.2 Key Innovation
15.4.3 Impact of Innovation on Antifreeze and Engine Coolant Market
16 Appendix (Page No. - 168)
16.1 Insights of Industry Experts
16.2 Discussion Guide
16.3 Available Customizations
16.3.1 HCV Antifreeze OE Market, By Country & Vehicle Type
16.3.1.1 Truck
16.3.1.2 Bus
16.3.2 Commercial Vehicle Engine Coolant Aftermarket, By Region & Vehicle Type
16.3.2.1 LCV
16.3.2.2 HCV
16.3.3 Off-Highway Engine Coolant Market, By Application & Region
16.3.3.1 Agricultural Tractors
16.3.4 Engine Coolant Additive Market, By Technology & Country
16.3.4.1 IAT
16.3.4.2 OAT
16.3.4.3 HOAT
16.3.5 Automotive Antifreeze Market, By Product & Country
16.3.5.1 Ethylene Glycol
16.3.5.2 Propylene Glycol
16.3.5.3 Glycerin
16.4 Knowledge Store: Marketsandmarkets’ Subscription Portal
16.5 Related Reports
16.6 Author Details
List of Tables (165 Tables)
Table 1 Average American Dollar Exchange Rates
Table 2 Nano Coolants With Improved Thermal Performance for Downsized Engines
Table 3 Comparative Analysis of Engine Coolant Recycling Methods
Table 4 Porter’s Five Forces Analysis
Table 5 Automotive Antifreeze Market, By Product, 2014–2021 (Million Gallons)
Table 6 Market, By Product, 2014–2021 (USD Million)
Table 7 Ethylene Glycol Market for Automotive Antifreeze, By Region, 2014–2021 (Million Gallons)
Table 8 Ethylene Glycol Market in Automotive Antifreeze, By Region, 2014–2021 (USD Million)
Table 9 Propylene Glycol Market for Automotive Antifreeze, By Region, 2014–2021 (Million Gallons)
Table 10 Propylene Glycol Market for Automotive Antifreeze, By Region, 2014–2021 (USD Million)
Table 11 Glycerin Market for Automotive Antifreeze, By Region, 2014–2021 (Million Gallons)
Table 12 Glycerin Market for Automotive Antifreeze, By Region, 2014–2021 (USD Million)
Table 13 Market, By Additive Technology, 2014–2021 (Thousand Gallons)
Table 14 Automotive Antifreeze IAT Market, By Region, 2014–2021 (Thousand Gallons)
Table 15 Automotive Antifreeze HOAT Market, By Region, 2014–2021 (Thousand Gallons)
Table 16 Automotive Antifreeze OAT Market, By Region, 2014–2021 (Thousand Gallons)
Table 17 Engine Coolant Aftermarket, By Additive Technology, 2014–2021 (Million Gallons)
Table 18 Engine Coolant Aftermarket, By Additive Technology, 2014–2021 (USD Million)
Table 19 IAT Market for Automotive Antifreeze, 2014–2021 (Million Gallons)
Table 20 IAT Market for Automotive Antifreeze, 2014–2021 (USD Million)
Table 21 HOAT Market for Automotive Antifreeze, 2014–2021 (Million Gallons)
Table 22 HOAT Market for Automotive Antifreeze, 2014–2021 (USD Million)
Table 23 OAT Market for Automotive Antifreeze, 2014–2021 (Million Gallons)
Table 24 OAT Market for Automotive Antifreeze, 2014–2021 (USD Million)
Table 25 Engine Coolant Aftermarket, By Vehicle Type, 2014–2021 (Million Gallons)
Table 26 Engine Coolant Aftermarket, By Vehicle Type, 2014–2021 (USD Million)
Table 27 Passenger Car Engine Coolant Aftermarket, 2014–2021 (Million Gallons)
Table 28 Passenger Car Engine Coolant Aftermarket, 2014–2021 (USD Million)
Table 29 Commercial Vehicle Engine Coolant Aftermarket, 2014–2021 (Million Gallons)
Table 30 Commercial Vehicle Engine Coolant Aftermarket, 2014–2021 (USD Million)
Table 31 Asia-Oceania: Engine Coolant Aftermarket, By Additive Technology & Vehicle Type, 2014–2021 (Million Gallons)
Table 32 Asia-Oceania: Engine Coolant Aftermarket, By Additive Technology & Vehicle Type, 2014–2021 (USD Million)
Table 33 Europe: Engine Coolant Aftermarket, By Additive Technology & Vehicle Type, 2014–2021 (Million Gallons)
Table 34 Europe: Engine Coolant Aftermarket, By Additive Technology & Vehicle Type, 2014–2021 (USD Million)
Table 35 North America: Engine Coolant Aftermarket, By Additive Technology & Vehicle Type, 2014–2021 (Million Gallons)
Table 36 North America: Engine Coolant Aftermarket, By Additive Technology & Vehicle Type, 2014–2021 (USD Million)
Table 37 RoW: Engine Coolant Aftermarket, By Additive Technology & Vehicle Type, 2014–2021 (Million Gallons)
Table 38 RoW: Engine Coolant Aftermarket, By Additive Technology & Vehicle Type, 2014–2021 (USD Million)
Table 39 Construction Equipment Engine Coolant Market, By Application, 2014–2021 (Thousand Gallons)
Table 40 Construction Equipment Engine Coolant Market, By Application, 2014–2021 (USD Million)
Table 41 Articulated Dump Truck Engine Coolant Market, 2014–2021 (Thousand Gallons)
Table 42 Articulated Dump Truck Engine Coolant Market, 2014–2021 (USD Million)
Table 43 Backhoe Loaders Engine Coolant Market, 2014–2021 (Thousand Gallons)
Table 44 Backhoe Loaders Engine Coolant Market, 2014–2021 (USD Million)
Table 45 Crawler Dozer Engine Coolant Market, 2014–2021 (Thousand Gallons)
Table 46 Crawler Dozer Engine Coolant Market, 2014–2021 (USD Million)
Table 47 Asphalt Paver Engine Coolant Market, 2014–2021 (Thousand Gallons)
Table 48 Asphalt Paver Engine Coolant Market, 2014–2021 (USD Million)
Table 49 Motor Grader Engine Coolant Market, 2014–2021 (Thousand Gallons)
Table 50 Motor Grader Engine Coolant Market, 2014–2021 (USD Million)
Table 51 Motor Scraper Engine Coolant Market, 2014–2021 (Thousand Gallons)
Table 52 Motor Scraper Engine Coolant Market, 2014–2021 (USD Million)
Table 53 Crawler Loader Engine Coolant Market, 2014–2021 (Thousand Gallons)
Table 54 Crawler Loader Engine Coolant Market, 2014–2021 (USD Million)
Table 55 Mini Excavators Engine Coolant Market, 2014–2021 (Thousand Gallons)
Table 56 Mini Excavators Engine Coolant Market, 2014–2021 (USD Million)
Table 57 Skid- Steer Loaders Engine Coolant Market, 2014–2021 (Thousand Gallons)
Table 58 Skid- Steer Loaders Engine Coolant Market, 2014–2021 (USD Million)
Table 59 Wheeled Excavators Engine Coolant Market, 2014–2021 (Thousand Gallons)
Table 60 Wheeled Excavators Engine Coolant Market, 2014–2021 (USD Million)
Table 61 Wheeled Loaders <80hp Engine Coolant Market, 2014–2021 (Thousand Gallons)
Table 62 Wheeled Loaders <80hp Engine Coolant Market, 2014–2021 (USD Million)
Table 63 Wheeled Loaders >80hp Engine Coolant Market, 2014–2021 (Thousand Gallons)
Table 64 Wheeled Loaders >80hp Engine Coolant Market, 2014–2021 (USD Million)
Table 65 Asia-Oceania: Construction Equipment Engine Coolant Market, By Application, 2014–2021 (Thousand Gallons)
Table 66 Asia-Oceania: Construction Equipment Engine Coolant Market, By Application, 2014–2021 (USD Thousand)
Table 67 Europe: Construction Equipment Engine Coolant Market, By Application, 2014–2021 (Thousand Gallons)
Table 68 Europe: Construction Equipment Engine Coolant Market, By Application, 2014–2021 (USD Thousand)
Table 69 North America: Construction Equipment Engine Coolant Market, By Application, 2014–2021 (Thousand Gallons)
Table 70 North America: Construction Equipment Engine Coolant Market, By Application, 2014–2021 (USD Thousand)
Table 71 RoW: Construction Equipment Engine Coolant Market, By Application, 2014–2021 (Thousand Gallons)
Table 72 RoW: Construction Equipment Engine Coolant Market, By Application, 2014–2021 (USD Thousand)
Table 73 Average Ratio of Antifreeze to Water in Engine Coolant, By Temperature Zones
Table 74 Automotive Market, By Region, 2014–2021 (Million Gallons)
Table 75 Market Size, By Region, 2014–2021 (USD Million)
Table 76 Market, By Vehicle Type, 2014–2021 (Million Gallons)
Table 77 Market Size, By Vehicle Type, 2014–2021 (USD Million)
Table 78 Asia Oceania Vehicle Production, By Vehicle Type, 2012-2016 (Units)
Table 79 Asia-Oceania: Market, By Country, 2014–2021 (Million Gallons)
Table 80 Asia-Oceania: Market, By Country, 2014–2021 (USD Million)
Table 81 Asia-Oceania: Market, By Vehicle Type, 2014–2021 (Million Gallons)
Table 82 Asia-Oceania: Market, By Vehicle Type, 2014–2021 (USD Million)
Table 83 China Vehicle Production, By Vehicle Type, 2011-2015 (Units)
Table 84 China: Market, By Vehicle Type, 2014–2021 (Million Gallons)
Table 85 China: Market, By Vehicle Type, 2014–2021 (USD Million)
Table 86 India Vehicle Production, By Vehicle Type, 2011-2015 (Units)
Table 87 India: Market Size, By Vehicle Type, 2014–2021 (Million Gallons)
Table 88 India: Market, By Vehicle Type, 2014–2021 (USD Million)
Table 89 Japan Vehicle Production, By Vehicle Type, 2011-2015 (Units)
Table 90 Japan: Market, By Vehicle Type, 2014–2021 (Million Gallons)
Table 91 Japan: Market, By Vehicle Type, 2014–2021 (USD Million)
Table 92 South Korea Vehicle Production, By Vehicle Type, 2011-2015 (Units)
Table 93 South Korea: Market, By Vehicle Type, 2014–2021 (Million Gallons)
Table 94 South Korea: Market Size, By Vehicle Type, 2014–2021 (USD Million)
Table 95 Thailand Vehicle Production, By Vehicle Type, 2011-2015 (Units)
Table 96 Thailand: Market, By Vehicle Type, 2014–2021 (Million Gallons)
Table 97 Thailand: Market Size, By Vehicle Type, 2014–2021 (USD Million)
Table 98 Rest of Asia-Oceania Vehicle Production, By Vehicle Type, 2011-2015 (Units)
Table 99 Rest of Asia-Oceania: Market, By Vehicle Type, 2014–2021 (Million Gallons)
Table 100 Rest of Asia-Oceania: Market, By Vehicle Type, 2014–2021 (USD Million)
Table 101 Europe Vehicle Production, By Vehicle Type, 2011-2015 (Units)
Table 102 Europe: Automotive Antifreeze OE Market, By Country, 2014–2021 (Million Gallons)
Table 103 Europe: Market, By Country, 2014–2021 (USD Million)
Table 104 Europe: Market, By Vehicle Type, 2014–2021 (Million Gallons)
Table 105 Europe: Market, By Vehicle Type, 2014–2021 (USD Million)
Table 106 France Vehicle Production, By Vehicle Type, 2011-2015 (Units)
Table 107 France: Market Size, By Vehicle Type, 2014–2021 (Million Gallons)
Table 108 France: Market, By Vehicle Type, 2014–2021 (USD Million)
Table 109 Germany Vehicle Production, By Vehicle Type, 2011-2015 (Units)
Table 110 Germany: Market, By Vehicle Type, 2014–2021 (Million Gallons)
Table 111 Germany: Automotive Antifreeze OE Market, By Vehicle Type, 2014–2021 (USD Million)
Table 112 UK Vehicle Production, By Vehicle Type, 2011-2015 (Units)
Table 113 U.K.: Market Size, By Vehicle Type, 2014–2021 (Million Gallons)
Table 114 U.K.: Market Size, By Vehicle Type, 2014–2021 (USD Million)
Table 115 Italy Vehicle Production, By Vehicle Type, 2011-2015 (Units)
Table 116 Italy: Market Size, By Vehicle Type, 2014–2021 (Million Gallons)
Table 117 Italy: Market Size, By Vehicle Type, 2014–2021 (USD Million)
Table 118 Spain Vehicle Production, By Vehicle Type, 2011-2015 (Units)
Table 119 Spain: Market Size, By Vehicle Type, 2014–2021 (Million Gallons)
Table 120 Spain: Market Size, By Vehicle Type, 2014–2021 (USD Million)
Table 121 Rest of Europe: Market Size, By Vehicle Type, 2014–2021 (Million Gallons)
Table 122 Rest of Europe: Market Size, By Vehicle Type, 2014–2021 (USD Million)
Table 123 North America Vehicle Production, By Vehicle Type, 2011-2015 (Units)
Table 124 North America: Market, By Country, 2014–2021 (Million Gallons)
Table 125 North America: Market, By Country, 2014–2021 (USD Million)
Table 126 North America: Market, By Vehicle Type, 2014–2021 (Million Gallons)
Table 127 North America: Market, By Vehicle Type, 2014–2021 (USD Million)
Table 128 US Vehicle Production, By Vehicle Type, 2011-2015 (Units)
Table 129 U.S.: Market, By Vehicle Type, 2014–2021 (Million Gallons)
Table 130 U.S.: Market, By Vehicle Type, 2014–2021 (USD Million)
Table 131 Canada Vehicle Production, By Vehicle Type, 2011-2015 (Units)
Table 132 Canada: Market, By Vehicle Type, 2014–2021 (Million Gallons)
Table 133 Canada: Market, By Vehicle Type, 2014–2021 (USD Million)
Table 134 Mexico Vehicle Production, By Vehicle Type, 2011-2015 (Units)
Table 135 Mexico: Market, By Vehicle Type, 2014–2021 (Million Gallons)
Table 136 Mexico: Market, By Vehicle Type, 2014–2021 (USD Million)
Table 137 Rest of the World: Antifreeze Market, By Country, 2014–2021 (Million Gallons)
Table 138 Rest of the World: Market, By Country, 2014–2021 (USD Million)
Table 139 Rest of the World: Market, By Vehicle Type, 2014–2021 (Million Gallons)
Table 140 Rest of the World: Market, By Vehicle Type, 2014–2021 (USD Million)
Table 141 Brazil: Market, By Vehicle Type, 2014–2021 (Million Gallons)
Table 142 Brazil: Market, By Vehicle Type, 2014–2021 (USD Million)
Table 143 Russia: Market, By Vehicle Type, 2014–2021 (Million Gallons)
Table 144 Russia: Market, By Vehicle Type, 2014–2021 (USD Million)
Table 145 RoW Others: Market, By Vehicle Type, 2014–2021 (Million Gallons)
Table 146 RoW Others: Automotive Antifreeze Market, By Vehicle Type, 2014–2021 (USD Million)
Table 147 New Product Development, 2015–2016
Table 148 Supply Contracts/Partnerships/Agreements, 2012–2016
Table 149 Expansions, 2016–2017
Table 150 Key Innovators, Innovations, and Impact on Antifreeze and Engine Coolant Market
Table 151 Royal Dutch Shell PLC: Recent Developments
Table 152 BP P.L.C.: Recent Developments
Table 153 Total: Recent Developments
Table 154 Chevron Corporation: Recent Developments
Table 155 Exxon Mobil Corporation: Recent Developments
Table 156 China Petrochemical Corporation: Recent Developments
Table 157 BASF SE: Recent Developments
Table 158 Cummins Inc.: Recent Developments
Table 159 Motul: Recent Developments
Table 160 Prestone Products Corporation: Recent Developments
Table 161 CCI Corporation
Table 162 Sonax GmbH
Table 163 Kost USA, Inc.
Table 164 Recochem Inc.
Table 165 Kmco
List of Figures (64 Figures)
Figure 1 Automotive Antifreeze Market: Research Design
Figure 2 Research Design Model
Figure 3 Breakdown of Primary Interviews: By Company Type, Designation, & Region
Figure 4 Increasing Trend of Per Capita Income for Key Countries, 2013-2015
Figure 5 Road Network vs Passenger Car Sales
Figure 6 Market Size Estimation Methodology: Bottom-Up Approach (Automotive Antifreeze OE Market)
Figure 7 Market Size Estimation Methodology: Bottom-Up Approach (Automotive Engine Coolant Aftermarket)
Figure 8 Market Size Estimation Methodology: Top-Down Approach (Automotive Antifreeze OE Market, By Product)
Figure 9 North America Region Estimated to Dominate the Market, 2016 vs 2021 (USD Million)
Figure 10 Light Commercial Vehicle Segment Estimated to Dominate the Market, 2016 vs 2021 (USD Million)
Figure 11 Ethylene Glycol Base Product Estimated to Dominate the Market , 2016 vs 2021 (USD Million)
Figure 12 China Projected to Be the Fastest Growing Market During the Forecast Period, 2016–2021 (USD Million)
Figure 13 OAT Segment Estimated to Dominate the Antifreeze Additive OE Market, 2016 vs 2021 (Thousand Gallons)
Figure 14 HOAT & OAT Additive Technology Projected to Dominate the Aftermarket for Engine Coolant (USD Million)
Figure 15 Crawler Excavator is Estimated to Dominate the Construction Equipment Engine Coolant Market (USD Million)
Figure 16 Growing Automotive Production Across the Globe to Drive the Automotive Market OE Market, By Value
Figure 17 North America to Register the Highest Growth During the Forecast Period
Figure 18 Passenger Car Segment Expected to Dominate the Market for Original Equipment During the Forecast Period
Figure 19 Increasing Demand for Bio Based Fluids to Drive the Market for Propylene and Glycerin Products
Figure 20 Demand for Biodegradable and Non Toxic Additives is Influencing the Demand for OAT and HOAT Engine Coolant
Figure 21 Increasing Average Age and Miles Travelled is Driving the Aftermarket for Engine Coolant in the Automotive Industry
Figure 22 Asia-Oceania Expected to Lead the Market for Construction Equipment Engine Coolant
Figure 23 Antifreeze and Engine Coolant: Market Dynamics
Figure 24 Increasing Vehicle Production in Key Countries Influence the OE Market for Antifreeze and Engine Coolant
Figure 25 Increasing Vehicles on Road Driving the Engine Coolant Aftermarket
Figure 26 Construction Equipment Sales, By Region, 2015-2021 (‘000 Units)
Figure 27 Battery Operated Electric Passenger Car Sales (Units)
Figure 28 Comparison of Freezing Point of 1, 3-Propanediol (PDO) and Ethylene Glycol (EG)
Figure 29 Comparative Analysis of Glycol Degradation
Figure 30 Crude Oil Price Forecast, 2013-2021
Figure 31 Techniques for Engine Coolant Recycling
Figure 32 Porter’s Five Forces Analysis: Market
Figure 33 Intensity of Competitive Rivalry in the Market is Considered Medium
Figure 34 Large Number of Players in the Market Leads to A Medium Degree of Competition in the Market
Figure 35 Easy Availability of Chemical Suppliers Makes the Threat of New Entrants High
Figure 36 Engine Coolant Presence Mandatory Makes the Threat of Substitutes Low
Figure 37 Large Number of Suppliers Makes the Bargaining Power of Suppliers Medium
Figure 38 Large Number of Suppliers Available in the Market Makes the Bargaining Power of Buyers High
Figure 39 Ethylene Glycol is Expected to Hold the Largest Market Size, 2016 vs 2021 (Million Gallons)
Figure 40 OAT is Expected to Hold the Largest Market Size, 2016–2021 (Thousand Gallons)
Figure 41 IAT Technology in the Engine Coolant Aftermarket have the Largest Market Size, 2016 vs 2021 (Million Gallons)
Figure 42 Crawler Excavators to Constitute the Largest Market Size in the Construction Equipment Engine Coolant Market, 2016–2021 (Thousand Gallons)
Figure 43 Automotive Antifreeze Market Outlook, By Region, 2016–2021
Figure 44 Asia-Oceania: Market Snapshot
Figure 45 Germany Expected to Be the Largest Market for Market in Europe, 2016 vs 2021 (USD Million)
Figure 46 North America: Market Snapshot
Figure 47 Rest of the World (RoW) Market: Regional Snapshot, 2016 vs 2021 (Million Gallons)
Figure 48 Companies Adopted New Product Launch as the Key Growth Strategy, 2010-2016
Figure 49 Growth in Segmental Revenue From 2013 to 2015
Figure 50 New Product Development Boosted Growth From 2012 to 2017
Figure 51 Battle for Market Share: New Product Development is the Key Strategy
Figure 52 BP P.L.C.: Company Snapshot
Figure 53 BP P.L.C.: SWOT Analysis
Figure 54 Royal Dutch Shell PLC: Company Snapshot
Figure 55 Royal Dutch Shell PLC: SWOT Analysis
Figure 56 Total: Company Snapshot
Figure 57 Total: SWOT Analysis
Figure 58 Chevron Corporation: Company Snapshot
Figure 59 Chevron Corporation: SWOT Analysis
Figure 60 Exxon Mobil Corporation: Company Snapshot
Figure 61 Exxon Mobil Corporation: SWOT Analysis
Figure 62 China Petrochemical Corporation: Company Snapshot
Figure 63 BASF SE: Company Snapshot
Figure 64 Cummins Inc.: Company Snapshot


Growth opportunities and latent adjacency in Antifreeze Market