Automotive Labels Market by Type (Warning, Dome, Asset), Identification Technology (Barcode, RFID), Printing Technology (Flexography, Digital printing), Mechanism (Pressure-sensitive, Heat Transfer, In-mold), Raw Material (PVC & Others), Application & Region - Global Trends & Forecasts to 2020


[340 Pages Report] The market for automotive labels is estimated to grow from USD 5.74 Billion in 2015 to reach USD 7.30 Billion by 2020, at an estimated CAGR of 4.93%. The segments considered for this report are based on type, raw material, mechanism, printing technology, identification technology, application, and region. On the basis of type, asset labels held the largest market share, in terms of value, while warning & safety labels were the most widely used labels, in terms of volume, in the automotive labels industry. The identification technology includes barcode, RFID, hologram, and others. The barcode identification technology segment accounted for the largest share in the market, in terms of both volume and value, among all identification technologies. The market is also segmented on the basis of mechanism into pressure-sensitive, glue-applied, in-mold, heat transfer, and others. This segment was dominated by the pressure-sensitive mechanism. In terms of application, the market is segmented into exterior labels, interior labels, engine components, and others. The exterior labels segment is projected to grow at the highest rate, during the review period. In terms of printing technology, the market is classified as flexography, screen printing, digital printing, offset, and others. The flexography printing technology is projected to be the market leader during the review period. The final segment, that is, region, consists of North America, Europe, Asia-Pacific, and Rest of the World (RoW). The base year considered for the study is 2014 and the market size is projected from 2015 to 2020.
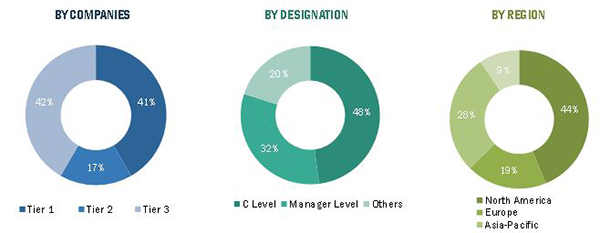
The research methodology used to estimate and forecast the market size was with the help of the top-down approach. The total market size of automotive labels was calculated based on the percentage split of automotive labels out of the overall industrial labels as well as on the percentage spilt of different materials used in manufacturing automotive labels. This allotment and calculation was done on the basis of extensive primary interviews and secondary research. Primary research involved in this report includes extensive interviews with key people such as CEOs, VPs, directors, and executives. After arriving at the overall market size, the total market was split into several segments and subsegments. Data triangulation and market breakdown procedures were employed to complete the overall market engineering process and arrive at the exact statistics for all segments and subsegments. The breakdown of profiles of primary is depicted in the following figure:
The global automotive labels market ecosystem comprises of automotive labels manufacturers, vendors and service providers such as CCL Industries, Inc. (Canada), H.B. Fuller (U.S.), Avery Dennison Corporation (U.S.), 3M (U.S.), UPM (Finland), and Sika AG (Switzerland). Others include companies such as ImageTek Labels (U.S.), Lewis Labels Products (U.S.), Dunmore (U.S.), and Adhesive Research, Inc. (U.S.).
This report estimates the size of the automotive labels in terms of volume (million square meter) and value (USD million). In this report, the market has been segmented broadly on the basis of type, raw material, identification technology, printing technology, mechanism, application, and region. The market drivers, restraints, opportunities, challenges, and product price trends have been discussed in detail.
Target audience
- Package & labels manufacturers
- Automotive & parts manufacturers
- Government bodies
- Raw material suppliers
Scope of the Report
The research report segments automotive labels in the following submarkets:
By Type:
- Warning & safety labels
- Branding labels
- Dome labels
- Asset labels
- Others (inventory tags, VIN labels, and nameplates)
By Raw Material:
- Polyvinyl chloride (PVC)
- Polypropylene (PP)
- Polyethylene terephthalate (PET)
- Polyethylene (PE)
- Acrylonitrile butadiene styrene (ABS)
- Polyurethane (PU)
- Polycarbonate (PC)
- Others (paper & paperboard and metal)
By Mechanism:
- Pressure-sensitive
- Glue-applied
- Heat transfer
- In-mold
- Others (wrap around)
By Application:
- Exterior labels
- Interior labels
- Engine component labels
- Others (mechanical automotive components except engine parts)
By Printing Technology:
- Flexography
- Offset
- Digital printing
- Screen printing
- Others (letterpress and gravure printing)
By Identification Technology:
- RFID
- Barcode
- Hologram
- Others (color coding)
By Region:
- North America
- Europe
- Asia-Pacific
- RoW
MarketsandMarkets projects that the market for automotive labels will grow from USD 5.74 Billion in 2015 to USD 7.30 Billion by 2020, at an estimated CAGR of 4.93%. This market is growing due to increasing parent industries such as automotive and packaging & labeling, mandatory compliance to the automotive labeling laws, rising demand of smart labels such as RFID & barcode, and rising demand for environmentally efficient labels production techniques. The emerging economies such as India, China, South Africa, and Brazil possess a great potential for the automotive labels market.
The automotive labels market is segmented on the basis of type, raw material, identification technology, printing technology, mechanism, application, and region. On the basis of type, asset labels held the largest market share, in terms of value, while warning & safety labels were the most widely used labels, in terms of volume, in the automotive labels industry. The barcode identification technology segment accounted for the largest share of the market, in terms of both, volume and value, among all identification technologies. The mechanism segment was dominated by the pressure-sensitive mechanism.
In terms of application, the market is segmented into exterior labels, interior labels, engine components, and others. The exterior labels segment is projected to grow at the highest rate, during the review period. In terms of printing technology, the market is classified as flexography, screen printing, digital printing, offset, and others. The flexography printing technology is projected to be the market leader during the review period. The automotive labels market is segmented on the basis of material into polyvinyl chloride (PVC), polypropylene (PP), polyethylene terephthalate (PET), polyethylene (PE), acrylonitrile butadiene styrene (ABS), polyurethane (PU), polycarbonate (PC), and others.
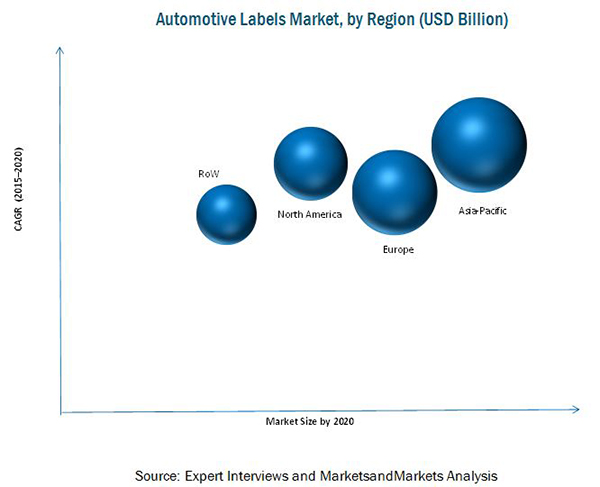
On the basis of key regions, the market for automotive labels is segmented into North America, Europe, Asia-Pacific, and Rest of the World (RoW). The Asia-Pacific region held the largest share among all the regions in 2014. This is mainly due to emerging economies in China and India, the growing automotive industry, and rising demand for sustainable packaging.
New product development was the major strategy adopted by most of the players in the market. Companies such as CCL Industries, Inc. (Canada), Sika AG (Switzerland), Adhesive Research, Inc. (U.S.), ImageTek Labels (U.S.), Lewis Label Products (U.S.), Dunmore (U.S.), 3M (U.S.), UPM (Finland), Avery Denison Corporation (U.S.), and H.B. Fuller (U.S.) were the key players who adopted this strategy to increase the reach of their offerings, improve their production capacity, and establish focus on core operations. Companies also emphasized investment & expansion to increase their business operations in the fast-growing regions. These companies have a strong product portfolio and distribution network and influencing presence in the developed as well as developing economies. However, varying environmental mandates across regions act as a restraint for the automotive labels market.
 Exclusive indicates content/data unique to MarketsandMarkets and not available with any competitors.
Table of Contents
1 Introduction (Page No. - 32)
1.1 Objectives of the Study
1.2 Market Definition
1.3 Study Scope
1.3.1 Geographic Scope
1.3.2 Years Considered for the Study
1.4 Currency
1.5 Stakeholders
2 Research Methodology (Page No. - 36)
2.1 Research Data
2.1.1 Secondary Data
2.1.1.1 Key Data From Secondary Sources
2.1.2 Primary Data
2.1.2.1 Key Data From Primary Sources
2.1.2.2 Key Industry Insights
2.2 Market Size Estimation
2.3 Market Breakdown and Data Triangulation
2.4 Market Share Estimation
2.5 Research Assumptions & Limitations
2.5.1 Assumptions
2.5.2 Limitations
3 Executive Summary (Page No. - 45)
3.1 The Global Automotive Labels Market Was Valued at USD 5.51 Billion in 2014
4 Premium Insights (Page No. - 49)
4.1 China: Fastest-Growing Market in the Coming Years for the Automotive Labels Market
4.2 Asset Labels to Dominate the Automotive Labels Market By 2020
4.3 China to Capture Largest Share in the Emerging Asia-Pacific Market in 2015
4.4 Asia-Pacific & North America Will Be Prime Revenue Generators for the Automotive Labels Market By 2020
4.5 Automotive Labels Market: Developing vs Developed Countries
4.6 Automotive Labels Market Share (Value), By Application, 2020
4.7 Automotive Labels Market Share (Value), By Material, 2015- 2020
4.8 Life Cycle Analysis, By Region
5 Market Overview (Page No. - 54)
5.1 Introduction
5.2 Market Evolution
5.3 Market Segmentation
5.3.1 By Type
5.3.2 By Mechanism
5.3.3 By Application
5.3.4 By Printing Technology
5.3.5 By Identification Technology
5.3.6 By Raw Material
5.3.7 By Region
5.4 Market Dynamics
5.4.1 Drivers
5.4.1.1 Growing Demand From the Automotive Industry
5.4.1.2 Growing Demand for Rfid Labels
5.4.1.3 Mandatory Compliance With Automotive Labeling Laws
5.4.2 Restraints
5.4.2.1 Varying Mandates Across Regions
5.4.3 Opportunities
5.4.3.1 Countries With Emerging Economies
5.4.3.2 Emergence of New Products
5.4.4 Challenges
5.4.4.1 Cost-To-Benefit Ratio A Concern to Small Manufacturers
6 Industry Trends (Page No. - 66)
6.1 Introduction
6.2 Value Chain
6.3 Porter�s Five Forces Analysis
6.3.1 Bargaining Power of Suppliers
6.3.2 Bargaining Power of Buyers
6.3.3 Threat of New Entrants
6.3.4 Threat of Substitutes
6.3.5 Intensity of Competitive Rivalry
7 Automotive Labels Market, By Type (Page No. - 71)
7.1 Introduction
7.2 Warning & Safety Labels
7.2.1 Warning & Safety Labels Market, By Mechanism
7.2.1.1 Pressure-Sensitive Segment is Projected to Grow at the Highest CAGR From 2015 to 2020
7.2.2 Warning & Safety Labels, By Identification Technology
7.2.2.1 Rfid Was the Most Preferred Identification Technology in 2014
7.2.3 Warning & Safety Labels Market, By Printing Technology
7.2.3.1 Digital Printing Technology is Projected to Be the Fastest-Growing Segment From 2015 to 2020
7.2.4 Warning & Safety Labels Market, By Application
7.2.4.1 Warning & Safety Labels is Largely Used for Exterior Application Market
7.3 Asset Labels
7.3.1 Asset Labels Market Size, By Mechanism
7.3.1.1 Pressure-Sensitive Mechanism Dominated the Asset Label Market in 2014
7.3.2 Asset Labels, By Identification Technology
7.3.2.1 Barcode Identification Technology Accounted for the Largest Market Share in 2014
7.3.3 Asset Labels Market, By Printing Technology
7.3.3.1 Flexography Printing Technology Accounted for the Largest Market Share in 2014
7.3.4 Asset Labels Market, By Application
7.3.4.1 Exterior Labels Segment is Projected to Grow at the Highest CAGR From 2015 to 2020
7.4 Branding Labels
7.4.1 Branding Labels Market Size, By Mechanism
7.4.1.1 Pressure-Sensitive Mechanism Accounted for the Largest Market Share in 2014
7.4.2 Branding Labels, By Identification Technology
7.4.2.1 Barcode Identification Technology is Projected to Grow at the Highest CAGR From 2015 to 2020
7.4.3 Branding Labels Market, By Printing Technology
7.4.3.1 Digital Printing is Projected to Grow at the Highest CAGR From 2015 to 2020
7.4.4 Branding Labels Market, By Application
7.4.4.1 Interior Labels is Projected to Grow at the Second-Highest CAGR From 2015 to 2020
7.5 Dome Labels
7.5.1 Dome Labels Market, By Mechanism
7.5.1.1 Heat Transfer Printing Technology is Projected to Grow at the Second-Highest CAGR From 2015 to 2020
7.5.2 Dome Labels, By Identification Technology
7.5.2.1 Hologram Identification Technology Accounted for the Largest Market Share in 2014
7.5.3 Dome Labels Market, By Printing Technology
7.5.3.1 Flexography Printing Technology Accounted for the Largest Market Share in 2014
7.5.4 Dome Labels Market, By Application
7.5.4.1 Exterior Labels is Projected to Grow at the Highest CAGR During the Forecast Period
7.6 Other Automotive Labels
7.6.1 Other Automotive Labels Market, By Mechanism
7.6.1.1 Pressure-Sensitive Mechanism Dominated the Market in 2014
7.6.2 Other Automotive Labels, By Identification Technology
7.6.2.1 Barcode Was the Most Preferred Identification Technology in 2014
7.6.3 Other Automotive Labels Market, By Printing Technology
7.6.3.1 Digital Printing Technology Projected to Grow at the Highest CAGR From 2015 to 2020
7.6.4 Other Automotive Labels Market, By Application
7.6.4.1 Interior Labels Segment is Projected to Grow at the Second-Highest CAGR From 2015 to 2020
8 Automotive Labels Market, By Raw Material (Page No. - 96)
8.1 Introduction
8.2 Polypropylene
8.2.1 Polypropylene Market, By Type
8.2.1.1 Asset Labels Dominated the Market, in Terms of Value, in 2014
8.2.2 Polypropylene Market , By Application
8.2.2.1 The Interior Labels Segment is Projected to Grow at the Highest CAGR From 2015 to 2020
8.3 Polyethylene (PE)
8.3.1 Polyethylene Market, By Type
8.3.1.1 Branding Labels Accounted for the Second-Largest Market Share in 2014
8.3.2 Polyethylene Market , By Application
8.3.2.1 The Interior Labels Segment Projected to Grow at the Second-Highest CAGR Between 2015 and 2020
8.4 Polyethylene Terephthalate (PET)
8.4.1 Polyethylene Terephthalate Market, By Type
8.4.1.1 The Warning & Safety Labels Segment is Projected to Grow at the Second-Highest CAGR From 2015 to 2020
8.4.2 Polyethylene Terephthalate Market, By Application
8.4.2.1 Engine Components Accounted for the Second-Largest Market Share in 2014
8.5 Polyvinyl Chloride (PVC)
8.5.1 Polyvinyl Chloride Market, By Type
8.5.1.1 The Asset Labels Segment is Projected to Grow at the Highest CAGR Between 2015 and 2020
8.5.2 Polyvinyl Chloride Market, By Application
8.5.2.1 Engine Component Accounted for the Second-Largest Market Share in 2014
8.6 Polycarbonate (PC)
8.6.1 Polycarbonate Market, By Type
8.6.1.1 The Warning & Safety Segment is Projected to Grow at the Second-Largest CAGR Between 2015 and 2020
8.6.2 Polycarbonate Market, By Application
8.6.2.1 Exterior Labels Dominated the Market, in Terms of Value, in 2014
8.7 Acrylonitrile Butadiene Styrene (ABS)
8.7.1 Acrylonitrile Butadiene Styrene Market, By Type
8.7.1.1 The Asset Labels Segment is Projected to Grow at the Highest CAGR From 2015 to 2020
8.7.2 Acrylonitrile Butadiene Styrene Market, By Application
8.7.2.1 The Interior Labels Segment is Projected to Grow at the Second-Highest CAGR Between 2015 and 2020
8.8 Polyurethane (PU)
8.8.1 Polyurethane Market, By Type
8.8.1.1 Branding Labels Accounted for the Second Largest Market Share in 2014
8.8.2 Polyurethane Market, By Application
8.8.2.1 The Exterior Labels Segment is Projected to Grow at the Highest CAGR From 2015 to 2020
8.9 Others
8.9.1 Other Raw Materials Market, By Type
8.9.1.1 Warning & Safety Labels Projected to Grow at the Second-Highest CAGR From 2015 to 2020
8.9.2 Other Raw Materials Market Size, By Application
8.9.2.1 Exterior Labels Dominated the Market, in Terms of Value, in 2014
9 Automotive Labels Market, By Identification Technology (Page No. - 119)
9.1 Introduction
9.2 Barcode
9.3 Rfid
9.4 Hologram
9.5 Others
10 Automotive Labels Market, By Printing Technology (Page No. - 124)
10.1 Introduction
10.2 Flexography
10.2.1 Flexography Market, By Mechanism
10.3 Offset
10.3.1 Offset Market, By Mechanism
10.4 Digital Printing
10.4.1 Digital Printing Market, By Mechanism
10.5 Screen Printing
10.5.1 Screen Printing Market, By Mechanism
10.6 Others
10.6.1 Other Automotive Labels Printing Technology Market, By Mechanism
11 Automotive Labels Market, By Mechanism (Page No. - 135)
11.1 Introduction
11.2 Pressure-Sensitive Labeling
11.3 Glue-Applied Labeling
11.4 Heat Transfer
11.5 In-Mold Labeling
11.6 Others
12 Automotive Labels Market, By Application (Page No. - 139)
12.1 Introduction
12.2 Exterior Labels
12.2.1 Exterior Labels Automotive Labels Market, By Mechanism
12.2.1.1 Pressure-Sensitive Hold the Largest Market Share in Exterior Label Segment in 2014
12.3 Engine Components
12.3.1 Engine Components Automotive Labels Market, By Mechanism
12.3.1.1 Pressure-Sensitive Labels are Projected to Grow at A Highest CAGR in Engine Components Segment
12.4 Interior Labels
12.4.1 Interior Labels Automotive Labels Market, By Mechanism
12.4.1.1 Pressure-Sensitive Mechanism Dominated the Automotive Labels Market in Interior Labels Segment in 2014
12.5 Others
12.5.1 Other Automotive Labels Market, By Mechanism
12.5.1.1 Heat Transfer Mechanism is Projected to Grow at the Second-Highest Rate From 2015 to 2020
13 Automotive Labels Market, By Region (Page No. - 147)
13.1 Introduction
13.2 North America
13.2.1 North America: Automotive Labels Market, By Country
13.2.1.1 U.S. to Contribute Major Share in North American Automotive Labels Market
13.2.2 North America: Automotive Labels Market, By Raw Material
13.2.2.1 PP Material is Projected to Grow at the Highest CAGR From 2015 to 2020
13.2.3 North America: Automotive Labels Market, By Type
13.2.3.1 Asset Labels Dominated the U.S. Automotive Labels Market in 2014
13.2.4 North America: Automotive Labels Market, By Mechanism
13.2.4.1 Pressure-Sensitive Mechanism Projected to Dominate the North American Automotive Labels Market By 2020
13.2.5 North America: Automotive Labels Market, By Application
13.2.5.1 Exterior Labels Dominated the North American Automotive Labels Market in 2014
13.2.6 U.S.
13.2.7 U.S.: Automotive Labels Market Size, By Raw Material
13.2.7.1 PET Projected to Grow at the Second-Highest CAGR Between 2015 and 2020
13.2.8 U.S.: Automotive Labels Market Size, By Type
13.2.8.1 Asset Labels Projected to Grow at the Highest CAGR From 2015 to 2020
13.2.9 U.S.: Automotive Labels Market Size, By Mechanism
13.2.9.1 Heat Transfer Mechanism Projected to Grow at the Second-Highest CAGR From 2015 to 2020
13.2.10 U.S.: Automotive Labels Market Size, By Application
13.2.10.1 Interior Labels Projected to Grow at the Highest CAGR Between 2015 and 2020
13.2.11 Canada
13.2.12 Canada: Automotive Labels Market Size, By Raw Material
13.2.12.1 PP Dominated the Canadian Automotive Labels Market in 2014
13.2.13 Canada: Automotive Labels Market Size, By Type
13.2.13.1 Asset Labels Projected to Grow at the Highest CAGR Between 2015 and 2020
13.2.14 Canada: Automotive Labels Market Size, By Mechanism
13.2.14.1 Pressure-Sensitive Mechanism Dominated the Canadian Automotive Labels Market in 2014
13.2.15 Canada: Automotive Labels Market Size, By Application
13.2.15.1 Interior Labels Projected to Grow at the Highest CAGR From 2015 to 2020
13.2.16 Mexico
13.2.17 Mexico: Automotive Labels Market Size, By Raw Material,
13.2.17.1 PP Dominated the Mexican Automotive Labels Market in 2014
13.2.18 Mexico: Automotive Labels Market Size, By Type
13.2.18.1 Asset Labels Dominated the Automotive Labels Market in 2014
13.2.19 Mexico: Automotive Labels Market Size, By Mechanism
13.2.19.1 Pressure-Sensitive Projected to Grow at the Highest CAGR From 2015 to 2020
13.2.20 Mexico: Automotive Labels Market Size, By Application
13.2.20.1 Interior Labels Projected to Be the Second-Largest in the Mexican Automotive Labels Market By 2020
13.3 Europe
13.3.1 Europe: Automotive Labels Market, By Country
13.3.1.1 Germany to Contribute Major Share in European Automotive Labels Market
13.3.2 Europe: Automotive Labels Market, By Raw Material
13.3.2.1 PP Held the Largest Share in the European Automotive Labels Market in 2014
13.3.3 Europe: Automotive Labels Market, By Type
13.3.3.1 Asset Labels Projected to Be the Market Leader in Terms of CAGR From 2015 to 2020
13.3.4 Europe: Automotive Labels Market, By Mechanism
13.3.4.1 Heat-Transfer Mechanism Projected to Grow at the Second-Highest CAGR From 2015 to 2020
13.3.5 Europe: Automotive Labels Market, By Application
13.3.5.1 Exterior Labels Dominated the European Automotive Labels Market in 2014
13.3.6 U.K.
13.3.7 U.K.: Automotive Labels Market Size, By Raw Material
13.3.7.1 PET Projected to Grow at the Highest CAGR From 2015 to 2020
13.3.8 U.K.: Automotive Labels Market Size, By Type
13.3.8.1 Warning & Safety Labels Projected Grow at the Second-Highest CAGR Between 2015 and 2020
13.3.9 U.K.: Automotive Labels Market Size, By Mechanism
13.3.9.1 Glue-Applied Held the Second-Largest Share in the U.K. Automotive Labels Market in 2014
13.3.10 U.K.: Automotive Labels Market Size, By Application
13.3.10.1 Exterior Labels Projected to Grow at the Highest CAGR From 2015 to 2020
13.3.11 Germany
13.3.12 Germany: Automotive Labels Market Size, By Raw Material
13.3.12.1 PP Projected to Grow at the Highest CAGR Between 2015 and 2020
13.3.13 Germany: Automotive Labels Market Size, By Type
13.3.13.1 Asset Labels Dominated the German Automotive Labels Market in 2014 and is Projected to Grow at the Highest CAGR From 2015 to 2020
13.3.14 Germany: Automotive Labels Market Size, By Mechanism
13.3.14.1 Heat-Transfer Mechanism Projected to Grow at the Second-Highest CAGR From 2015 to 2020
13.3.15 Germany: Automotive Labels Market Size, By Application
13.3.15.1 Exterior Labels Projected to Grow at the Highest CAGR Between 2015 and 2020
13.3.16 France
13.3.17 France: Automotive Labels Market Size, By Raw Material
13.3.17.1 PET Projected to Grow at the Highest CAGR From 2015 to 2020
13.3.18 France: Automotive Labels Market Size, By Type
13.3.18.1 Asset Labels Projected to Grow at the Highest CAGR From 2015 to 2020
13.3.19 France: Automotive Labels Market Size, By Mechanism
13.3.19.1 Heat Transfer Mechanism Projected to Grow at the Second-Highest CAGR From 2015 to 2020
13.3.20 France: Automotive Labels Market Size, By Application
13.3.20.1 Engine Components Held the Second-Largest Market Share in 2014
13.3.21 Spain
13.3.22 Spain: Automotive Labels Market Size, By Raw Material
13.3.22.1 PP Projected to Grow at the Highest CAGR Between 2015 and 2020
13.3.23 Spain: Automotive Labels Market Size, By Type
13.3.23.1 Branding Labels Held the Second-Largest Market Share in 2014
13.3.24 Spain: Automotive Labels Market Size, By Mechanism
13.3.24.1 Pressure-Sensitive Mechanism Projected to Grow at the Highest CAGR Between 2015 and 2020
13.3.25 Spain: Automotive Labels Market Size, By Application
13.3.25.1 Exterior Labels Projected to Grow at the Highest CAGR From 2015 to 2020
13.3.26 Czech Republic
13.3.27 Czech Republic: Automotive Labels Market Size, By Raw Material
13.3.27.1 PP Projected to Grow at the Highest CAGR From 2015 to 2020
13.3.28 Czech Republic: Automotive Labels Market Size, By Type
13.3.28.1 Warning & Safety Labels Projected to Grow at the Second-Highest CAGR Between 2015 and 2020
13.3.29 Czech Republic: Automotive Labels Market Size, By Mechanism
13.3.29.1 Glue-Applied Mechanism Held the Second-Largest Market Share in 2014
13.3.30 Czech Republic: Automotive Labels Market Size, By Application
13.3.30.1 Exterior Labels Projected to Grow at the Highest CAGR From 2015 to 2020
13.3.31 Rest of Europe
13.3.32 Rest of Europe: Automotive Labels Market Size, By Raw Material
13.3.32.1 PP Held the Largest Market Share in 2014
13.3.33 Rest of Europe: Automotive Labels Market Size, By Type
13.3.33.1 Warning & Safety Labels Projected to Grow at the Highest CAGR From 2015 to 2020
13.3.34 Rest of Europe: Automotive Labels Market Size, By Mechanism
13.3.34.1 Pressure-Sensitive Mechanism Dominated the Market in 2014
13.3.35 Rest of Europe: Automotive Labels Market Size, By Application
13.3.35.1 Engine Component Labels Held the Second-Largest Market Share in 2014
13.4 Asia-Pacific
13.4.1 Asia-Pacific: Automotive Labels Market Size, By Country
13.4.1.1 China Market Projected to Grow at the Highest CAGR From 2015 to 2020
13.4.2 Asia-Pacific: Automotive Labels Market Size, By Raw Material
13.4.2.1 PET in Asia-Pacific Held the Second-Largest Market Share in 2014
13.4.3 Asia-Pacific: Automotive Labels Market Size, By Type
13.4.3.1 Warning & Safety Labels Segment in Asia-Pacific Projected to Grow at the Second Highest CAGR From 2015 to 2020
13.4.4 Asia-Pacific: Automotive Labels Market Size, By Mechanism
13.4.4.1 Heat-Transfer Mechanism Segment in Asia-Pacific Projected Grow at the Second-Highest CAGR Between 2015 and 2020
13.4.5 Asia-Pacific: Automotive Labels Market Size, By Application
13.4.5.1 Exterior Labels Segment in Asia-Pacific Projected to Grow at the Highest CAGR From 2015 to 2020
13.4.6 China
13.4.7 China: Automotive Labels Market Size, By Raw Material
13.4.7.1 PP Projected to Grow at the Highest CAGR From 2015 to 2020
13.4.8 China: Automotive Labels Market Size, By Type
13.4.8.1 Asset Labels Segment in China Projected to Grow at the Highest CAGR Between 2015 and 2020
13.4.9 China: Automotive Labels Market Size, By Mechanism
13.4.9.1 Pressure-Sensitive Mechanism Segment in China Projected to Grow at the Highest CAGR From 2015 to 2020
13.4.10 China: Automotive Labels Market Size, By Application
13.4.10.1 Interior Labels Segment in China Projected to Grow at the Highest CAGR From 2015 to 2020
13.4.11 India
13.4.12 India: Automotive Labels Market Size, By Raw Material
13.4.12.1 PP in India Projected to Grow at the Highest CAGR From 2015 to 2020
13.4.13 India: Automotive Labels Market Size, By Type
13.4.13.1 Branding Labels Segment Held the Second-Largest Market Share in India in 2014
13.4.14 India: Automotive Labels Market Size, By Mechanism
13.4.14.1 Heat-Transfer Mechanism Segment in India Projected to Grow at the Second-Highest CAGR From 2015 to 2020
13.4.15 India: Automotive Labels Market Size, By Application
13.4.15.1 Engine Component Labels Segment Held the Second-Largest Market Share in 2014
13.4.16 Japan
13.4.17 Japan: Automotive Labels Market Size, By Raw Material
13.4.17.1 PET Held the Second Largest Share in Japan in 2014
13.4.18 Japan: Automotive Labels Market Size, By Type
13.4.18.1 Asset Labels Segment in Japan Projected Grow at the Highest CAGR From 2015 to 2020
13.4.19 Japan: Automotive Labels Market Size, By Mechanism
13.4.19.1 Heat-Transfer Mechanism Segment in Japan Projected to Grow at the Second-Highest CAGR From 2015 to 2020
13.4.20 Japan: Automotive Labels Market Size, By Application
13.4.20.1 Exterior Labels Segment in Japan Projected to Grow at the Highest CAGR From 2015 to 2020
13.4.21 South Korea
13.4.22 South Korea: Automotive Labels Market Size, By Raw Material
13.4.22.1 PP in South Korea Projected to Grow at the Highest CAGR Between 2015 and 2020
13.4.23 South Korea: Automotive Labels Market Size, By Type
13.4.23.1 Asset Labels Segment in South Korea Projected to Grow at the Highest CAGR From 2015 to 2020
13.4.24 South Korea: Automotive Labels Market Size, By Mechanism
13.4.24.1 Pressure-Sensitive Mechanism Segment in South Korea Projected to Grow at the Highest CAGR From 2015 to 2020
13.4.25 South Korea: Automotive Labels Market Size, By Application
13.4.25.1 Exterior Labels Segment Projected to Grow at the Highest CAGR From 2015 to 2020
13.4.26 Rest of Asia-Pacific
13.4.27 Rest of Asia-Pacific: Automotive Labels Market Size, By Raw Material
13.4.27.1 PET Held the Second-Largest Market Share in 2014
13.4.28 Rest of Asia-Pacific: Automotive Labels Market Size, By Type
13.4.28.1 Warning & Safety Labels Segment in Rest of Asia-Pacific Projected Grow at the Highest CAGR From 2015 to 2020
13.4.29 Rest of Asia-Pacific: Automotive Labels Market Size, By Mechanism
13.4.29.1 Glue-Applied Segment in Rest of Asia-Pacific Held the Second-Largest Market Share in 2014
13.4.30 Rest of Asia-Pacific: Automotive Labels Market Size, By Application
13.4.30.1 Engine Components Segment in Rest of Asia-Pacific Held the Second-Largest Market Share in 2014
13.5 Rest of the World (RoW)
13.5.1 RoW: Automotive Labels Market Size, By Country
13.5.1.1 Brazil Market Projected to Grow at the Highest CAGR From 2015 to 2020
13.5.2 RoW: Automotive Labels Market Size, By Raw Material
13.5.2.1 PP in RoW Projected to Grow at the Highest CAGR Between 2015 and 2020
13.5.3 RoW: Automotive Labels Market Size, By Type
13.5.3.1 Warning & Safety Labels Segment Projected to Grow at the Highest CAGR From 2015 to 2020
13.5.4 RoW: Automotive Labels Market Size, By Mechanism
13.5.4.1 Glue-Applied Mechanism Segment in RoW Held the Second-Largest Market Share in 2014
13.5.5 RoW: Automotive Labels Market Size, By Application
13.5.5.1 Interior Labels Segment in RoW Projected to Grow at the Second-Highest CAGR From 2015 to 2020
13.5.6 Brazil
13.5.7 Brazil: Automotive Labels Market Size, By Raw Material
13.5.7.1 PET Segment in RoW Held the Second-Largest Market Share in 2014
13.5.8 Brazil: Automotive Labels Market Size, By Type
13.5.8.1 Asset Labels Segment in Brazil Held the Largest Market Share in 2014
13.5.9 Brazil: Automotive Labels Market Size, By Mechanism
13.5.9.1 Heat-Transfer Mechanism Segment in Brazil Projected to Grow at the Second-Highest CAGR From 2015 to 2020
13.5.10 Brazil: Automotive Labels Market Size, By Application
13.5.10.1 Interior Labels Segment in Brazil Projected to Grow at the Second-Highest CAGR From 2015 to 2020
13.5.11 South Africa
13.5.12 South Africa: Automotive Labels Market Size, By Raw Material
13.5.12.1 PET Segment in South Africa Projected to Grow at the Highest CAGR From 2015 to 2020
13.5.13 South Africa: Automotive Labels Market Size, By Type
13.5.13.1 Branding Labels Segment Held the Second-Largest Market Share in 2014
13.5.14 South Africa: Automotive Labels Market Size, By Mechanism
13.5.14.1 Glue-Applied Mechanism Segment in South Africa Held the Second-Largest Market Share in 2014
13.5.15 South Africa: Automotive Labels Market Size, By Application
13.5.15.1 Exterior Labels Segment in South Africa Projected to Grow at the Highest CAGR From 2015 to 2020
13.5.16 Argentina
13.5.17 Argentina: Automotive Labels Market Size, By Raw Material
13.5.17.1 PP Segment in Argentina Projected to Grow at the Second-Highest CAGR From 2015 to 2020
13.5.18 Argentina: Automotive Labels Market Size, By Type
13.5.18.1 Warning & Safety Labels Segment Projected to Grow at the Second-Highest CAGR From 2015 to 2020
13.5.19 Argentina: Automotive Labels Market Size, By Mechanism
13.5.19.1 Heat-Transfer Mechanism Segment Projected to Grow at the Second-Highest CAGR From 2015 to 2020
13.5.20 Argentina: Automotive Labels Market Size, By Application
13.5.20.1 Interior Labels Segment in Argentina Projected to Grow at the Second-Highest CAGR From 2015 to 2020
13.5.21 Others in RoW
13.5.22 Others in RoW: Automotive Labels Market Size, By Raw Material
13.5.22.1 PET Segment in Others in RoW Projected to Grow at the Highest CAGR From 2015 to 2020
13.5.23 Others in RoW: Automotive Labels Market Size, By Type
13.5.23.1 Branding Labels Segment in Others in RoW Held the Second-Largest Market Share in 2014
13.5.24 Others in RoW: Automotive Labels Market Size, By Mechanism
13.5.24.1 Pressure-Sensitive Segment in Others in RoW Held the Largest Market Share in 2014
13.5.25 Others in RoW: Automotive Labels Market Size, By Application
13.5.25.1 Exterior Labels Segment Projected to Grow at the Highest CAGR From 2015 to 2020
14 Competitive Landscape (Page No. - 265)
14.1 Overview
14.2 Competitive Situation & Trends
14.3 New Product Developments
14.4 Investments & Expansions
14.5 Acquisitions
14.6 Agreements
15 Company Profiles (Page No. - 271)
(Company at A Glance, Recent Financials, Products & Services, Strategies & Insights, & Recent Developments)*
15.1 Introduction
15.2 3M
15.3 UPM Raflatac
15.4 Avery Dennison Corporation
15.5 Sika AG
15.6 CCL Industries, Inc.
15.7 H.B. Fuller
15.8 Imagetek Labels
15.9 Lewis Label Products
15.10 Dunmore
15.11 Adhesive Research, Inc.
*Details on Company at A Glance, Recent Financials, Products & Services, Strategies & Insights, & Recent Developments Might Not Be Captured in Case of Unlisted Companies.
16 Appendix (Page No. - 293)
16.1 Insights of Industry Experts
16.2 Discussion Guide
16.3 Knowledge Store: Marketsandmarkets� Subscription Portal
16.4 Introducing RT: Real Time Market Intelligence
16.5 Available Customizations
16.6 Related Reports
List of Tables (309 Tables)
Table 1 Market Segmentation of Automotive Labels, By Type
Table 2 Market Segmentation of Automotive Labels, By Mechanism
Table 3 Market Segmentation of Automotive Labels, By Application
Table 4 Market Segmentation of Automotive Labels, By Printing Technology
Table 5 Market Segmentation of Automotive Labels, By Identification Technology
Table 6 Market Segmentation of Automotive Labels, By Raw Material
Table 7 Market Segmentation of Automotive Labels, By Region
Table 8 Motor Vehicle Sales Statistics for the Period 2012 (Q2) to 2015 (Q2)
Table 9 Uses of Rfid Labels in Automotive Industry
Table 10 Automotive Labels Market Size, By Type, 2013-2020 (USD Million)
Table 11 Automotive Labels Market Size, By Type, 2013-2020 (Million Square Meters)
Table 12 Warning & Safety Labels Market Size, By Mechanism, 2013-2020 (USD Million)
Table 13 Warning & Safety Labels Market Size, By Mechanism, 2013-2020 (Million Square Meters)
Table 14 Warning & Safety Labels Market Size, By Identification Technology, 2013-2020 (USD Million)
Table 15 Warning & Safety Labels Market Size, By Identification Technology, 2013-2020 (Million Square Meters)
Table 16 Warning & Safety Labels Market Size, By Printing Technology, 2013-2020 (USD Million)
Table 17 Warning & Safety Labels Market Size, By Printing Technology, 2013-2020 (Million Square Meters)
Table 18 Warning & Safety Labels Market Size, By Application, 2013-2020 (USD Million)
Table 19 Warning & Safety Labels Market Size, By Application, 2013-2020 (Million Square Meters)
Table 20 Types of Asset Labels
Table 21 Asset Labels Market Size, By Mechanism, 2013-2020 (USD Million)
Table 22 Asset Labels Market Size, By Mechanism, 2013-2020 (Million Square Meters)
Table 23 Asset Labels Market Size, By Identification Technology, 2013-2020 (USD Million)
Table 24 Asset Labels Market Size, By Identification Technology, 2013-2020 (Million Square Meters)
Table 25 Asset Labels Market Size, By Printing Technology, 2013-2020 (USD Million)
Table 26 Asset Labels Market Size, By Printing Technology, 2013-2020 (Million Square Meters)
Table 27 Asset Labels Market Size, By Application, 2013-2020 (USD Million)
Table 28 Asset Labels Market Size, By Application, 2013-2020 (Million Square Meters)
Table 29 Branding Labels Market Size, By Mechanism, 2013-2020 (USD Million)
Table 30 Branding Labels Market Size, By Mechanism, 2013-2020 (Million Square Meters)
Table 31 Branding Labels Market Size, By Identification Technology, 2013-2020 (USD Million)
Table 32 Branding Labels Market Size, By Identification Technology, 2013-2020 (Million Square Meters)
Table 33 Branding Labels Market Size, By Printing Technology, 2013-2020 (USD Million)
Table 34 Branding Labels Market Size, By Printing Technology, 2013-2020 (Million Square Meters)
Table 35 Branding Labels Market Size, By Application, 2013-2020 (USD Million)
Table 36 Branding Labels Market Size, By Application, 2013-2020 (Million Square Meters)
Table 37 Dome Labels Market Size, By Mechanism, 2013-2020 (USD Million)
Table 38 Dome Labels Market Size, By Mechanism, 2013-2020 (Million Square Meters)
Table 39 Dome Labels Market Size, By Identification Technology, 2013-2020 (USD Million)
Table 40 Dome Labels Market Size, By Identification Technology, 2013-2020 (Million Square Meters)
Table 41 Dome Labels Market Size, By Printing Technology, 2013-2020 (USD Million)
Table 42 Dome Labels Market Size, By Printing Technology, 2013-2020 (Million Square Meters)
Table 43 Dome Labels Market Size, By Application, 2013-2020 (USD Million)
Table 44 Dome Labels Market Size, By Application, 2013-2020 (Million Square Meters)
Table 45 Other Automotive Labels Market Size, By Mechanism, 2013-2020 (USD Million)
Table 46 Other Automotive Labels Market Size, By Mechanism, 2013-2020 (Million Square Meters)
Table 47 Other Automotive Labels Market Size, By Identification Technology, 2013-2020 (USD Million)
Table 48 Other Automotive Labels Market Size, By Identification Technology, 2013-2020 (Million Square Meters)
Table 49 Other Automotive Labels Market Size, By Printing Technology, 2013-2020 (USD Million)
Table 50 Other Automotive Labels Market Size, By Printing Technology, 2013-2020 (Million Square Meters)
Table 51 Other Automotive Labels Market Size, By Application, 2013-2020 (USD Million)
Table 52 Other Automotive Labels Market Size, By Application, 2013-2020 (Million Square Meters)
Table 53 Automotive Labels Market Size, By Raw Material, 2013�2020 (USD Million)
Table 54 Automotive Labels Market Size, By Raw Material, 2013�2020 (Million Square Meters)
Table 55 PP Properties
Table 56 Polypropylene Market Size, By Type, 2013�2020 (USD Million)
Table 57 Polypropylene Market Size, By Type, 2013�2020 (Million Square Meters)
Table 58 Polypropylene Market Size, By Application, 2013�2020 (USD Million)
Table 59 Polypropylene Market Size, By Application, 2013�2020 (Million Square Meters)
Table 60 PE Properties
Table 61 Polyethylene Market Size, By Type, 2013�2020 (USD Million)
Table 62 Polyethylene Market Size, By Type, 2013�2020 (Million Square Meters)
Table 63 Polyethylene Market Size, By Application, 2013�2020 (USD Million)
Table 64 Polyethylene Market Size, By Application, 2013�2020 (Million Square Meters)
Table 65 PET Properties
Table 66 Polyethylene Terephthalate Market Size, By Type, 2013�2020 (USD Million)
Table 67 Polyethylene Terephthalate Market Size, By Type, 2013�2020 (Million Square Meters)
Table 68 Polyethylene Terephthalate Market Size, By Application, 2013�2020 (USD Million)
Table 69 Polyethylene Terephthalate Market Size, By Application, 2013�2020 (Million Square Meters)
Table 70 PVC Properties
Table 71 Polyvinyl Chloride Market Size, By Type, 2013�2020 (USD Million)
Table 72 Polyvinyl Chloride Market Size, By Type, 2013�2020 (Million Square Meters)
Table 73 Polyvinyl Chloride Market Size, By Application, 2013�2020 (USD Million)
Table 74 Polyvinyl Chloride Market Size, By Application, 2013�2020 (Million Square Meters)
Table 75 Polycarbonate Properties
Table 76 Polycarbonate Market Size, By Type, 2013�2020 (USD Million)
Table 77 Polycarbonate Market Size, By Type, 2013�2020 (Million Square Meters)
Table 78 Polycarbonate Market Size, By Application, 2013�2020 (USD Million)
Table 79 Polycarbonate Market Size, By Application, 2013�2020 (Million Square Meters)
Table 80 ABS Properties
Table 81 Acrylonitrile Butadiene Styrene Market Size, By Type, 2013�2020 (USD Million)
Table 82 Acrylonitrile Butadiene Styrene Market Size, By Type, 2013�2020 (Million Square Meters)
Table 83 Acrylonitrile Butadiene Styrene Market Size, By Application, 2013�2020 (USD Million)
Table 84 Acrylonitrile Butadiene Styrene Market Size, By Application, 2013�2020 (Million Square Meters)
Table 85 Polyurethane Properties
Table 86 Polyurethane Market Size, By Type, 2013�2020 (USD Million)
Table 87 Polyurethane Market Size, By Type, 2013�2020 (Million Square Meters)
Table 88 Polyurethane Market Size, By Application, 2013�2020 (USD Million)
Table 89 Polyurethane Market Size, By Application, 2013�2020 (Million Square Meters)
Table 90 Other Raw Materials Market Size, By Type, 2013�2020 (USD Million)
Table 91 Other Raw Materials Market Size, By Type, 2013�2020 (Million Square Meters)
Table 92 Other Raw Materials Market Size, By Application, 2013�2020 (USD Million)
Table 93 Other Raw Materials Market Size, By Application, 2013�2020 (Million Square Meters)
Table 94 Automotive Labels Market Size, By Identification Technology, 2013�2020 (USD Million)
Table 95 Automotive Labels Market Size, By Identification Technology, 2013�2020 (Million Square Meter)
Table 96 Automotive Labels Market Size, By Printing Technology, 2013�2020 (USD Million)
Table 97 Automotive Labels Market Size, By Printing Technology, 2013�2020 (Million Square Meters)
Table 98 Flexography Market Size, By Mechanism, 2013�2020 (USD Million)
Table 99 Flexography Market Size, By Mechanism, 2013�2020 (Million Square Meters)
Table 100 Offset Market Size, By Mechanism, 2013�2020 (USD Million)
Table 101 Offset Market Size, By Mechanism, 2013�2020 (Million Square Meters)
Table 102 Digital Printing Market Size, By Mechanism, 2013�2020 (USD Million)
Table 103 Digital Printing Market Size, By Mechanism, 2013�2020 (Million Square Meters)
Table 104 Screen Printing Market Size, By Mechanism, 2013�2020 (USD Million)
Table 105 Screen Printing Market Size, By Mechanism, 2013�2020 (Million Square Meters)
Table 106 Others Market Size, By Mechanism, 2013�2020 (USD Million)
Table 107 Others Market Size, By Mechanism, 2013�2020 (Million Square Meters)
Table 108 Automotive Labels Market Size, By Mechanism, 2013�2020 (USD Million)
Table 109 Automotive Labels Market Size, By Mechanism, 2013�2020 (Million Square Meters)
Table 110 Automotive Labels Market Size, By Application, 2013�2020 (USD Million)
Table 111 Automotive Labels Market Size, By Application, 2013�2020 (Million Square Meters)
Table 112 Exterior Labels Automotive Labels Market Size, By Mechanism, 2013�2020 (USD Million)
Table 113 Exterior Labels Automotive Labels Market Size, By Mechanism, 2013�2020 (Million Square Meters)
Table 114 Engine Components Automotive Labels Market Size, By Mechanism, 2013�2020 (USD Million)
Table 115 Engine Components Automotive Labels Market Size, By Mechanism, 2013�2020 (Million Square Meters)
Table 116 Interior Labels Automotive Labels Market Size, By Mechanism, 2013�2020 (USD Million)
Table 117 Interior Labels Automotive Labels Market Size, By Mechanism, 2013�2020 (Million Square Meters)
Table 118 Other Automotive Labels Market Size, By Mechanism, 2013�2020 (USD Million)
Table 119 Other Automotive Labels Market Size, By Mechanism, 2013�2020 (Million Square Meters)
Table 120 Automotive Labels Market Size, By Region, 2013-2020 (USD Million)
Table 121 Automotive Labels Market Size, By Region, 2013-2020 (Million Square Meters)
Table 122 North America: Automotive Labels Market Size, By Country, 2013-2020 (USD Million)
Table 123 North America: By Market Size, By Country, 2013-2020 (Million Square Meters)
Table 124 North America: By Market Size, By Raw Material, 2013-2020 (USD Million)
Table 125 North America: By Market Size, By Raw Material, 2013-2020 (Million Square Meters)
Table 126 North America: By Market Size, By Type, 2013-2020 (USD Million)
Table 127 North America: By Market Size, By Type, 2013-2020 (Million Square Meters)
Table 128 North America: By Market Size, By Mechanism, 2013-2020 (USD Million)
Table 129 North America: By Market Size, By Mechanism, 2013-2020 (Million Square Meters)
Table 130 North America: By Market Size, By Application, 2013-2020 (USD Million)
Table 131 North America: By Market Size, By Application, 2013-2020 (Million Square Meters)
Table 132 U.S.: Automotive Labels Market Size, By Raw Material, 2013-2020 (USD Million)
Table 133 U.S.: By Market Size, By Raw Material, 2013-2020 (Million Square Meters)
Table 134 U.S.: By Market Size, By Type, 2013-2020 (USD Million)
Table 135 U.S.: By Market Size, By Type, 2013-2020 (Million Square Meters)
Table 136 U.S.: By Market Size, By Mechanism, 2013-2020 (USD Million)
Table 137 U.S.: By Market Size, By Mechanism, 2013-2020 (Million Square Meters)
Table 138 U.S.: By Market Size, By Application, 2013-2020 (USD Million)
Table 139 U.S.: By Market Size, By Application, 2013-2020 (Million Square Meters)
Table 140 Canada: Automotive Labels Market Size, By Raw Material, 2013-2020 (USD Million)
Table 141 Canada: By Market Size, By Raw Material, 2013-2020 (Million Square Meters)
Table 142 Canada: By Market Size, By Type, 2013-2020 (USD Million)
Table 143 Canada: By Market Size, By Type, 2013-2020 (Million Square Meters)
Table 144 Canada: By Market Size, By Mechanism, 2013-2020 (USD Million)
Table 145 Canada: By Market Size, By Mechanism, 2013-2020 (Million Square Meters)
Table 146 Canada: By Market Size, By Application, 2013-2020 (USD Million)
Table 147 Canada: By Market Size, By Application, 2013-2020 (Million Square Meters)
Table 148 Mexico: Automotive Labels Market Size, By Raw Material, 2013-2020 (USD Million)
Table 149 Mexico: By Market Size, By Raw Material, 2013-2020 (Million Square Meters)
Table 150 Mexico: By Market Size, By Type, 2013-2020 (USD Million)
Table 151 Mexico: By Market Size, By Type, 2013-2020 (Million Square Meters)
Table 152 Mexico: By Market Size, By Mechanism, 2013-2020 (USD Million)
Table 153 Mexico: By Market Size, By Mechanism, 2013-2020 (Million Square Meters)
Table 154 Mexico: By Market Size, By Application, 2013-2020 (USD Million)
Table 155 Mexico: By Market Size, By Application, 2013-2020 (Million Square Meters)
Table 156 Europe: Automotive Labels Market Size, By Country, 2013-2020 (USD Million)
Table 157 Europe: Automotive Labels Market Size, By Country, 2013-2020 (Million Square Meters)
Table 158 Europe: Automotive Labels Market Size, By Raw Material, 2013-2020 (USD Million)
Table 159 Europe: Automotive Labels Market Size, By Raw Material, 2013-2020 (Million Square Meters)
Table 160 Europe: Automotive Labels Market Size, By Type, 2013-2020 (USD Million)
Table 161 Europe: Automotive Labels Market Size, By Type, 2013-2020 (Million Square Meters)
Table 162 Europe: Automotive Labels Market Size, By Mechanism, 2013-2020 (USD Million)
Table 163 Europe: Automotive Labels Market Size, By Mechanism, 2013-2020 (Million Square Meters)
Table 164 Europe: Automotive Labels Market Size, By Application, 2013-2020 (USD Million)
Table 165 Europe: Automotive Labels Market Size, By Application, 2013-2020 (Million Square Meters)
Table 166 U.K.: Automotive Labels Market Size, By Raw Material, 2013-2020 (USD Million)
Table 167 U.K.: Automotive Labels Market Size, By Raw Material, 2013-2020 (Million Square Meters)
Table 168 U.K.: Automotive Labels Market Size, By Type, 2013-2020 (USD Million)
Table 169 U.K.: Automotive Labels Market Size, By Type, 2013-2020 (Million Square Meters)
Table 170 U.K.: Automotive Labels Market Size, By Mechanism, 2013-2020 (USD Million)
Table 171 U.K.: Automotive Labels Market Size, By Mechanism, 2013-2020 (Million Square Meters)
Table 172 U.K.: Automotive Labels Market Size, By Application, 2013-2020 (USD Million)
Table 173 U.K.: Automotive Labels Market Size, By Application, 2013-2020 (Million Square Meters)
Table 174 Germany: Automotive Labels Market Size, By Raw Material, 2013-2020 (USD Million)
Table 175 Germany: Automotive Labels Market Size, By Raw Material, 2013-2020 (Million Square Meters)
Table 176 Germany: Automotive Labels Market Size, By Type, 2013-2020 (USD Million)
Table 177 Germany: Automotive Labels Market Size, By Type, 2013-2020 (Million Square Meters)
Table 178 Germany: Automotive Labels Market Size, By Mechanism, 2013-2020 (USD Million)
Table 179 Germany: Automotive Labels Market Size, By Mechanism, 2013-2020 (Million Square Meters)
Table 180 Germany: Automotive Labels Market Size, By Application, 2013-2020 (USD Million)
Table 181 Germany: Automotive Labels Market Size, By Application, 2013-2020 (Million Square Meters)
Table 182 France: Automotive Labels Market Size, By Raw Material, 2013-2020 (USD Million)
Table 183 France: Automotive Labels Market Size, By Raw Material, 2013-2020 (Million Square Meters)
Table 184 France: Automotive Labels Market Size, By Type, 2013-2020 (USD Million)
Table 185 France: Automotive Labels Market Size, By Type, 2013-2020 (Million Square Meters)
Table 186 France: Automotive Labels Market Size, By Mechanism, 2013-2020 (USD Million)
Table 187 France: Automotive Labels Market Size, By Mechanism, 2013-2020 (Million Square Meters)
Table 188 France: Automotive Labels Market Size, By Application, 2013-2020 (USD Million)
Table 189 France: Automotive Labels Market Size, By Application, 2013-2020 (Million Square Meters)
Table 190 Spain: Automotive Labels Market Size, By Raw Material, 2013-2020 (USD Million)
Table 191 Spain: Automotive Labels Market Size, By Raw Material, 2013-2020 (Million Square Meters)
Table 192 Spain: Automotive Labels Market Size, By Type, 2013-2020 (USD Million)
Table 193 Spain: Automotive Labels Market Size, By Type, 2013-2020 (Million Square Meters)
Table 194 Spain: Automotive Labels Market Size, By Mechanism, 2013-2020 (USD Million)
Table 195 Spain: Automotive Labels Market Size, By Mechanism, 2013-2020 (Million Square Meters)
Table 196 Spain: Automotive Labels Market Size, By Application, 2013-2020 (USD Million)
Table 197 Spain: Automotive Labels Market Size, By Application, 2013-2020 (Million Square Meters)
Table 198 Czech Republic: Automotive Labels Market Size, By Raw Material, 2013-2020 (USD Million)
Table 199 Czech Republic: Automotive Labels Market Size, By Raw Material, 2013-2020 (Million Square Meters)
Table 200 Czech Republic: Automotive Labels Market Size, By Type, 2013-2020 (USD Million)
Table 201 Czech Republic: Automotive Labels Market Size, By Type, 2013-2020 (Million Square Meters)
Table 202 Czech Republic: Automotive Labels Market Size, By Mechanism, 2013-2020 (USD Million)
Table 203 Czech Republic: Automotive Labels Market Size, By Mechanism, 2013-2020 (Million Square Meters)
Table 204 Czech Republic: Automotive Labels Market Size, By Application, 2013-2020 (USD Million)
Table 205 Czech Republic: Automotive Labels Market Size, By Application, 2013-2020 (Million Square Meters)
Table 206 Rest of Europe: Automotive Labels Market Size, By Raw Material, 2013-2020 (USD Million)
Table 207 Rest of Europe: Automotive Labels Market Size, By Raw Material, 2013-2020 (Million Square Meters)
Table 208 Rest of Europe: Automotive Labels Market Size, By Type, 2013-2020 (USD Million)
Table 209 Rest of Europe: Automotive Labels Market Size, By Type, 2013-2020 (Million Square Meters)
Table 210 Rest of Europe: Automotive Labels Market Size, By Mechanism, 2013-2020 (USD Million)
Table 211 Rest of Europe: Automotive Labels Market Size, By Mechanism, 2013-2020 (Million Square Meters)
Table 212 Rest of Europe: Automotive Labels Market Size, By Application, 2013-2020 (USD Million)
Table 213 Rest of Europe: Automotive Labels Market Size, By Application, 2013-2020 (Million Square Meters)
Table 214 Asia-Pacific: Automotive Labels Market Size, By Country, 2013-2020 (USD Million)
Table 215 Asia-Pacific: Automotive Labels Market Size, By Country, 2013-2020 (Million Square Meters)
Table 216 Asia-Pacific: Automotive Labels Market Size, By Raw Material, 2013-2020 (USD Million)
Table 217 Asia-Pacific: Automotive Labels Market Size, By Raw Material, 2013-2020 (Million Square Meters)
Table 218 Asia-Pacific: Automotive Labels Market Size, By Type, 2013-2020 (USD Million)
Table 219 Asia-Pacific: Automotive Labels Market Size, By Type, 2013-2020 (Million Square Meters)
Table 220 Asia-Pacific: Automotive Labels Market Size, By Mechanism, 2013-2020 (USD Million)
Table 221 Asia-Pacific: Automotive Labels Market Size, By Mechanism, 2013-2020 (Million Square Meters)
Table 222 Asia-Pacific: Automotive Labels Market Size, By Application, 2013-2020 (USD Million)
Table 223 Asia-Pacific: Automotive Labels Market Size, By Application, 2013-2020 (Million Square Meters)
Table 224 China: Automotive Labels Market Size, By Raw Material, 2013-2020 (USD Million)
Table 225 China: Automotive Labels Market Size, By Raw Material, 2013-2020 (Million Square Meters)
Table 226 China: Automotive Labels Market Size, By Type, 2013-2020 (USD Million)
Table 227 China: Automotive Labels Market Size, By Type, 2013-2020 (Million Square Meters)
Table 228 China: Automotive Labels Market Size, By Mechanism, 2013-2020 (USD Million)
Table 229 China: Automotive Labels Market Size, By Mechanism, 2013-2020 (Million Square Meters)
Table 230 China: Automotive Labels Market Size, By Application, 2013-2020 (USD Million)
Table 231 China: Automotive Labels Market Size, By Application, 2013-2020 (Million Square Meters)
Table 232 India: Automotive Labels Market Size, By Raw Material, 2013-2020 (USD Million)
Table 233 India: Automotive Labels Market Size, By Raw Material, 2013-2020 (Million Square Meters)
Table 234 India: Automotive Labels Market Size, By Type, 2013-2020 (USD Million)
Table 235 India: Automotive Labels Market Size, By Type, 2013-2020 (Million Square Meters)
Table 236 India: Automotive Labels Market Size, By Mechanism, 2013-2020 (USD Million)
Table 237 India: Automotive Labels Market Size, By Mechanism, 2013-2020 (Million Square Meters)
Table 238 India: Automotive Labels Market Size, By Application, 2013-2020 (USD Million)
Table 239 India: Automotive Labels Market Size, By Application, 2013-2020 (Million Square Meters)
Table 240 Japan: Automotive Labels Market Size, By Raw Material, 2013-2020 (USD Million)
Table 241 Japan: Automotive Labels Market Size, By Raw Material, 2013-2020 (Million Square Meters)
Table 242 Japan: Automotive Labels Market Size, By Type, 2013-2020 (USD Million)
Table 243 Japan: Automotive Labels Market Size, By Type, 2013-2020 (Million Square Meters)
Table 244 Japan: Automotive Labels Market Size, By Mechanism, 2013-2020 (USD Million)
Table 245 Japan: Automotive Labels Market Size, By Mechanism, 2013-2020 (Million Square Meters)
Table 246 Japan: Automotive Labels Market Size, By Application, 2013-2020 (USD Million)
Table 247 Japan: Automotive Labels Market Size, By Application, 2013-2020 (Million Square Meters)
Table 248 South Korea: Automotive Labels Market Size, By Raw Material, 2013-2020 (USD Million)
Table 249 South Korea: Automotive Labels Market Size, By Raw Material, 2013-2020 (Million Square Meters)
Table 250 South Korea: Automotive Labels Market Size, By Type, 2013-2020 (USD Million)
Table 251 South Korea: Automotive Labels Market Size, By Type, 2013-2020 (Million Square Meters)
Table 252 South Korea: Automotive Labels Market Size, By Mechanism, 2013-2020 (USD Million)
Table 253 South Korea: Automotive Labels Market Size, By Mechanism, 2013-2020 (Million Square Meters)
Table 254 South Korea: Automotive Labels Market Size, By Application, 2013-2020 (USD Million)
Table 255 South Korea: Automotive Labels Market Size, By Application, 2013-2020 (Million Square Meters)
Table 256 Rest of Asia-Pacific: Automotive Labels Market Size, By Raw Material, 2013-2020 (USD Million)
Table 257 Rest of Asia-Pacific: Automotive Labels Market Size, By Raw Material, 2013-2020 (Million Square Meters)
Table 258 Rest of Asia-Pacific: Automotive Labels Market Size, By Type, 2013-2020 (USD Million)
Table 259 Rest of Asia-Pacific: Automotive Labels Market Size, By Type, 2013-2020 (Million Square Meters)
Table 260 Rest of Asia-Pacific: Automotive Labels Market Size, By Mechanism, 2013-2020 (USD Million)
Table 261 Rest of Asia-Pacific: Automotive Labels Market Size, By Mechanism, 2013-2020 (Million Square Meters)
Table 262 Rest of Asia-Pacific: Automotive Labels Market Size, By Application, 2013-2020 (USD Million)
Table 263 Rest of Asia-Pacific: Automotive Labels Market Size, By Application, 2013-2020 (Million Square Meters)
Table 264 RoW: Automotive Labels Market Size, By Country, 2013-2020 (USD Million)
Table 265 RoW: Automotive Labels Market Size, By Country, 2013-2020 (Million Square Meters)
Table 266 RoW: Automotive Labels Market Size, By Raw Material, 2013-2020 (USD Million)
Table 267 RoW: Automotive Labels Market Size, By Raw Material, 2013-2020 (Million Square Meters)
Table 268 RoW: Automotive Labels Market Size, By Type, 2013-2020 (USD Million)
Table 269 RoW: Automotive Labels Market Size, By Type, 2013-2020 (Million Square Meters)
Table 270 RoW: Automotive Labels Market Size, By Mechanism, 2013-2020 (USD Million)
Table 271 RoW: Automotive Labels Market Size, By Mechanism, 2013-2020 (Million Square Meters)
Table 272 RoW: Automotive Labels Market Size, By Application, 2013-2020 (USD Million)
Table 273 RoW: Automotive Labels Market Size, By Application, 2013-2020 (Million Square Meters)
Table 274 Brazil: Automotive Labels Market Size, By Raw Material, 2013-2020 (USD Million)
Table 275 Brazil: Automotive Labels Market Size, By Raw Material, 2013-2020 (Million Square Meters)
Table 276 Brazil: Automotive Labels Market Size, By Type, 2013-2020 (USD Million)
Table 277 Brazil: Automotive Labels Market Size, By Type, 2013-2020 (Million Square Meters)
Table 278 Brazil: Automotive Labels Market Size, By Mechanism, 2013-2020 (USD Million)
Table 279 Brazil: Automotive Labels Market Size, By Mechanism, 2013-2020 (Million Square Meters)
Table 280 Brazil: Automotive Labels Market Size, By Application, 2013-2020 (USD Million)
Table 281 Brazil: Automotive Labels Market Size, By Application, 2013-2020 (Million Square Meters)
Table 282 South Africa: Automotive Labels Market Size, By Raw Material, 2013-2020 (USD Million)
Table 283 South Africa: Automotive Labels Market Size, By Raw Material, 2013-2020 (Million Square Meters)
Table 284 South Africa: Automotive Labels Market Size, By Type, 2013-2020 (USD Million)
Table 285 South Africa: Automotive Labels Market Size, By Type, 2013-2020 (Million Square Meters)
Table 286 South Africa: Automotive Labels Market Size, By Mechanism, 2013-2020 (USD Million)
Table 287 South Africa: Automotive Labels Market Size, By Mechanism, 2013-2020 (Million Square Meters)
Table 288 South Africa: Automotive Labels Market Size, By Application, 2013-2020 (USD Million)
Table 289 South Africa: Automotive Labels Market Size, By Application, 2013-2020 (Million Square Meters)
Table 290 Argentina: Automotive Labels Market Size, By Raw Material, 2013-2020 (USD Million)
Table 291 Argentina: Automotive Labels Market Size, By Raw Material, 2013-2020 (Million Square Meters
Table 292 Argentina: Automotive Labels Market Size, By Type, 2013-2020 (USD Million)
Table 293 Argentina: Automotive Labels Market Size, By Type, 2013-2020 (Million Square Meters)
Table 294 Argentina: Automotive Labels Market Size, By Mechanism, 2013-2020 (USD Million)
Table 295 Argentina: Automotive Labels Market Size, By Mechanism, 2013-2020 (Million Square Meters)
Table 296 Argentina: Automotive Labels Market Size, By Application, 2013-2020 (USD Million)
Table 297 Argentina: Automotive Labels Market Size, By Application, 2013-2020 (Million Square Meters)
Table 298 Others in RoW: Automotive Labels Market Size, By Raw Material, 2013-2020 (USD Million)
Table 299 Others in RoW: Automotive Labels Market Size, By Raw Material, 2013-2020 (Million Square Meters)
Table 300 Others in RoW: Automotive Labels Market Size, By Type, 2013-2020 (USD Million)
Table 301 Others in RoW: Automotive Labels Market Size, By Type, 2013-2020 (Million Square Meters)
Table 302 Others in RoW: Automotive Labels Market Size, By Mechanism, 2013-2020 (USD Million)
Table 303 Others in RoW: Automotive Labels Market Size, By Mechanism, 2013-2020 (Million Square Meters)
Table 304 Others in RoW: Automotive Labels Market Size, By Application, 2013-2020 (USD Million)
Table 305 Others in RoW: Automotive Labels Market Size, By Application, 2013-2020 (Million Square Meters)
Table 306 New Product Developments, 2011�2015
Table 307 Investments & Expansions, 2011-2015
Table 308 Acquisitions, 2012-2015
Table 309 Agreement, 2015
List of Figures (57 Figures)
Figure 1 Automotive Labels Market Segmentation
Figure 2 Automotive Labels Market: Research Design
Figure 3 Breakdown of Primary Interviews: By Company Type, Designation & Region
Figure 4 Market Size Estimation Methodology: Bottom-Up Approach
Figure 5 Market Size Estimation Methodology: Top-Down Approach
Figure 6 Data Triangulation Methodology
Figure 7 Limitations of the Research Study
Figure 8 Flexography Printing Technology is Projected to Be the Leader in the Automotive Labels Market During the Forecast Period
Figure 9 Automotive Labels Market Snapshot (2015 vs 2020): Market for Barcode Identification Technology to Grow at the Highest CAGR During the Forecast Period
Figure 10 Asia-Pacific is the Fastest-Growing Automotive Labels Market
Figure 11 Leading Market Players Adopted New Product Development as the Key Strategy During 2011-2015
Figure 12 Attractive Market Opportunities in the Automotive Labels Market
Figure 13 Automotive Labels Market Share, By Country
Figure 14 Asset Labels to Dominate the Automotive Labels Market Through 2020
Figure 15 Automotive Labels Market, By Region, 2015�2020 (USD Billion)
Figure 16 Automotive Labels Market Size, By Major Country, 2015-2020 (USD Million)
Figure 17 Automotive Labels Market Share (Value), By Application, 2020
Figure 18 Automotive Labels Market Share (Value), By Material, 2020
Figure 19 Asia-Pacific Region is the Fastest-Growing Market
Figure 20 Evolution of Automotive Labels Market
Figure 21 Automotive Labels Market Segmentation
Figure 22 Market Dynamics of Automotive Labels
Figure 23 Automotive Labels Value Chain
Figure 24 Porter�s Five Forces Analysis
Figure 25 Asset Labels are Projected to Dominate the Market During the Forecast Period
Figure 26 Automotive Labels Market Size, By Raw Material, 2015�2020 (USD Million)
Figure 27 Automotive Labels Market Size, By Identification Technology, 2014
Figure 28 Automotive Labels Market Size, By Printing Technology, 2014 (USD Million)
Figure 29 Pressure-Sensitive Mechanism Dominated the Automotive Labels Market, in Terms of Value, in 2014
Figure 30 Automotive Labels Market Size, By Application, 2013 & 2020 (USD Million)
Figure 31 Geographical Snapshot: Automotive Labels Market Growth Rate, 2015-2020
Figure 32 Market Snapshot: North America
Figure 33 U.S. Capital Investment in Automotive Sector, 2009-2014 (USD Billion)
Figure 34 Europe: Automotive Labels Market Share (Value), By Country, 2014
Figure 35 Consumption of Small Utility & Passenger Cars
Figure 36 Asia-Pacific: Market Snapshot
Figure 37 Vehicle Sales in China 2014
Figure 38 Vehicle Sales in India 2014
Figure 39 Competitive Landscape of Major Automotive Brands in Japan, 2015
Figure 40 Companies Adopted New Product Developments as Their Key Growth Strategy From 2011 to 2015
Figure 41 CCL Industries Grew at the Highest Rate From 2011 to 2014
Figure 42 New Product Developments: the Key Growth Strategy
Figure 43 2015 Observed to Be the Most Active Year in Terms of Developments for the Automotive Labels Market
Figure 44 Geographic Revenue Mix of Top Five Market Players
Figure 45 3M: Company Snapshot
Figure 46 3M: SWOT Analysis
Figure 47 UPM Raflatac: Company Snapshot
Figure 48 UPM Raflatac: SWOT Analysis
Figure 49 Avery Dennison Corporation: Company Snapshot
Figure 50 Avery Dennison Corporation: SWOT Analysis
Figure 51 Sika AG: Company Snapshot
Figure 52 Sika AG: SWOT Analysis
Figure 53 CCL Industries, Inc.: Company Snapshot
Figure 54 CCL Industries Inc.: SWOT Analysis
Figure 55 H.B. Fuller: Company Snapshot
Figure 56 Marketsandmarkets Knowledge Store Snapshot
Figure 57 Marketsandmarkets Knowledge Store: Packaging Industry Snapshot


Growth opportunities and latent adjacency in Automotive Labels Market