Biologics Safety Testing Market

Biologics Safety Testing Market Size by Product & Service (Instruments, Consumables, Services), Application (mAbs, Vaccine, Cell & Gene Therapy), Test Type (Sterility Test, Endotoxin, Mycoplasma, Bioburden), End User (Biopharma, CDMO) & Region - Global Forecast to 2027

Report Code: BT 3334 Jan, 2023, by marketsandmarkets.com

The size of global biologics safety testing market in terms of revenue was estimated to be worth $3.6 billion in 2022 and is poised to reach $6.8 billion by 2027, growing at a CAGR of 13.3% from 2022 to 2027. The research study consists of an industry trend analysis, pricing analysis, patent analysis, conference and webinar materials, key stakeholders, and buying behaviour in the market.

The growth of the global market is driven by factors such as the growing development of biologics and biosimilars, growing concerns over cell culture contamination, and rising biopharmaceutical R&D investments. Additionally, emerging markets and increasing outsourcing of biopharmaceutical activities to CROs are expected to provide significant growth opportunities for players in the market. However, a shortage of skilled professionals is expected to limit the growth of this market to a certain extent during the forecast period.

Global Biologic Safety Testing Market Trend

Biologics Safety Testing Market

To know about the assumptions considered for the study, Request for Free Sample Report

Biologics Safety Testing Market Dynamics

Driver: Rising investment in biopharmaceutical R&D

Over the years, the prevalence of chronic diseases, such as cancer, diabetes, and neurological and cardiovascular diseases, has increased rapidly worldwide. The research and demand for various drugs, cell therapies, diagnostics, and active biological products are expected to grow due to the increasing incidence and prevalence of such diseases. Considering the regulatory mandates of testing, every biological sample during R&D would be tested for the presence & elimination of various contaminants (such as mycoplasma, endotoxins, and viruses), thereby driving the uptake of biologics safety testing products and services. The growing R&D expenditure by pharmaceutical & biotechnology companies, coupled with the increasing focus on life science projects for developing new therapeutic and diagnostic products, is expected to drive the growth of the overall market.

Opportunity: Increased outsourcing of biopharmaceutical activities to CROs

Contract research organizations (CROs) act as outsourcing partners for pharmaceutical & biotechnology companies and academic institutes. CROs provide several services, such as cell and virus bank characterization, genetic stability testing, raw material testing, bulk-lot release testing, final product release testing, sterility testing services, analytical services for biologics, biodistribution studies, cell-based assay services, cleaning validation studies, biorepository services, next-generation sequencing, and endotoxin determination. Several pharmaceutical & biotechnology companies and academic institutes opt to outsource numerous core functions like manufacturing, clinical trial management, and portions of drug discovery to CROs as the emergence of new technologies have made it unfeasible for companies to undertake all testing functions in-house.

Moreover, CROs can afford to invest in extensive drug discovery infrastructure as they cater to multiple clients. This makes investing in advanced techniques, such as rapid mycoplasma tests and fully automated robotic systems for endotoxin detection, a cost-effective option for CROs. With the increasing outsourcing of various functions to CROs, pharmaceutical and biotechnology companies can reduce their operational costs and R&D budgets. Cost savings, commercial sustainability, and optimal staffing are key advantages driving the outsourcing of safety testing services for large companies. The expanding pipelines of pharmaceutical & biopharmaceutical companies are further expected to drive the outsourcing of biologics safety testing to CROs.

Challenge: High Cost of Biologics

Biologics and biosimilars are medications made from living cells to treat various ailments such as cancer, diabetes, rheumatoid arthritis, and other inflammatory diseases. Biologics are extremely targeted and effective for treating various diseases. However, the manufacturing process of biologics is extremely tedious and requires a lot of R&D expenditure. Biologics are manufactured using various natural sources from living organisms, animals, and humans. The final drug comprises proteins, sugar, DNA, and living cells, an extremely complex manufacturing process. The average cost of biologics drugs treatment ranges from USD 10,000 to 30,000 per year and can exceed USD 500,000 for the most expensive biologics. The cost of biologics is much higher when compared to other drugs like conventional DMARDs, which have been chemically synthesized. The high cost of biologics negatively impacts market growth by reducing the manufacturing requirements and demand in the highly price-sensitive market.

By product & service segment, the consumables segment accounted for the second largest share of the biologics safety testing industry in 2021.

Based on product and service, the biologics safety testing market is segmented into consumables, services, and instruments. In 2021, the consumables segment accounted for the second largest market share. This segment comprises the assays, kits, and reagents used for testing/detection and elimination of various contaminants (viruses, bacteria, fungi, mycoplasma, and toxins, among others) in test samples. Assays, kits, and reagents are used in various biologics safety testing applications, such as process & product validation, process monitoring and quality control, raw material testing, bulk lot release testing, and final product release testing. Kits are widely used in biopharmaceutical companies primarily due to ease of use, long shelf life, and the premeasured nature of the components of these kits. The reagents market is experiencing growth due to the growing applications of biosciences and biotechnology within pharmaceutical and healthcare.

By test type, the mycoplasma tests segment accounted for the second largest share of the biologics safety testing industry in 2021.

Based on test type, the biologics safety testing market is segmented into residual host-cell proteins and DNA detection tests, endotoxin tests, sterility tests, mycoplasma tests, bioburden tests, virus safety tests, and other biologics safety testing. In 2021, the mycoplasma tests segment accounted for the second largest market share. Mycoplasma detection and removal are critical for biologics produced for clinical studies and licensed products for human use. The testing is complicated, as microbes have different and often fastidious requirements for growth. These are the major factors driving the growth of this segment.

By application, the vaccine development and manufacturing segment registered for the highest CAGR of the biologics safety testing industry in 2021.

Based on application, the biologics safety testing market is segmented into monoclonal antibodies development and manufacturing, vaccines development and manufacturing, blood and blood products development and manufacturing, cellular and gene therapy products development and manufacturing, and other applications. In 2021, the vaccine development and manufacturing segment registered the highest CAGR. Vaccine development and manufacturing is expected to grow at the highest rate due to the growing number of infectious diseases; and the necessity of biologics safety testing for quality assurance measure to ensure patient safety.

North America accounted for the largest share of the biologics safety testing industry in 2021.

North America accounted for the largest share of the biologics safety testing market in 2021. Fast paced growth in the biopharmaceutical industry is the major factor driving the growth of the North American market. This region is also witnessing an increase in the development of structure-based drug designs, growing academic & government investments, rising demand for high-quality research tools for data reproducibility, and growing consumer awareness of product safety. Such factors are expected to drive market growth for biologics safety testing in the coming years.

Biologics Safety Testing Market by Region

To know about the assumptions considered for the study, download the pdf brochure

Prominent players in the biologics safety testing market are Charles River Laboratories, Inc. (US), Lonza (Switzerland), Thermo Fisher Scientific, Inc. (US), Merck KGaA (Germany), SGS SA (Switzerland), WuXi AppTec (China), Labcorp (US), and Eurofins Scientific (Luxembourg). The key players in this market are focusing on strategic expansions, partnerships, and product & service launches to expand their presence in the market.

Scope of the Biologics Safety Testing Industry:

Report Metric

Details

Market Revenue Size in 2022

$3.6 billion

Projected Revenue Size by 2027

$6.8 billion

Industry Growth Rate

Poised to Grow at a CAGR of 13.3%

Market Driver

Rising investment in biopharmaceutical R&D

Market Opportunity

Increased outsourcing of biopharmaceutical activities to CROs

The study categorizes the biologics safety testing market to forecast revenue and analyze trends in each of the following submarkets:

By Product & Services
  • Consumables
  • Instrument
  • Services
By Application
  • Vaccine Development and Manufacturing
  • Monoclonal Antibodies Development and Manufacturing
  • Cellular & Gene Therapy Products Development and Manufacturing
  • Blood and Blood Products Development and Manufacturing
  • Other Application
By Test Type
  • Endotoxin Test
  • Sterility Test
  • Mycoplasma Tests
  • Bioburden Tests
  • Residual Host-cell Proteins & DNA Detection Tests
  • Virus safety Test
  • Other Biologics safety Tests
By Region
  • North America
    • US
    • Canada
  • Europe
    • UK
    • Germany
    • France
    • Italy
    • Spain
    • Rest of Europe
  • Asia Pacific
    • China
    • Japan
    • India
    • Rest of Asia Pacific
  • Latin America
  • The Middle East and Africa

Recent Developments of Biologics Safety Testing Industry:

  • In November 2022, Merck KGaA (Germany) invested in expanding its biosafety testing capacity at Rockville, Maryland, US. This site will provide biosafety testing and analytical development services in the US.
  • In July 2022, Eurofins Scientific (Luxembourg) acquired Wessling Hungary, a food, environmental, and BioPharma product testing laboratory in Hungary. This acquisition helped expand Eurofins' biopharma testing business in Europe.
  • In June 2022, Lonza (Switzerland) launched the PyroCell Monocyte Activation Test to detect non-endotoxin pyrogens and reduce interferences from complex drug products, such as biologics-based pharmaceuticals.
  • In March 2021 Charles River Laboratories, Inc. (US) launched a new detection tool, EndoScan-V, a validated endotoxin detection and measurement software used to generate and report quantitative test data. The software performed the requisite measurements and calculations and created test reports with the convenience of digital signature report approval.
  • In January 2021, Charles River Laboratories, Inc. (US) partnered with JADE Biomedical to expand its biological testing solutions capabilities geographically and cater to the increasing demand for biologics therapeutics, especially cell and gene therapies. This strategic relationship enabled JADE to expand its current global Good Manufacturing Practice (GMP) product testing operations in Shanghai into a second facility and further build upon its current offering of comprehensive biologics quality management and testing services.

Frequently Asked Questions (FAQ):

To speak to our analyst for a discussion on the above findings, click Speak to Analyst

TABLE OF CONTENTS
 
1 INTRODUCTION (Page No. - 30)
    1.1 STUDY OBJECTIVES 
    1.2 MARKET DEFINITION 
           1.2.1 INCLUSIONS AND EXCLUSIONS
           1.2.2 MARKETS COVERED
                    FIGURE 1 BIOLOGICS SAFETY TESTING MARKET SEGMENTATION
           1.2.3 YEARS CONSIDERED
    1.3 CURRENCY CONSIDERED 
    1.4 LIMITATIONS 
    1.5 STAKEHOLDERS 
    1.6 SUMMARY OF CHANGES 
 
2 RESEARCH METHODOLOGY (Page No. - 35)
    2.1 RESEARCH APPROACH 
          FIGURE 2 RESEARCH DESIGN
           2.1.1 SECONDARY DATA
           2.1.2 PRIMARY DATA
                    FIGURE 3 BREAKDOWN OF PRIMARIES: BIOLOGICS SAFETY TESTING INDUSTRY
           2.1.3 DATA TRIANGULATION APPROACH
    2.2 DATA TRIANGULATION 
          FIGURE 4 DATA TRIANGULATION METHODOLOGY
    2.3 MARKET ESTIMATION METHODOLOGY 
          FIGURE 5 MARKET SIZE ESTIMATION: COMPANY REVENUE ANALYSIS-BASED ESTIMATION
          FIGURE 6 MARKET SIZE ESTIMATION: SEGMENTAL ANALYSIS-BASED ESTIMATION
          FIGURE 7 MARKET: FINAL CAGR PROJECTION (2022−2027)
          FIGURE 8 BIOLOGICS SAFETY TESTING: CAGR PROJECTION FROM ANALYSIS OF DRIVERS, RESTRAINTS, OPPORTUNITIES, AND CHALLENGES
    2.4 INDUSTRY INSIGHTS 
    2.5 RESEARCH ASSUMPTIONS 
    2.6 RECESSION IMPACT 
          TABLE 1 GLOBAL INFLATION RATE PROJECTION, 2024−2027 (% GROWTH)
 
3 EXECUTIVE SUMMARY (Page No. - 44)
    FIGURE 9 BIOLOGICS SAFETY TESTING MARKET SHARE, BY PRODUCT & SERVICE (2021)
    FIGURE 10 BIOLOGICS SAFETY TESTING INDUSTRY SIZE, BY APPLICATION, 2022 VS. 2027 (USD MILLION)
    FIGURE 11 MARKET SIZE, BY TEST TYPE, 2022 VS. 2027 (USD MILLION)
    FIGURE 12 MARKET SIZE: GEOGRAPHICAL GROWTH OPPORTUNITIES
 
4 PREMIUM INSIGHTS (Page No. - 48)
    4.1 BIOLOGICS SAFETY TESTING MARKET OVERVIEW 
          FIGURE 13 RISING DEVELOPMENT OF BIOLOGICS AND BIOSIMILARS TO DRIVE MARKET
    4.2 NORTH AMERICA: BIOLOGICS SAFETY TESTING INDUSTRY SIZE, BY APPLICATION AND COUNTRY (2021) 
          FIGURE 14 MONOCLONAL ANTIBODIES MANUFACTURING SEGMENT ACCOUNTED FOR LARGEST SHARE IN 2021
    4.3 MARKET SHARE, BY TEST TYPE 
          FIGURE 15 RESIDUAL HOST-CELL PROTEINS AND DNA DETECTION TESTS SEGMENT TO REGISTER HIGHEST CAGR DURING FORECAST PERIOD
 
5 MARKET OVERVIEW (Page No. - 51)
    5.1 MARKET DYNAMICS 
          FIGURE 16 BIOLOGICS SAFETY TESTING MARKET SHARE: DRIVERS, RESTRAINTS, OPPORTUNITIES, AND CHALLENGES
           5.1.1 DRIVERS
                    5.1.1.1 Growing development of biosimilars and biologics
                                TABLE 2 LIST OF BIOLOGICAL LICENSE APPLICATION APPROVALS IN US, 2021
                                TABLE 3 LIST OF BIOLOGICS APPROVED BY US FDA (2021)
                    5.1.1.2 Growing concerns over cell culture contamination
                    5.1.1.3 Rising investments in biopharmaceutical R&D
                                TABLE 4 PHARMACEUTICAL R&D SPENDING, BY COMPANY, 2020 VS. 2026 (USD BILLION)
                                FIGURE 17 PHARMACEUTICAL & BIOPHARMACEUTICAL R&D EXPENDITURE, 2017–2024
           5.1.2 RESTRAINTS
                    5.1.2.1 Shortage of skilled professionals
           5.1.3 OPPORTUNITIES
                    5.1.3.1 Emerging markets
                    5.1.3.2 Increasing outsourcing of biopharmaceutical activities to CROs
           5.1.4 CHALLENGES
                    5.1.4.1 High cost of biologics
    5.2 PRICING ANALYSIS 
          TABLE 5 AVERAGE SELLING PRICE OF BIOLOGICS SAFETY TESTING PRODUCTS (2020-2021)
           5.2.1 PRICING TREND ANALYSIS
    5.3 VALUE CHAIN ANALYSIS 
          FIGURE 18 BIOLOGICS SAFETY TESTING INDUSTRY: VALUE CHAIN ANALYSIS
    5.4 ECOSYSTEM ANALYSIS 
          FIGURE 19 MARKET SHARE: ECOSYSTEM ANALYSIS
    5.5 TRENDS/DISRUPTIONS IMPACTING CUSTOMERS' BUSINESSES 
          FIGURE 20 REVENUE SHIFT FOR BIOLOGICS SAFETY TESTING PROVIDERS
    5.6 PATENT ANALYSIS 
          FIGURE 21 TOP APPLICANTS & OWNERS (COMPANIES/INSTITUTIONS) FOR BIOLOGICS SAFETY PATENTS (JANUARY 2012−NOVEMBER 2022)
          TABLE 6 MARKET SHARE: INDICATIVE LIST OF PATENTS
    5.7 REGULATORY ANALYSIS 
           5.7.1 US
           5.7.2 EUROPE
           5.7.3 ASIA PACIFIC
           5.7.4 LATIN AMERICA
           5.7.5 MIDDLE EAST AND AFRICA
           5.7.6 REGULATORY BODIES, GOVERNMENT AGENCIES, AND OTHER ORGANIZATIONS
                    TABLE 7 NORTH AMERICA: REGULATORY BODIES, GOVERNMENT AGENCIES, AND OTHER ORGANIZATIONS
                    TABLE 8 EUROPE: REGULATORY BODIES, GOVERNMENT AGENCIES, AND OTHER ORGANIZATIONS
                    TABLE 9 ASIA PACIFIC: REGULATORY BODIES, GOVERNMENT AGENCIES, AND OTHER ORGANIZATIONS
                    TABLE 10 REST OF THE WORLD: REGULATORY BODIES, GOVERNMENT AGENCIES, AND OTHER ORGANIZATIONS
    5.8 PORTER'S FIVE FORCES ANALYSIS 
          TABLE 11 MARKET SHARE: PORTER'S FIVE FORCES ANALYSIS
           5.8.1 THREAT OF NEW ENTRANTS
           5.8.2 THREAT OF SUBSTITUTES
           5.8.3 BARGAINING POWER OF BUYERS
           5.8.4 BARGAINING POWER OF SUPPLIERS
           5.8.5 INTENSITY OF COMPETITIVE RIVALRY
    5.9 KEY CONFERENCES AND EVENTS IN 2022–2023 
          TABLE 12 MARKET: CONFERENCES AND EVENTS
    5.10 KEY STAKEHOLDERS AND BUYING CRITERIA 
          FIGURE 22 INFLUENCE OF STAKEHOLDERS ON BUYING PROCESS FOR PRODUCTS & SERVICES
          FIGURE 23 BUYING CRITERIA FOR BIOLOGICS SAFETY TESTING PRODUCTS & SERVICES
 
6 BIOLOGICS SAFETY TESTING MARKET FORECAST, BY PRODUCT & SERVICE (Page No. - 70)
    6.1 INTRODUCTION 
          TABLE 13 BIOLOGICS SAFETY TESTING INDUSTRY TRENDS, BY PRODUCT & SERVICE, 2020–2027 (USD MILLION)
    6.2 SERVICES  
           6.2.1 INCREASING OUTSOURCING OF SERVICES TO CROS TO DRIVE MARKET
                    TABLE 14 BIOLOGICS SAFETY TESTING SERVICES MARKET, BY REGION, 2020–2027 (USD MILLION)
                    TABLE 15 NORTH AMERICA: BIOLOGICS SAFETY TESTING SERVICES MARKET, BY COUNTRY, 2020–2027 (USD MILLION)
                    TABLE 16 EUROPE: BIOLOGICS SAFETY TESTING SERVICES MARKET, BY COUNTRY, 2020–2027 (USD MILLION)
                    TABLE 17 ASIA PACIFIC: BIOLOGICS SAFETY TESTING SERVICES MARKET, BY COUNTRY, 2020–2027 (USD MILLION)
    6.3 CONSUMABLES 
           6.3.1 RECURRENT PURCHASE OF ASSAYS, KITS, AND REAGENTS TO DRIVE MARKET
                    TABLE 18 BIOLOGICS SAFETY TESTING CONSUMABLES MARKET, BY REGION, 2020–2027 (USD MILLION)
                    TABLE 19 NORTH AMERICA: BIOLOGICS SAFETY TESTING CONSUMABLES MARKET, BY COUNTRY, 2020–2027 (USD MILLION)
                    TABLE 20 EUROPE: BIOLOGICS SAFETY TESTING CONSUMABLES MARKET, BY COUNTRY, 2020–2027 (USD MILLION)
                    TABLE 21 ASIA PACIFIC: BIOLOGICS SAFETY TESTING CONSUMABLES MARKET, BY COUNTRY, 2020–2027 (USD MILLION)
    6.4 INSTRUMENTS 
           6.4.1 LONGER SHELF LIFE OF INSTRUMENTS TO RESTRAIN MARKET
                    TABLE 22 BIOLOGICS SAFETY TESTING INSTRUMENTS MARKET, BY REGION, 2020–2027 (USD MILLION)
                    TABLE 23 NORTH AMERICA: BIOLOGICS SAFETY TESTING INSTRUMENTS MARKET, BY COUNTRY, 2020–2027 (USD MILLION)
                    TABLE 24 EUROPE: BIOLOGICS SAFETY TESTING INSTRUMENTS MARKET, BY COUNTRY, 2020–2027 (USD MILLION)
                    TABLE 25 ASIA PACIFIC: BIOLOGICS SAFETY TESTING INSTRUMENTS MARKET, BY COUNTRY, 2020–2027 (USD MILLION)
 
7 BIOLOGICS SAFETY TESTING MARKET FORECAST, BY TEST TYPE (Page No. - 78)
    7.1 INTRODUCTION 
          TABLE 26 BIOLOGICS SAFETY TESTING INDUSTRY TRENDS, BY TEST TYPE, 2020–2027 (USD MILLION)
    7.2 RESIDUAL HOST-CELL PROTEINS AND DNA DETECTION TESTS 
           7.2.1 GROWING USE OF RDNA IN VARIOUS MANUFACTURING STAGES TO DRIVE MARKET
                    TABLE 27 RESIDUAL HOST-CELL PROTEINS AND DNA DETECTION TESTS MARKET, BY REGION, 2020–2027 (USD MILLION)
                    TABLE 28 NORTH AMERICA: RESIDUAL HOST-CELL PROTEINS AND DNA DETECTION TESTS MARKET, BY COUNTRY, 2020–2027 (USD MILLION)
                    TABLE 29 EUROPE: RESIDUAL HOST-CELL PROTEINS AND DNA DETECTION TESTS MARKET, BY COUNTRY, 2020–2027 (USD MILLION)
                    TABLE 30 ASIA PACIFIC: RESIDUAL HOST-CELL PROTEINS AND DNA DETECTION TESTS MARKET, BY COUNTRY, 2020–2027 (USD MILLION)
    7.3 MYCOPLASMA TESTS 
           7.3.1 GROWING CONCERNS OVER CELL CULTURE CONTAMINATION TO DRIVE MARKET
                    TABLE 31 MYCOPLASMA TESTS MARKET, BY REGION, 2020–2027 (USD MILLION)
                    TABLE 32 NORTH AMERICA: MYCOPLASMA TESTS MARKET, BY COUNTRY, 2020–2027 (USD MILLION)
                    TABLE 33 EUROPE: MYCOPLASMA TESTS MARKET, BY COUNTRY, 2020–2027 (USD MILLION)
                    TABLE 34 ASIA PACIFIC: MYCOPLASMA TESTS MARKET, BY COUNTRY, 2020–2027 (USD MILLION)
    7.4 STERILITY TESTS 
           7.4.1 MANDATORY TESTING CONDUCTED FOR DRUG DEVELOPMENT & PRODUCTION TO DRIVE MARKET
                    TABLE 35 STERILITY TESTS MARKET, BY REGION, 2020–2027 (USD MILLION)
                    TABLE 36 NORTH AMERICA: STERILITY TESTS MARKET, BY COUNTRY, 2020–2027 (USD MILLION)
                    TABLE 37 EUROPE: STERILITY TESTS MARKET, BY COUNTRY, 2020–2027 (USD MILLION)
                    TABLE 38 ASIA PACIFIC: STERILITY TESTS MARKET, BY COUNTRY, 2020–2027 (USD MILLION)
    7.5 ENDOTOXIN TESTS 
           7.5.1 RISING DEMAND FOR LAL TESTING TO SUPPORT MARKET GROWTH
                    TABLE 39 ENDOTOXIN TESTS MARKET, BY REGION, 2020–2027 (USD MILLION)
                    TABLE 40 NORTH AMERICA: ENDOTOXIN TESTS MARKET, BY COUNTRY, 2020–2027 (USD MILLION)
                    TABLE 41 EUROPE: ENDOTOXIN TESTS MARKET, BY COUNTRY, 2020–2027 (USD MILLION)
                    TABLE 42 ASIA PACIFIC: ENDOTOXIN TESTS MARKET, BY COUNTRY, 2020–2027 (USD MILLION)
    7.6 VIRUS SAFETY TESTS 
           7.6.1 RISING UPTAKE IN VACCINE DEVELOPMENT AND CELL & GENE THERAPY TO SUPPORT MARKET
                    TABLE 43 VIRUS SAFETY TESTS MARKET, BY REGION, 2020–2027 (USD MILLION)
                    TABLE 44 NORTH AMERICA: VIRUS SAFETY TESTS MARKET, BY COUNTRY, 2020–2027 (USD MILLION)
                    TABLE 45 EUROPE: VIRUS SAFETY TESTS MARKET, BY COUNTRY, 2020–2027 (USD MILLION)
                    TABLE 46 ASIA PACIFIC: VIRUS SAFETY TESTS MARKET, BY COUNTRY, 2020–2027 (USD MILLION)
    7.7 BIOBURDEN TESTS 
           7.7.1 GROWING CONCERNS FOR DRUG SAFETY STANDARDS TO PROPEL MARKET
                    TABLE 47 BIOBURDEN TESTS MARKET, BY REGION, 2020–2027 (USD MILLION)
                    TABLE 48 NORTH AMERICA: BIOBURDEN TESTS MARKET, BY COUNTRY, 2020–2027 (USD MILLION)
                    TABLE 49 EUROPE: BIOBURDEN TESTS MARKET, BY COUNTRY, 2020–2027 (USD MILLION)
                    TABLE 50 ASIA PACIFIC: BIOBURDEN TESTS MARKET, BY COUNTRY, 2020–2027 (USD MILLION)
    7.8 OTHER BIOLOGICS SAFETY TESTS 
          TABLE 51 OTHER BIOLOGICS SAFETY TESTS MARKET, BY REGION, 2020–2027 (USD MILLION)
          TABLE 52 NORTH AMERICA: OTHER BIOLOGICS SAFETY TESTS MARKET, BY COUNTRY, 2020–2027 (USD MILLION)
          TABLE 53 EUROPE: OTHER BIOLOGICS SAFETY TESTS MARKET, BY COUNTRY, 2020–2027 (USD MILLION)
          TABLE 54 ASIA PACIFIC: OTHER BIOLOGICS SAFETY TESTS MARKET, BY COUNTRY, 2020–2027 (USD MILLION)
 
8 BIOLOGICS SAFETY TESTING MARKET FORECAST, BY APPLICATION (Page No. - 93)
    8.1 INTRODUCTION 
          TABLE 55 BIOLOGICS SAFETY TESTING INDUSTRY TRENDS, BY APPLICATION, 2020–2027 (USD MILLION)
    8.2 MONOCLONAL ANTIBODIES DEVELOPMENT AND MANUFACTURING 
           8.2.1 RISING APPROVALS FOR BIOSIMILAR MABS TO DRIVE MARKET
                    TABLE 56 MARKET TRENDS FOR MONOCLONAL ANTIBODIES DEVELOPMENT AND MANUFACTURING, BY REGION, 2020–2027 (USD MILLION)
                    TABLE 57 NORTH AMERICA: MARKET FOR MONOCLONAL ANTIBODIES DEVELOPMENT AND MANUFACTURING, BY COUNTRY, 2020–2027 (USD MILLION)
                    TABLE 58 EUROPE: MARKET FOR MONOCLONAL ANTIBODIES DEVELOPMENT AND MANUFACTURING, BY COUNTRY, 2020–2027 (USD MILLION)
                    TABLE 59 ASIA PACIFIC: MARKET FOR MONOCLONAL ANTIBODIES DEVELOPMENT AND MANUFACTURING, BY COUNTRY, 2020–2027 (USD MILLION)
    8.3 VACCINE DEVELOPMENT AND MANUFACTURING 
           8.3.1 GROWING PREVALENCE OF INFECTIOUS DISEASES TO DRIVE MARKET
                    TABLE 60 MARKET TRENDS FOR VACCINE DEVELOPMENT AND MANUFACTURING, BY REGION, 2020–2027 (USD MILLION)
                    TABLE 61 NORTH AMERICA: MARKET FOR VACCINE DEVELOPMENT AND MANUFACTURING, BY COUNTRY, 2020–2027 (USD MILLION)
                    TABLE 62 EUROPE: MARKET FOR VACCINE DEVELOPMENT AND MANUFACTURING, BY COUNTRY, 2020–2027 (USD MILLION)
                    TABLE 63 ASIA PACIFIC: MARKET FOR VACCINE DEVELOPMENT AND MANUFACTURING, BY COUNTRY, 2020–2027 (USD MILLION)
    8.4 CELLULAR & GENE THERAPY PRODUCT DEVELOPMENT AND MANUFACTURING 
           8.4.1 RISING ADOPTION OF CELLULAR IMMUNOTHERAPIES FOR CANCER TREATMENT TO DRIVE MARKET
                    TABLE 64 MARKET OVERVIEW FOR CELLULAR & GENE THERAPY PRODUCT DEVELOPMENT AND MANUFACTURING, BY REGION, 2020–2027 (USD MILLION)
                    TABLE 65 NORTH AMERICA: MARKET FOR CELLULAR & GENE THERAPY PRODUCTS DEVELOPMENT AND MANUFACTURING, BY COUNTRY, 2020–2027 (USD MILLION)
                    TABLE 66 EUROPE: MARKET FOR CELLULAR & GENE THERAPY PRODUCT DEVELOPMENT AND MANUFACTURING, BY COUNTRY, 2020–2027 (USD MILLION)
                    TABLE 67 ASIA PACIFIC: MARKET FOR CELLULAR & GENE THERAPY PRODUCTS DEVELOPMENT AND MANUFACTURING, BY COUNTRY, 2020–2027 (USD MILLION)
    8.5 BLOOD & BLOOD PRODUCT DEVELOPMENT AND MANUFACTURING 
           8.5.1 RISING UPTAKE OF STERILITY TESTS TO SUPPORT MARKET GROWTH
                    TABLE 68 MARKET OVERVIEW FOR BLOOD & BLOOD PRODUCT DEVELOPMENT AND MANUFACTURING, BY REGION, 2020–2027 (USD MILLION)
                    TABLE 69 NORTH AMERICA: MARKET FOR BLOOD & BLOOD PRODUCT DEVELOPMENT AND MANUFACTURING, BY COUNTRY, 2020–2027 (USD MILLION)
                    TABLE 70 EUROPE: MARKET FOR BLOOD & BLOOD PRODUCT DEVELOPMENT AND MANUFACTURING, BY COUNTRY, 2020–2027 (USD MILLION)
                    TABLE 71 ASIA PACIFIC: MARKET FOR BLOOD & BLOOD PRODUCT DEVELOPMENT AND MANUFACTURING, BY COUNTRY, 2020–2027 (USD MILLION)
    8.6 OTHER APPLICATIONS 
          TABLE 72 MARKET OVERVIEW FOR OTHER APPLICATIONS, BY REGION, 2020–2027 (USD MILLION)
          TABLE 73 NORTH AMERICA: MARKET FOR OTHER APPLICATIONS, BY COUNTRY, 2020–2027 (USD MILLION)
          TABLE 74 EUROPE: MARKET FOR OTHER APPLICATIONS, BY COUNTRY, 2020–2027 (USD MILLION)
          TABLE 75 ASIA PACIFIC: MARKET FOR OTHER APPLICATIONS, BY COUNTRY, 2020–2027 (USD MILLION)
 
9 BIOLOGICS SAFETY TESTING MARKET FORECAST, BY END USER (Page No. - 105)
    9.1 INTRODUCTION 
          TABLE 76 BIOLOGICS SAFETY TESTING INDUSTRY OVERVIEW, BY END USER, 2020–2027 (USD MILLION)
    9.2 PHARMACEUTICAL & BIOPHARMACEUTICAL COMPANIES 
           9.2.1 GROWING R&D EXPENDITURE FOR DRUG DEVELOPMENT TO DRIVE MARKET
                    FIGURE 24 PHARMACEUTICAL R&D SPENDING (2014–2028)
                    TABLE 77 MARKET OVERVIEW FOR PHARMACEUTICAL & BIOPHARMACEUTICAL COMPANIES, BY REGION, 2020–2027 (USD MILLION)
                    TABLE 78 NORTH AMERICA: MARKET FOR PHARMACEUTICAL & BIOPHARMACEUTICAL COMPANIES, BY COUNTRY, 2020–2027 (USD MILLION)
                    TABLE 79 EUROPE: MARKET FOR PHARMACEUTICAL & BIOPHARMACEUTICAL COMPANIES, BY COUNTRY, 2020–2027 (USD MILLION)
                    TABLE 80 ASIA PACIFIC: MARKET FOR PHARMACEUTICAL & BIOPHARMACEUTICAL COMPANIES, BY COUNTRY, 2020–2027 (USD MILLION)
    9.3 CONTRACT RESEARCH ORGANIZATIONS AND CONTRACT DEVELOPMENT & MANUFACTURING ORGANIZATIONS (CROS AND CDMOS) 
           9.3.1 ABILITY TO PROVIDE SPECIALIZED MANUFACTURING AND SAFETY TESTING TECHNOLOGIES TO DRIVE MARKET
                    TABLE 81 MARKET GROWTH FOR CROS AND CDMOS, BY REGION, 2020–2027 (USD MILLION)
                    TABLE 82 NORTH AMERICA: MARKET FOR CRS AND CDMOS, BY COUNTRY, 2020–2027 (USD MILLION)
                    TABLE 83 EUROPE: MARKET FOR CROS AND CDMOS, BY COUNTRY, 2020–2027 (USD MILLION)
                    TABLE 84 ASIA PACIFIC: MARKET FOR CROS AND CDMOS, BY COUNTRY, 2020–2027 (USD MILLION)
    9.4 ACADEMIC & RESEARCH INSTITUTES 
           9.4.1 AVAILABILITY OF ADVANCED EQUIPMENT AND SPECIALIZED R&D PERSONNEL TO SUPPORT MARKET GROWTH
                    TABLE 85 MARKET GROWTH FOR ACADEMIC & RESEARCH INSTITUTES, BY REGION, 2020–2027 (USD MILLION)
                    TABLE 86 NORTH AMERICA: MARKET FOR ACADEMIC & RESEARCH INSTITUTES, BY COUNTRY, 2020–2027 (USD MILLION)
                    TABLE 87 EUROPE: MARKET FOR ACADEMIC & RESEARCH INSTITUTES, BY COUNTRY, 2020–2027 (USD MILLION)
                    TABLE 88 ASIA PACIFIC: MARKET FOR ACADEMIC & RESEARCH INSTITUTES, BY COUNTRY, 2020–2027 (USD MILLION)
 
10 BIOLOGICS SAFETY TESTING MARKET FORECAST, BY REGION (Page No. - 113)
     10.1 INTRODUCTION 
             TABLE 89 BIOLOGICS SAFETY TESTING INDUSTRY GROWTH, BY REGION, 2020–2027 (USD MILLION)
     10.2 NORTH AMERICA 
             FIGURE 25 MARKET GROWTH: NORTH AMERICA MARKET SNAPSHOT
             TABLE 90 NORTH AMERICA: BIOLOGICS SAFETY TESTING MARKET, BY COUNTRY, 2020–2027 (USD MILLION)
             TABLE 91 NORTH AMERICA: MARKET, BY PRODUCT & SERVICE, 2020–2027 (USD MILLION)
             TABLE 92 NORTH AMERICA: MARKET, BY TEST TYPE, 2020–2027 (USD MILLION)
             TABLE 93 NORTH AMERICA: MARKET, BY APPLICATION, 2020–2027 (USD MILLION)
             TABLE 94 NORTH AMERICA: BIOLOGICS SAFETY TESTING MARKET, BY END USER, 2020–2027 (USD MILLION)
             10.2.1 US
                        10.2.1.1 High investments in biopharmaceutical R&D to drive market
                                      TABLE 95 US: BIOLOGICS SAFETY TESTING MARKET GROWTH, BY PRODUCT & SERVICE, 2020–2027 (USD MILLION)
                                      TABLE 96 US: MARKET, BY TEST TYPE, 2020–2027 (USD MILLION)
                                      TABLE 97 US: MARKET, BY APPLICATION, 2020–2027 (USD MILLION)
                                      TABLE 98 US: MARKET, BY END USER, 2020–2027 (USD MILLION)
             10.2.2 CANADA
                        10.2.2.1 Presence of R&D clusters and growing life sciences research to drive market
                                      TABLE 99 CANADA: BIOLOGICS SAFETY TESTING MARKET REPORT, BY PRODUCT & SERVICE, 2020–2027 (USD MILLION)
                                      TABLE 100 CANADA: MARKET, BY TEST TYPE, 2020–2027 (USD MILLION)
                                      TABLE 101 CANADA: MARKET, BY APPLICATION, 2020–2027 (USD MILLION)
                                      TABLE 102 CANADA: MARKET, BY END USER, 2020–2027 (USD MILLION)
             10.2.3 NORTH AMERICA: RECESSION IMPACT
     10.3 EUROPE 
             TABLE 103 EUROPE: BIOLOGICS SAFETY TESTING MARKET REPORT, BY COUNTRY, 2020–2027 (USD MILLION)
             TABLE 104 EUROPE: MARKET, BY PRODUCT & SERVICE, 2020–2027 (USD MILLION)
             TABLE 105 EUROPE: MARKET, BY TEST TYPE, 2020–2027 (USD MILLION)
             TABLE 106 EUROPE: MARKET, BY APPLICATION, 2020–2027 (USD MILLION)
             TABLE 107 EUROPE: BIOLOGICS SAFETY TESTING MARKET, BY END USER, 2020–2027 (USD MILLION)
             10.3.1 GERMANY
                        10.3.1.1 Favorable R&D funding by federal and state governments to propel market
                                      TABLE 108 GERMANY: BIOLOGICS SAFETY TESTING MARKET REPORT, BY PRODUCT & SERVICE, 2020–2027 (USD MILLION)
                                      TABLE 109 GERMANY: MARKET, BY TEST TYPE, 2020–2027 (USD MILLION)
                                      TABLE 110 GERMANY: MARKET, BY APPLICATION, 2020–2027 (USD MILLION)
                                      TABLE 111 GERMANY: MARKET, BY END USER, 2020–2027 (USD MILLION)
             10.3.2 UK
                        10.3.2.1 Growing focus on investments in vaccine manufacturing to drive market
                                      TABLE 112 UK: BIOLOGICS SAFETY TESTING MARKET REPORT, BY PRODUCT & SERVICE, 2020–2027 (USD MILLION)
                                      TABLE 113 UK: MARKET, BY TEST TYPE, 2020–2027 (USD MILLION)
                                      TABLE 114 UK: MARKET, BY APPLICATION, 2020–2027 (USD MILLION)
                                      TABLE 115 UK: MARKET, BY END USER, 2020–2027 (USD MILLION)
             10.3.3 FRANCE
                        10.3.3.1 Government initiatives to strengthen R&D activities to support market growth
                                      TABLE 116 FRANCE: BIOLOGICS SAFETY TESTING MARKET REPORT, BY PRODUCT & SERVICE, 2020–2027 (USD MILLION)
                                      TABLE 117 FRANCE: MARKET, BY TEST TYPE, 2020–2027 (USD MILLION)
                                      TABLE 118 FRANCE: MARKET, BY APPLICATION, 2020–2027 (USD MILLION)
                                      TABLE 119 FRANCE: MARKET, BY END USER, 2020–2027 (USD MILLION)
             10.3.4 ITALY
                        10.3.4.1 Favorable government support for establishment of biotech startups to propel market
                                      TABLE 120 ITALY: BIOLOGICS SAFETY TESTING MARKET DEMAND, BY PRODUCT & SERVICE, 2020–2027 (USD MILLION)
                                      TABLE 121 ITALY: MARKET, BY TEST TYPE, 2020–2027 (USD MILLION)
                                      TABLE 122 ITALY: MARKET, BY APPLICATION, 2020–2027 (USD MILLION)
                                      TABLE 123 ITALY: MARKET, BY END USER, 2020–2027 (USD MILLION)
             10.3.5 SPAIN
                        10.3.5.1 Increasing biologics production and outsourcing testing services to support market growth
                                      TABLE 124 SPAIN: BIOLOGICS SAFETY TESTING MARKET DEMAND, BY PRODUCT & SERVICE, 2020–2027 (USD MILLION)
                                      TABLE 125 SPAIN: MARKET, BY TEST TYPE, 2020–2027 (USD MILLION)
                                      TABLE 126 SPAIN: MARKET, BY APPLICATION, 2020–2027 (USD MILLION)
                                      TABLE 127 SPAIN: MARKET, BY END USER, 2020–2027 (USD MILLION)
             10.3.6 REST OF EUROPE
                        TABLE 128 REST OF EUROPE: BIOLOGICS SAFETY TESTING MARKET DEMAND, BY PRODUCT & SERVICE, 2020–2027 (USD MILLION)
                        TABLE 129 REST OF EUROPE: MARKET, BY TEST TYPE, 2020–2027 (USD MILLION)
                        TABLE 130 REST OF EUROPE: MARKET, BY APPLICATION, 2020–2027 (USD MILLION)
                        TABLE 131 REST OF EUROPE: MARKET PREDICTION, BY END USER, 2020–2027 (USD MILLION)
             10.3.7 EUROPE: RECESSION IMPACT
     10.4 ASIA PACIFIC 
             FIGURE 26 BIOLOGICS SAFETY TESTING INDUSTRY DEMAND: ASIA PACIFIC MARKET SNAPSHOT
             TABLE 132 ASIA PACIFIC: BIOLOGICS SAFETY TESTING MARKET, BY COUNTRY, 2020–2027 (USD MILLION)
             TABLE 133 ASIA PACIFIC: MARKET, BY PRODUCT & SERVICE, 2020–2027 (USD MILLION)
             TABLE 134 ASIA PACIFIC: MARKET, BY TEST TYPE, 2020–2027 (USD MILLION)
             TABLE 135 ASIA PACIFIC: MARKET, BY APPLICATION, 2020–2027 (USD MILLION)
             TABLE 136 ASIA PACIFIC: BIOLOGICS SAFETY TESTING MARKET PREDICTION, BY END USERS, 2020–2027 (USD MILLION)
             10.4.1 CHINA
                        10.4.1.1 Rising approvals for drug applications and high R&D innovation to drive market
                                      TABLE 137 CHINA: BIOLOGICS SAFETY TESTING MARKET DEMAND, BY PRODUCT & SERVICE, 2020–2027 (USD MILLION)
                                      TABLE 138 CHINA: MARKET, BY TEST TYPE, 2020–2027 (USD MILLION)
                                      TABLE 139 CHINA: MARKET, BY APPLICATION, 2020–2027 (USD MILLION)
                                      TABLE 140 CHINA: TESTING MARKET, BY END USER, 2020–2027 (USD MILLION)
             10.4.2 JAPAN
                        10.4.2.1 Rising investments for establishment of cell & gene therapy facilities to propel market
                                      TABLE 141 JAPAN: BIOLOGICS SAFETY TESTING MARKET ANALYSIS, BY PRODUCT & SERVICE, 2020–2027 (USD MILLION)
                                      TABLE 142 JAPAN: MARKET, BY TEST TYPE, 2020–2027 (USD MILLION)
                                      TABLE 143 JAPAN: MARKET, BY APPLICATION, 2020–2027 (USD MILLION)
                                      TABLE 144 JAPAN: MARKET PREDICTION, BY END USER, 2020–2027 (USD MILLION)
             10.4.3 INDIA
                        10.4.3.1 High demand for export of pharmaceuticals and vaccines to drive market
                                      TABLE 145 INDIA: BIOLOGICS SAFETY TESTING MARKET ANALYSIS, BY PRODUCT & SERVICE, 2020–2027 (USD MILLION)
                                      TABLE 146 INDIA: MARKET, BY TEST TYPE, 2020–2027 (USD MILLION)
                                      TABLE 147 INDIA: MARKET, BY APPLICATION, 2020–2027 (USD MILLION)
                                      TABLE 148 INDIA: MARKET, BY END USER, 2020–2027 (USD MILLION)
             10.4.4 REST OF ASIA PACIFIC
                        TABLE 149 REST OF ASIA PACIFIC: BIOLOGICS SAFETY TESTING MARKET ANALYSIS, BY PRODUCT & SERVICE, 2020–2027 (USD MILLION)
                        TABLE 150 REST OF ASIA PACIFIC: MARKET, BY TEST TYPE, 2020–2027 (USD MILLION)
                        TABLE 151 REST OF ASIA PACIFIC: MARKET, BY APPLICATION, 2020–2027 (USD MILLION)
                        TABLE 152 REST OF ASIA PACIFIC: MARKET PREDICTION, BY END USER, 2020–2027 (USD MILLION)
             10.4.5 ASIA PACIFIC: RECESSION IMPACT
     10.5 LATIN AMERICA 
             10.5.1 GROWING APPROVAL OF BIOSIMILARS TO SUPPORT MARKET GROWTH
                        TABLE 153 LATIN AMERICA: BIOLOGICS SAFETY TESTING MARKET ANALYSIS, BY PRODUCT & SERVICE, 2020–2027 (USD MILLION)
                        TABLE 154 LATIN AMERICA: BIOLOGICS SAFETY TESTING INDUSTRY, BY TEST TYPE, 2020–2027 (USD MILLION)
                        TABLE 155 LATIN AMERICA: MARKET, BY APPLICATION, 2020–2027 (USD MILLION)
                        TABLE 156 LATIN AMERICA: MARKET, BY END USER, 2020–2027 (USD MILLION)
             10.5.2 LATIN AMERICA: RECESSION IMPACT
     10.6 MIDDLE EAST & AFRICA 
             10.6.1 RISING FOCUS ON DRUG DISCOVERY AND DEVELOPMENT TO SUPPORT MARKET GROWTH
                        TABLE 157 MIDDLE EAST & AFRICA: BIOLOGICS SAFETY TESTING MARKET ANALYSIS, BY PRODUCT & SERVICE, 2020–2027 (USD MILLION)
                        TABLE 158 MIDDLE EAST & AFRICA: BIOLOGICS SAFETY TESTING INDUSTRY, BY TEST TYPE, 2020–2027 (USD MILLION)
                        TABLE 159 MIDDLE EAST & AFRICA: MARKET, BY APPLICATION, 2020–2027 (USD MILLION)
                        TABLE 160 MIDDLE EAST & AFRICA: MARKET PREDICTION, BY END USER, 2020–2027 (USD MILLION)
             10.6.2 MIDDLE EAST & AFRICA: RECESSION IMPACT
 
11 COMPETITIVE LANDSCAPE (Page No. - 161)
     11.1 OVERVIEW 
     11.2 RIGHT-TO-WIN STRATEGIES ADOPTED BY KEY PLAYERS 
             FIGURE 27 BIOLOGICS SAFETY TESTING MARKET: KEY PLAYER STRATEGIES (2019–2022)
     11.3 MARKET SHARE ANALYSIS 
             FIGURE 28 MARKET: MARKET SHARE ANALYSIS OF KEY PLAYERS, 2021 (TOP EIGHT)
             TABLE 161 MARKET: INTENSITY OF COMPETITIVE RIVALRY
     11.4 REVENUE SHARE ANALYSIS OF KEY PLAYERS 
             FIGURE 29 BIOLOGICS SAFETY TESTING INDUSTRY: REVENUE SHARE ANALYSIS OF KEY PLAYERS (TOP EIGHT)
     11.5 COMPANY EVALUATION MATRIX 
             11.5.1 STARS
             11.5.2 EMERGING LEADERS
             11.5.3 PERVASIVE PLAYERS
             11.5.4 PARTICIPANTS
                        FIGURE 30 BIOLOGICS SAFETY TESTING INDUSTRY: COMPANY EVALUATION MATRIX, 2021
     11.6 COMPETITIVE LEADERSHIP MAPPING FOR STARTUPS 
             11.6.1 PROGRESSIVE COMPANIES
             11.6.2 STARTING BLOCKS
             11.6.3 DYNAMIC COMPANIES
             11.6.4 RESPONSIVE COMPANIES
                        FIGURE 31 BIOLOGICS SAFETY TESTING: COMPETITIVE LEADERSHIP MAPPING FOR STARTUPS (2021)
     11.7 COMPETITIVE BENCHMARKING 
             11.7.1 COMPANY PRODUCT FOOTPRINT
                        TABLE 162 BIOLOGICS SAFETY TESTING MARKET: PRODUCT PORTFOLIO ANALYSIS
             11.7.2 COMPANY TEST TYPE FOOTPRINT
                        TABLE 163 BIOLOGICS SAFETY TESTING INDUSTRY: TEST TYPE ANALYSIS
             11.7.3 COMPANY GEOGRAPHIC FOOTPRINT
                        TABLE 164 BIOLOGICS SAFETY TESTING MARKET: GEOGRAPHIC ANALYSIS
             11.7.4 OVERALL COMPANY FOOTPRINT (25 COMPANIES)
                        TABLE 165 BIOLOGICS SAFETY TESTING INDUSTRY: COMPANY FOOTPRINT
                        11.7.4.1 COMPETITIVE BENCHMARKING FOR STARTUPS
                                      TABLE 166 BIOLOGICS SAFETY TESTING INDUSTRY: KEY STARTUPS
                                      TABLE 167 BIOLOGICS SAFETY TESTING INDUSTRY: COMPETITIVE BENCHMARKING OF KEY STARTUPS
     11.8 COMPETITIVE SCENARIO 
             11.8.1 BIOLOGICS SAFETY TESTING INDUSTRY: PRODUCT LAUNCHES (JANUARY 2019−DECEMBER 2022)
             11.8.2 BIOLOGICS SAFETY TESTING INDUSTRY: DEALS (JANUARY 2019−DECEMBER 2022)
             11.8.3 BIOLOGICS SAFETY TESTING INDUSTRY: OTHER DEVELOPMENTS (JANUARY 2019−DECEMBER 2022)
 
12 COMPANY PROFILES (Page No. - 178)
     12.1 KEY PLAYERS 
(Business Overview, Products Offered, Recent Developments, and MnM View (Key strengths/Right to Win, Strategic Choices Made, and Weaknesses and Competitive Threats))*
             12.1.1 CHARLES RIVER LABORATORIES
                        TABLE 168 CHARLES RIVER LABORATORIES: BUSINESS OVERVIEW
                        FIGURE 32 CHARLES RIVER LABORATORIES: COMPANY SNAPSHOT (2021)
             12.1.2 LONZA
                        TABLE 169 LONZA: BUSINESS OVERVIEW
                        FIGURE 33 LONZA: COMPANY SNAPSHOT (2021)
             12.1.3 THERMO FISHER SCIENTIFIC, INC.
                        TABLE 170 THERMO FISHER SCIENTIFIC: BUSINESS OVERVIEW
                        FIGURE 34 THERMO FISHER SCIENTIFIC, INC.: COMPANY SNAPSHOT (2020)
             12.1.4 MERCK KGAA
                        TABLE 171 MERCK KGAA: BUSINESS OVERVIEW
                        FIGURE 35 MERCK KGAA: COMPANY SNAPSHOT (2021)
             12.1.5 LABORATORY CORPORATION OF AMERICA HOLDINGS (LABCORP)
                        FIGURE 36 LABORATORY CORPORATION OF AMERICA HOLDINGS: COMPANY SNAPSHOT (2021)
             12.1.6 SGS SA
                        TABLE 173 SGS SA: BUSINESS OVERVIEW
                        FIGURE 37 SGS SA: COMPANY SNAPSHOT (2021)
             12.1.7 EUROFINS SCIENTIFIC
                        TABLE 174 EUROFINS SCIENTIFIC: BUSINESS OVERVIEW
                        FIGURE 38 EUROFINS SCIENTIFIC: COMPANY SNAPSHOT (2021)
             12.1.8 WUXI APPTEC
                        TABLE 175 WUXI APPTEC: BUSINESS OVERVIEW
                        FIGURE 39 WUXI APPTEC: COMPANY SNAPSHOT (2021)
             12.1.9 ASSOCIATES OF CAPE COD, INC.
                        TABLE 176 ASSOCIATES OF CAPE COD, INC.: BUSINESS OVERVIEW
             12.1.10 BIOMÉRIEUX SA
                        TABLE 177 BIOMÉRIEUX SA: BUSINESS OVERVIEW
                        FIGURE 40 BIOMÉRIEUX SA: COMPANY SNAPSHOT (2021)
             12.1.11 SAMSUNG BIOLOGICS
                        TABLE 178 SAMSUNG BIOLOGICS: BUSINESS OVERVIEW
                        FIGURE 41 SAMSUNG BIOLOGICS: COMPANY SNAPSHOT (2021)
             12.1.12 GENSCRIPT
                        TABLE 179 GENSCRIPT: BUSINESS OVERVIEW
                        FIGURE 42 GENSCRIPT: COMPANY SNAPSHOT (2021)
             12.1.13 SARTORIUS AG
                        TABLE 180 SARTORIUS AG: BUSINESS OVERVIEW
                        FIGURE 43 SARTORIUS AG: COMPANY SNAPSHOT (2021)
             12.1.14 F. HOFFMANN-LA ROCHE LTD.
                        TABLE 181 F. HOFFMANN-LA ROCHE LTD.: BUSINESS OVERVIEW
                        FIGURE 44 F. HOFFMANN-LA ROCHE LTD.: COMPANY SNAPSHOT (2021)
             12.1.15 PACIFIC BIOLABS
                        TABLE 182 PACIFIC BIOLABS: BUSINESS OVERVIEW
             12.1.16 NELSON LABORATORIES, LLC (PART OF SOTERA HEALTH)
                        TABLE 183 NELSON LABORATORIES: BUSINESS OVERVIEW
             12.1.17 AGILENT TECHNOLOGIES, INC.
                        TABLE 184 AGILENT TECHNOLOGIES: BUSINESS OVERVIEW
                        FIGURE 45 AGILENT TECHNOLOGIES: COMPANY SNAPSHOT (2021)
             12.1.18 MARAVAI LIFESCIENCES
                        TABLE 185 MARAVAI LIFESCIENCES: BUSINESS OVERVIEW
                        FIGURE 46 MARAVAI LIFESCIENCES: COMPANY SNAPSHOT (2021)
     12.2 OTHER PLAYERS 
             12.2.1 QIAGEN
             12.2.2 BIO-RAD LABORATORIES, INC.
             12.2.3 MICROCOAT BIOTECHNOLOGIE GMBH
             12.2.4 INVIVOGEN
             12.2.5 PROMOCELL GMBH
             12.2.6 ACCUGEN LABORATORIES, INC.
             12.2.7 FUJIFILM WAKO PURE CHEMICAL CORPORATION
             12.2.8 ALMAC GROUP
 
*Details on Business Overview, Products Offered, Recent Developments, and MnM View (Key strengths/Right to Win, Strategic Choices Made, and Weaknesses and Competitive Threats) might not be captured in case of unlisted companies.
 
13 APPENDIX (Page No. - 244)
     13.1 DISCUSSION GUIDE 
     13.2 KNOWLEDGESTORE: MARKETSANDMARKETS’ SUBSCRIPTION PORTAL 
     13.3 CUSTOMIZATION OPTIONS 
     13.4 RELATED REPORTS 
     13.5 AUTHOR DETAILS 

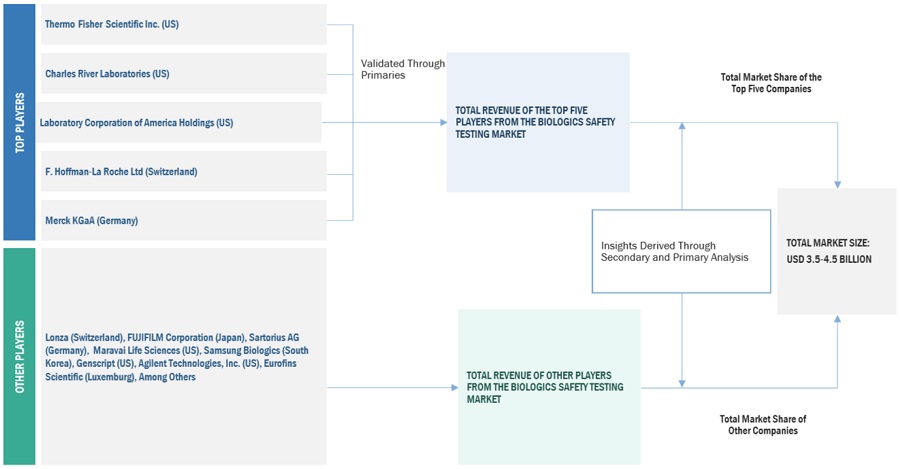
This market research study involved the extensive use of secondary sources, directories, and databases to identify and collect information useful for this technical, market-oriented, and financial study of the global biologics safety testing market. In-depth interviews were conducted with various primary respondents, including key industry participants, subject-matter experts (SMEs), C-level executives of key market players, and industry consultants, among other experts, to obtain and verify critical qualitative and quantitative information and to assess market prospects. The size of the biologics safety testing market was estimated through various secondary research approaches and triangulated with inputs from primary research to arrive at the final market size.

Secondary Research

The secondary sources referred to for this research study included publications from government sources such as the Biotechnology and Biological Sciences Research Council (BBSRC), United States Food and Drug Administration (FDA), National Center for Biotechnology Information (NCBI), World Bank, World Health Organization (WHO), Centers for Disease Control and Prevention (CDC), Organisation for Economic Co-operation and Development (OECD), National Institutes of Health (NIH), and American Society for Microbiology (ASM).

Secondary sources also include corporate and regulatory filings (such as annual reports, SEC filings, investor presentations, and financial statements); business magazines and research journals; press releases; and trade, business, and professional associations, among others. Secondary data was collected and analyzed to arrive at the overall size of the global biologics safety testing market, which was validated through primary research.

Primary Research

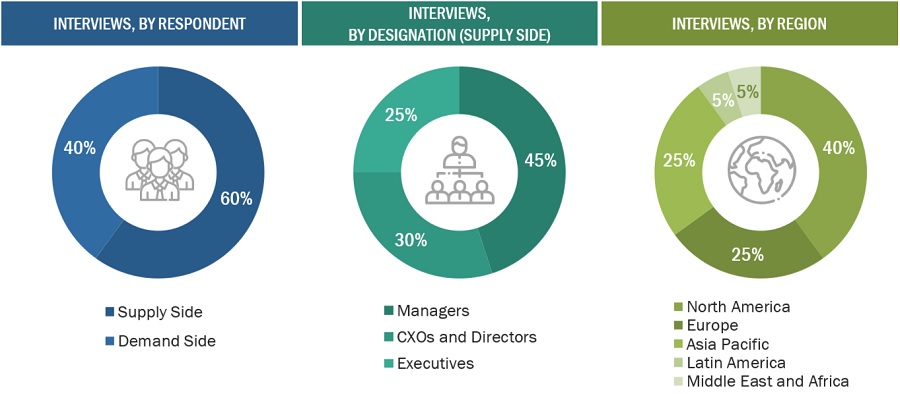
Extensive primary research was conducted after acquiring basic knowledge about the global biologics safety testing market scenario through secondary research. Several primary interviews were conducted with market experts from both the demand (such as personnel from research centers, government and academic institutes, and pharmaceutical & biopharmaceutical companies) and supply sides (such as C-level and D-level executives, product managers, marketing and sales managers of key manufacturers, distributors, and channel partners) across five major regions, namely, North America, Europe, Asia Pacific, Latin America, and the Middle East and Africa. Approximately 80% and 20% of primary interviews were conducted with supply-side and demand-side participants, respectively. This primary data was collected through questionnaires, e-mails, online surveys, personal interviews, and telephonic interviews.

Breakdown of Primary Participants

Biologics Safety Testing Market Size, and Share

To know about the assumptions considered for the study, download the pdf brochure

Data Triangulation

After arriving at the overall size of the biologics safety testing market through the methodology mentioned above, this market was split into several segments and subsegments. Market breakdown procedures were employed, wherever applicable, to arrive at the exact market value for the key segments and subsegments. The extrapolated market data was triangulated by studying various macroindicators and regional trends from both demand and supply-side participants.

Report Objectives

  • To define, describe, and forecast the biologics safety testing market on the basis of product & service, application, test type, end user, and region
  • To provide detailed information regarding the factors influencing the market growth (such as drivers, opportunities, restraints, and challenges)
  • To strategically analyze micromarkets1 with respect to individual growth trends, prospects, and contributions to the overall biologics safety testing market
  • To analyze market opportunities for stakeholders and provide details of the competitive landscape for key players
  • To profile the key players in the global biologics safety testing market and comprehensively analyze their core competencies2 and market rankings
  • To forecast the size of the market segments in North America, Europe, the Asia Pacific (APAC), Latin America, and the Middle East and Africa
  • To track and analyze competitive developments such as product & service launches, expansions, acquisitions, partnerships, collaborations, and agreements in the biologics safety testing market

Available Customizations:

With the given market data, MarketsandMarkets offers customizations as per your company’s specific needs. The following customization options are available for the report:

Geographical Analysis

  • Further breakdown of the European oligonucleotide synthesis market into RoE countries
  • Further breakdown of the Asia Pacific oligonucleotide synthesis market into RoAPAC countries

Company Information

  • Detailed analysis and profiling of additional market players (up to 5)

Future Growth Drivers for Biosafety Testing Market

  • Increasing demand for biopharmaceuticals: The demand for biopharmaceuticals is rapidly increasing due to the aging population and the rise of chronic diseases. Biosafety testing is an essential component of the biopharmaceutical manufacturing process, as it ensures the safety and efficacy of these products.
  • Stringent government regulations: The government regulations and guidelines are becoming increasingly strict to ensure the safety of patients and the environment. Biosafety testing is mandated by these regulations to ensure that biopharmaceuticals and other products are safe for use.
  • Advancements in technology: The advancements in technology, such as next-generation sequencing, are enabling the development of more sensitive and accurate biosafety testing methods. These technologies are improving the speed and efficiency of biosafety testing, leading to reduced costs and increased throughput.
  • Increasing investment in R&D: The increasing investment in research and development activities is driving the growth of the biosafety testing market. As biopharmaceutical companies develop new drugs and therapies, they require extensive biosafety testing to ensure the safety and efficacy of these products.
  • Growing focus on quality control: The focus on quality control is increasing in the biopharmaceutical industry, as companies strive to improve their manufacturing processes and reduce the risk of contamination or other issues. Biosafety testing plays a critical role in quality control, ensuring that products meet strict safety and quality standards.

Top 20 Use Cases including Existing and Futuristic for Biosafety Testing Market

  1. Testing of biopharmaceutical products for contamination and impurities
  2. Testing of medical devices for safety and efficacy
  3. Detection of viral infections in blood and tissue samples
  4. Quality control of food and agricultural products to ensure safety for consumption
  5. Environmental monitoring to detect pathogens and other contaminants in air, water, and soil
  6. Identification of antibiotic resistance in bacteria
  7. Screening of stem cell therapies for safety and efficacy
  8. Testing of cosmetics and personal care products for safety and toxicity
  9. Monitoring of microbial communities in industrial settings, such as bioreactors and wastewater treatment plants
  10. Testing of vaccines for safety and efficacy
  11. Detection of mycotoxins in food products
  12. Identification of emerging infectious diseases in humans and animals
  13. Testing of cell and gene therapies for safety and efficacy
  14. Quality control of raw materials and intermediates used in biopharmaceutical manufacturing
  15. Monitoring of water quality in swimming pools and other recreational areas
  16. Testing of blood and plasma products for safety and purity
  17. Detection of foodborne pathogens in fresh produce and meat products
  18. Monitoring of air quality in hospitals and other healthcare facilities
  19. Screening of genetically modified organisms for safety and compliance with regulatory guidelines
  20. Testing of packaging materials for safety and compatibility with products.

Niche Threats / Restraints for Biosafety Testing Market in Enterprise

  • High cost: Biosafety testing can be expensive due to the equipment, reagents, and trained personnel required. This can be a barrier for smaller companies or those with limited budgets.
  • Regulatory hurdles: Regulatory approval is required for many biosafety tests, which can be a lengthy and expensive process. In addition, regulations can vary by country or region, making it difficult for companies operating in multiple locations to comply with all requirements.
  • Limited expertise: Biosafety testing requires specialized knowledge and skills, which can be in short supply. Companies may struggle to find qualified personnel to perform the tests or interpret the results.
  • Limited sample availability: Some biosafety tests require access to live pathogens or other hazardous materials, which may be difficult to obtain or handle safely. This can limit the scope of testing that can be performed.
  • Limited testing capacity: Biosafety testing can be time-consuming and labor-intensive, which can limit the number of samples that can be processed at a given time. This can be a bottleneck for companies with high testing volumes or those facing urgent deadlines.
  • Competition from alternative methods: Some companies may opt for alternative methods to biosafety testing, such as in silico modeling or computer simulations. While these methods may be faster or less expensive, they may not be as accurate or reliable as biosafety testing.
  • Data privacy and security concerns: Biosafety testing generates large amounts of sensitive data, which must be stored and transmitted securely to protect patient privacy and prevent unauthorized access or tampering. Companies must invest in robust security measures to ensure the integrity of their data.

To speak to our analyst for a discussion on the above findings, click Speak to Analyst

Custom Market Research Services

We will customize the research for you, in case the report listed above does not meet with your exact requirements. Our custom research will comprehensively cover the business information you require to help you arrive at strategic and profitable business decisions.

Request Customization

Instant Answers with GPT - Ask Now!

Ask real questions. Get complete answers !
Report Code
BT 3334
Published ON
Jan, 2023
Choose License Type
BUY NOW
  • SHARE
X
Request Customization
Speak to Analyst
Speak to Analyst
OR FACE-TO-FACE MEETING
PERSONALIZE THIS RESEARCH
  • Triangulate with your Own Data
  • Get Data as per your Format and Definition
  • Gain a Deeper Dive on a Specific Application, Geography, Customer or Competitor
  • Any level of Personalization
REQUEST A FREE CUSTOMIZATION
LET US HELP YOU!
  • What are the Known and Unknown Adjacencies Impacting the Biologics Safety Testing Market
  • What will your New Revenue Sources be?
  • Who will be your Top Customer; what will make them switch?
  • Defend your Market Share or Win Competitors
  • Get a Scorecard for Target Partners
CUSTOMIZED WORKSHOP REQUEST
+1-888-600-6441
  • Call Us
  • +1-888-600-6441 (Corporate office hours)
  • +1-888-600-6441 (US/Can toll free)
  • +44-800-368-9399 (UK office hours)
CONNECT WITH US
ABOUT TRUST ONLINE
©2024 MarketsandMarkets Research Private Ltd. All rights reserved
DMCA.com Protection Status Website Feedback