RNA Therapeutics Market by Product (Vaccines, Drugs), Type (mRNA Therapeutics, RNA Interference, Antisense Oligonucleotides), Indication (Infectious Diseases, Rare Genetic Diseases), End User (Hospitals & Clinics) & Region - Global Forecast to 2028
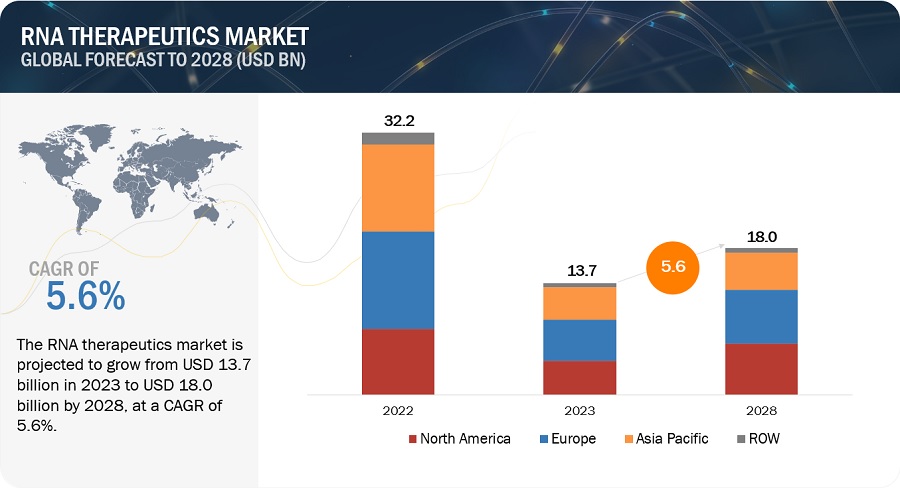
The global RNA therapeutics market, valued at US$32.2 billion in 2022, stood at US$13.7 billion in 2023 and is projected to advance at a resilient CAGR of 5.6% from 2023 to 2028, culminating in a forecasted valuation of US$18.0 billion by the end of the period. The research study consists of industry trends, pricing analysis, patent analysis, conference and webinar materials, key stakeholders, and buying behaviour in the market.
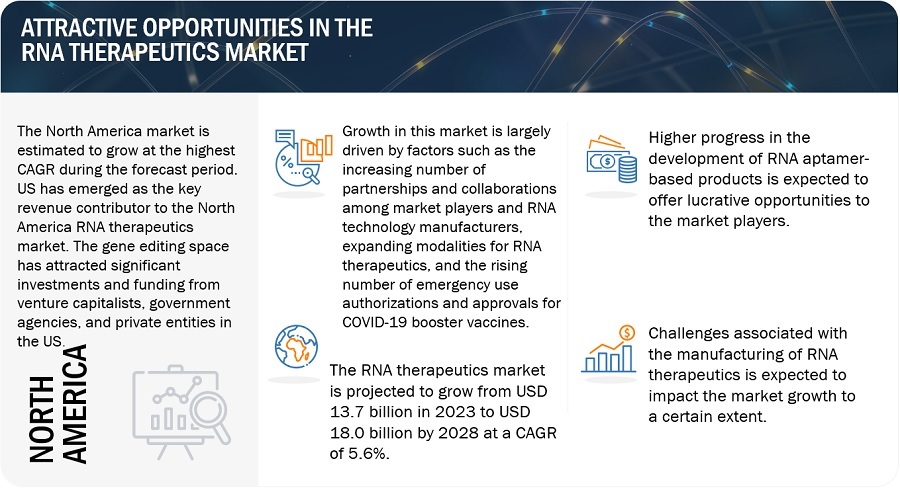
Growth in this market is largely driven by factors such as the increasing number of partnerships and collaborations among market players and RNA technology manufacturers, expanding modalities for RNA therapeutics, and the rising number of emergency use authorizations and approvals for COVID-19 booster vaccines. On the other hand, the discontinuation/recalls of RNA therapeutic products is expected to hinder market growth. Higher progress in the development of RNA aptamer-based products is expected to offer lucrative opportunities to the market players. Contrarily, challenges associated with the manufacturing of RNA therapeutics are expected to impact the market growth to a certain extent.
Attractive Opportunities in the RNA Therapeutics Market
To know about the assumptions considered for the study, Request for Free Sample Report
Global RNA Therapeutics Market Dynamics
DRIVER: Increasing partnerships and collaborations among market players and RNA technology manufacturers
RNA therapeutics is a rapidly growing field that can revolutionize the treatment of a wide range of diseases. The rapid growth of this market has been fueled by strategic partnerships and collaborations, both among market players and RNA technology manufacturers. Partnerships and collaborations between market players accelerate the development and commercialization of RNA therapeutics. By pooling their resources and expertise, companies can share the costs and risks of drug development and gain access to new technologies and markets. For instance, in January 2022, Pfizer Inc. and Beam Therapeutics Inc. entered a four-year exclusive research collaboration focused on in vivo base editing programs aimed at three targets for rare genetic diseases of the liver, muscle, and central nervous system. This collaboration can produce novel therapeutics for patients with rare diseases by combining Beam Therapeutics's in vivo delivery technologies, which deliver base editors to target organs via messenger RNA (mRNA) and lipid nanoparticles (LNPs), with Pfizer's expertise in the development of drugs and vaccines.
RESTRAINT: Discontinuation or recalls of RNA therapeutic products
Instances of discontinuation or recalls can arise due to various reasons, including unexpected adverse effects, safety concerns, efficacy issues, or regulatory non-compliance. These events can lead to a loss of consumer and healthcare provider confidence in RNA therapeutic products, resulting in reduced demand and adoption. Furthermore, discontinuations or recalls can affect the reputation of the companies involved in the process and the broader perception of RNA therapeutics as a viable treatment avenue. Investors can also become cautious, decreasing the funding for R&D in the concerned field. Regulatory authorities can also intensify regulations, potentially resulting in more stringent approval processes.
OPPORTUNITY: Higher progress in the development of RNA aptamer-based therapeutics
RNA aptamers are single-stranded nucleic acid molecules that can bind to specific targets with high affinity and specificity. They have been investigated for a variety of therapeutic applications, including cancer, cardiovascular diseases, and infectious diseases. The progress in the development of RNA aptamer-based therapeutics is a major market opportunity for the market. This is because RNA aptamers have a number of potential advantages over traditional drug therapies. The field of RNA therapeutics has undergone a significant transformation with the emergence of RNA aptamer-based therapeutics. There are currently more pipeline products than approved products. One such example includes pegaptanib sodium (Macugen), discovered by Nexstar Pharmaceuticals, which is an anti-vascular endothelial growth factor (anti-VEGF) RNA aptamer to treat all types of neovascular age-related macular degeneration (AMD).
CHALLENGE: Rapid degradation by ubiquitous RNases in environment and tissues with strong immunogenicity of exogenous RNA
The progress of RNA therapeutics faces significant challenges that have led to the need for innovative solutions in their development and manufacturing. One of the primary obstacles pertains to the inherent susceptibility of exogenous RNA to rapid degradation by ubiquitous RNases present in both the environment and tissues. Another critical challenge involves effectively delivering negatively charged RNA molecules across the hydrophobic cytoplasmic membrane of target cells. Additionally, the strong immunogenicity of exogenous RNA posed a significant obstacle, leading to cell toxicity and hampering the translation of RNA into therapeutic proteins.
RNA Therapeutics Market Ecosystem
R&D is the initial stage in the value chain of the market. Extensive R&D is required to develop these products. R&D activities are divided into in-house and outsourced tasks. In-house tasks focus on critical activities that deal with fundamental analysis and the electronic interpretation of testing parameters. Prominent companies offer RNA drugs and vaccines (including companies with pipeline candidates in phase 3/ 4) and SMEs (companies with pipeline candidates in phase 1 to phase 4). End customers (pharmaceutical & biotechnology companies, academic & research institutions, and diagnostic companies) are the key stakeholders in the supply chain of the market. Investors/funders are the major influencers in the market.
The prominent players in the global RNA therapeutics market are Moderna, Inc. (US), Alnylam Pharmaceuticals, Inc. (US), Pfizer Inc. (US), Novartis AG (Switzerland), Ionis Pharmaceuticals, Inc. (US), Sarepta Therapeutics, Inc. (US), Sanofi (France), Arrowhead Pharmaceuticals, Inc. (US), BioNtech SE (Germany), Orna Therapeutics (US), CRISPR Therapeutics (Switzerland), Silence Therapeutics (UK), Astellas Pharma Inc. (Japan), CureVac SE (Germany), Sirnaomics (US), Arcturus Therapeutics Inc. (US) and Arbutus Biopharma (US).
Ecosystem Analysis: RNA Therapeutics Market
Source: Annual Reports, SEC Filings, Investor Presentations, Expert Interviews, and MarketsandMarkets Analysis
The vaccines segment accounted for the largest share of the RNA therapeutics industry in 2022.
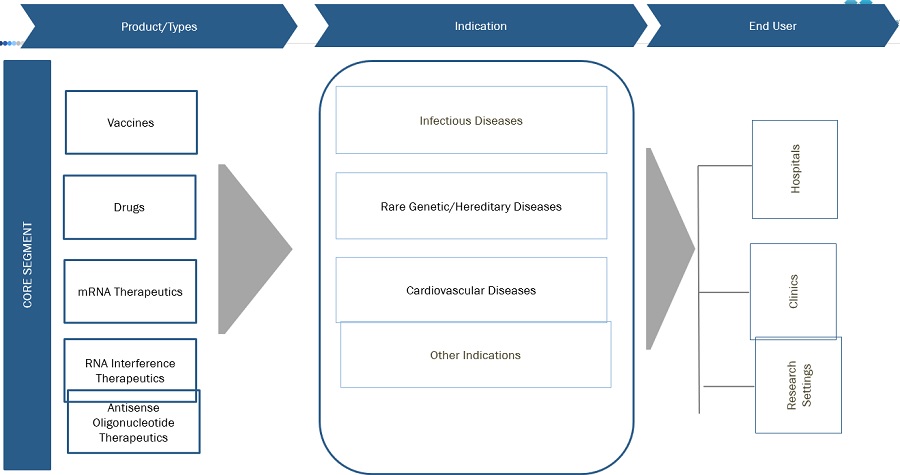
Based on product, the RNA therapeutics market is segmented into drugs and vaccines. Increasing investments in R&D, advancements in RNA synthesis and delivery technologies, and a growing understanding of RNA-based therapeutics have propelled the growth of the market. The R&D departments of the major companies have focused on new vaccines due to the increasing investments in this market. For instance, in August 2023, CureVac announced that the first participant was dosed in the Phase 2 study of monovalent and bivalent modified mRNA COVID-19 vaccine candidates, developed in collaboration with GSK. Moreover, in March 2022, Moderna announced it had begun its second phase 1 HIV vaccine trial. This latest phase 1 trial is a multicenter, open-label, randomized study (HVTN 302), which evaluates the safety and immunogenicity of their experimental HIV trimer mRNA vaccine (mRNA-1574).
The mRNA therapeutics is anticipated to dominate the RNA therapeutics industry through 2021-2028.
Based on the type, the RNA therapeutics market is segmented into RNA interference (RNAi) therapeutics, mRNA therapeutics, antisense oligonucleotide (ASO) therapeutics, and other therapeutics. mRNA therapeutics showcases a broad potential for treating diseases that necessitate protein expression, thereby offering heightened therapeutic efficacy due to its sustained translation into encoded proteins and peptides and enduring expression compared to conventional transient protein or peptide drugs. Evidently, these advantages of mRNA over DNA or protein/peptide introduce mRNA-based technology and products across various biomedical applications. Major industry players such as Moderna, Inc. (US), CureVac SE (Germany), BioNTech SE (Germany), Argos Therapeutics Inc. (US), Ethris GmbH (Germany), Arcturus Therapeutics (US), and Acuitas Therapeutics (Canada) develop novel mRNA therapy for a variety of indications.
The infectious diseases segment accounted for the largest share of the RNA therapeutics industry in 2022.
Based on the indication, the RNA therapeutics market is segmented into infectious diseases, rare genetic diseases/hereditary diseases, and other indications. Rapid developments in the RNA vaccine manufacturing capabilities have led to dominant share of the infectious diseases segment in the global market. mRNA vaccines offer a compelling alternative to traditional vaccine strategies due to their remarkable potency, rapid development capabilities, cost-effective manufacturing potential, and safe administration.
Hospitals & clinics generated the highest revenue in 2022 in the RNA therapeutics industry.
The RNA therapeutics market is segmented into hospitals, clinics, and research settings. An increase in the use of RNA-based therapeutics for the treatment of rare/genetic disorders contributes to the high share of hospitals & clinics. The growing use of RNA therapeutics across hospitals and clinics is driven by factors such as the increasing understanding and advancements of RNA-based therapeutics, the growing number of trends in personalized medicine, the increasing prevalence of chronic diseases, and the rising research investments by governments, private foundations, and industry stakeholders.
The North American RNA therapeutics industry is projected to grow at the fastest pace through the forecast period.
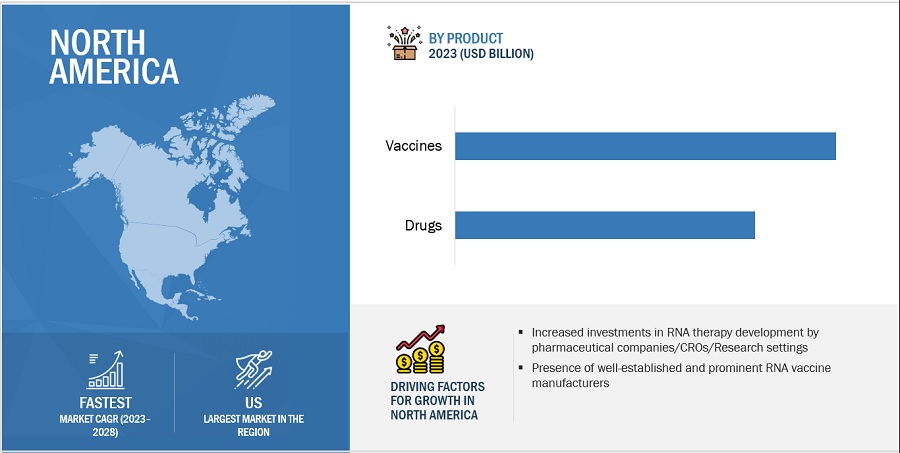
The global RNA therapeutics market is segmented into four major regions, namely, North America, Europe, the Asia Pacific, and the Rest of the World. Europe is the largest regional market for RNA therapeutics. The US has emerged as the key revenue contributor to the North American market. The gene editing space has attracted significant investments and funding from venture capitalists, government agencies, and private entities in the US. This funding has fueled R&D efforts and the translation of gene editing technologies into commercial applications. The availability of capital has facilitated the growth of RNA therapeutic manufacturers, rendering the fastest growth to this region.
To know about the assumptions considered for the study, download the pdf brochure
The global RNA therapeutics market is consolidated, with Moderna, Inc. (US), Alnylam Pharmaceuticals, Inc.(US), and Pfizer Inc. (US) emerging as the top 3 players of the global market. Players such as Novartis AG(Switzerland), Ionis Pharmaceuticals, Inc.(US), Sarepta Therapeutics, Inc.(US), Sanofi(France), Arrowhead Pharmaceuticals, Inc.(US), BioNTech SE (Germany), Orna Therapeutics (US), CRISPR Therapeutics(Switzerland), Silence Therapeutics (UK), Astellas Pharma Inc. (Japan), CureVac SE (Germany), Sirnaomics (US), Arcturus Therapeutics Inc. (US) and Arbutus Biopharma (US) are some of the prominent players in the market.
Scope of the RNA Therapeutics Industry:
|
Report Metric |
Details |
|
Market Revenue Size in 2023 |
$13.7 billion |
|
Projected Revenue Size by 2028 |
$18.0 billion |
|
Industry Growth Rate |
Poised to grow at a CAGR of 5.6% |
|
Market Driver |
Increasing partnerships and collaborations among market players and RNA technology manufacturers |
|
Market Opportunity |
Higher progress in the development of RNA aptamer-based therapeutics |
This research report categorizes the RNA therapeutics market to forecast revenue and analyze trends in each of the following submarkets:
By Product
- Vaccines
- Drugs
By Type
- mRNA Therapeutics
- RNA Interference (RNAi) Therapeutics
- Antisense Oligonucleotide (ASO) Therapeutics
- Other Therapeutics
By Indication
- Infectious Diseases
- Rare Genetic Diseases/Hereditary Diseases
- Other Indications
By End User
- Hospitals and Clinics
- Research Settings
By Region
-
North America
- US
- Canada
-
Europe
- Germany
- UK
- France
- RoE
-
Asia Pacific
- China
- South Korea
- Japan
- RoAPAC
- Rest of the World
Recent Developments of RNA Therapeutics Industry
- In February 2023, Moderna, Inc. received authorization from Health Canada for its COVID-19 booster vaccine, mRNA-1273.214 (SpikevaxBivalent Original/Omicron). This vaccine is designed for immunization against COVID-19 in children and adolescents between 6 to 17 years.
- In January 2023, the US FDA granted Breakthrough Therapy Designation for Moderna’s investigational mRNA vaccine candidate—mRNA-1345. This vaccine was developed to prevent RSV-associated lower respiratory tract disease (RSV-LRTD) in adults aged 60 years or older.
- In September 2022, Alnylam Pharmaceuticals, Inc. received marketing authorization from the European Commission for its RNAi therapy—AMVUTTRA. This treatment is developed for adult patients with stage 1 or stage 2 polyneuropathy, which is hereditary transthyretin-mediated (hATTR).
Frequently Asked Questions (FAQ):
What is the projected market revenue value of the global RNA therapeutics market?
The global RNA therapeutics market boasts a total revenue value of $18.0 billion by 2028.
What is the estimated growth rate (CAGR) of the global RNA therapeutics market?
The global RNA therapeutics market has an estimated compound annual growth rate (CAGR) of 5.6% and a revenue size in the region of $13.7 billion in 2023.
To speak to our analyst for a discussion on the above findings, click Speak to Analyst


- 5.1 INTRODUCTION
-
5.2 MARKET DYNAMICSDRIVERS- Increasing partnerships and collaborations between market players and RNA technology manufacturers- Increasing number of novel modalities for RNA therapeutics- Growing number of emergency use authorizations and approvals for COVID-19 booster vaccinesRESTRAINTS- Discontinuation or recalls of RNA therapeutic productsOPPORTUNITIES- Higher progress in development of RNA aptamer-based therapeuticsCHALLENGES- Rapid degradation by ubiquitous RNases in environment and tissues with strong immunogenicity of exogenous RNA
-
5.3 TECHNOLOGY ANALYSIS (RNA VACCINE AND THERAPY MANUFACTURING)PARAMETERS OF MANUFACTURINGCIRCULAR RNA ENGINEERING
-
5.4 PIPELINE ANALYSISPIPELINE ANALYSIS FOR KEY MARKET PLAYERS (TOP 5)- Moderna, Inc.- Pfizer, Inc.- Alnylam Pharmaceuticals, Inc.- Novartis AG- Ionis Pharmaceuticals, Inc.
-
5.5 PORTER’S FIVE FORCES ANALYSISTHREAT OF NEW ENTRANTSTHREAT OF SUBSTITUTESBARGAINING POWER OF BUYERSBARGAINING POWER OF SUPPLIERSINTENSITY OF COMPETITIVE RIVALRY
- 5.6 REGULATORY ANALYSIS
- 5.7 VALUE CHAIN ANALYSIS
-
5.8 TRENDS/DISRUPTIONS IMPACTING CUSTOMERS’ BUSINESSES
-
5.9 KEY STAKEHOLDERS AND BUYING CRITERIAKEY STAKEHOLDERS IN BUYING PROCESSBUYING CRITERIA FOR RNA THERAPEUTIC PRODUCTS/MEDICINES
-
5.10 PRICING ANALYSISPRICING ANALYSIS FOR FDA-APPROVED RNA THERAPEUTICS, BY PRODUCTPRICING TREND ANALYSIS: RNA VACCINES AND DRUGS
- 5.11 KEY CONFERENCES AND EVENTS (2023–2024)
-
5.12 ECOSYSTEM MARKET MAP
- 6.1 INTRODUCTION
-
6.2 VACCINESINCREASED NUMBER OF APPROVALS AND HIGHER INVESTMENTS FOR COVID-19 BOOSTER VACCINES TO DRIVE MARKET
-
6.3 DRUGSGROWING FUNDING AND INVESTMENTS IN RNA THERAPEUTICS RESEARCH TO DRIVE MARKET
- 7.1 INTRODUCTION
-
7.2 MRNA THERAPEUTICSINCREASING INVESTMENTS FOR COVID-19 MRNA VACCINES TO DRIVE MARKET
-
7.3 RNA INTERFERENCE (RNAI) THERAPEUTICSINCREASING NUMBER OF APPROVALS FOR SIRNA THERAPEUTICS BY US FDA TO DRIVE MARKET
-
7.4 ANTISENSE OLIGONUCLEOTIDE (ASO) THERAPEUTICSINCREASED NUMBER OF CHEMICAL MODIFICATIONS AND TECHNOLOGICAL ADVANCEMENTS TO DRIVE MARKET
- 7.5 OTHER THERAPEUTICS
- 8.1 INTRODUCTION
-
8.2 INFECTIOUS DISEASESINCREASING PREVALENCE OF INFECTIOUS DISEASES AND GROWING INVESTMENTS IN R&D TO DRIVE MARKET
-
8.3 RARE GENETIC/HEREDITARY DISEASESTECHNOLOGICAL INNOVATION AND INCREASED DEMAND FOR PERSONALIZED MEDICINES TO DRIVE MARKET
- 8.4 OTHER INDICATIONS
- 9.1 INTRODUCTION
-
9.2 HOSPITALS AND CLINICSINCREASED PREVALENCE OF CHRONIC DISEASES AND HIGHER EFFICACY OF RNA-BASED THERAPIES TO DRIVE MARKET
-
9.3 RESEARCH SETTINGSHIGHER THERAPEUTIC POTENTIAL OF RNA TECHNOLOGY TO CREATE NEW OPPORTUNITIES IN MEDICAL RESEARCH
- 10.1 INTRODUCTION
-
10.2 NORTH AMERICANORTH AMERICA: RECESSION IMPACTUS- Growing technological innovation in RNA delivery systems and rising investments in biopharmaceutical research to drive marketCANADA- Increasing government initiatives and investments for life science research to drive market
-
10.3 EUROPEEUROPE: RECESSION IMPACTGERMANY- Rising number of market players and growing public and private funding for research activities to drive marketFRANCE- Growing pharmaceutical manufacturing industry and increasing number of clinical trials for oncology to drive marketUK- Higher R&D investment by pharmaceutical companies for RNA-based drug discovery to drive marketREST OF EUROPE
-
10.4 ASIA PACIFICASIA PACIFIC: RECESSION IMPACTJAPAN- Increasing geriatric population and rising government initiatives for drug innovation to drive marketCHINA- Low manufacturing costs and increased number of R&D activities to drive marketSOUTH KOREA- Increasing number of government initiatives and growing R&D activities for RNA therapeutics to drive marketREST OF ASIA PACIFIC
- 10.5 REST OF THE WORLD

- 11.1 OVERVIEW
- 11.2 KEY STRATEGIES ADOPTED BY MAJOR PLAYERS IN RNA THERAPEUTICS MARKET
- 11.3 MARKET SHARE ANALYSIS
- 11.4 REVENUE SHARE ANALYSIS OF TOP MARKET PLAYERS
-
11.5 COMPANY EVALUATION MATRIX FOR KEY PLAYERSSTARSEMERGING LEADERSPERVASIVE PLAYERSPARTICIPANTS
-
11.6 COMPANY EVALUATION MATRIX FOR START-UPS/SMESPROGRESSIVE COMPANIESSTARTING BLOCKSDYNAMIC COMPANIESRESPONSIVE COMPANIES
- 11.7 COMPETITIVE BENCHMARKING
-
11.8 COMPETITIVE SCENARIOS AND TRENDSKEY PRODUCT APPROVALSKEY DEALSOTHER KEY DEVELOPMENTS
-
12.1 KEY PLAYERSMODERNA, INC.- Business overview- Products offered- Recent developments- MnM viewALNYLAM PHARMACEUTICALS, INC.- Business overview- Products offered- Recent developments- MnM viewNOVARTIS AG- Business overview- Products offered- Recent developments- MnM viewIONIS PHARMACEUTICALS, INC.- Business overview- Products offered- Recent developmentsSAREPTA THERAPEUTICS, INC.- Business overview- Products offered- Recent developmentsSANOFI- Business overview- Products offered- Recent developmentsPFIZER INC.- Business overview- Products offered- Recent developments
-
12.2 OTHER PLAYERSARROWHEAD PHARMACEUTICALS, INC.BIONTECH SEORNA THERAPEUTICSCRISPR THERAPEUTICSSILENCE THERAPEUTICSASTELLAS PHARMA INC.CUREVAC SESIRNAOMICSARCTURUS THERAPEUTICS, INC.ARBUTUS BIOPHARMA
- 13.1 KNOWLEDGESTORE: MARKETSANDMARKETS’ SUBSCRIPTION PORTAL
- 13.2 CUSTOMIZATION OPTIONS
- 13.3 RELATED REPORTS
- 13.4 AUTHOR DETAILS
- TABLE 1 GLOBAL INFLATION RATE PROJECTIONS, 2021–2027 (% GROWTH)
- TABLE 2 US HEALTH EXPENDITURE, 2019–2022 (USD MILLION)
- TABLE 3 US HEALTH EXPENDITURE, 2023–2027 (USD MILLION)
- TABLE 4 IMPACT ANALYSIS: RNA THERAPEUTICS MARKET
- TABLE 5 LIST OF RNA THERAPEUTICS FOR WHICH CLINICAL DEVELOPMENT WAS HALTED
- TABLE 6 RNA APTAMERS UNDER CLINICAL DEVELOPMENT
- TABLE 7 PIPELINE CANDIDATES OF MODERNA, INC.
- TABLE 8 PIPELINE CANDIDATES OF PFIZER INC.
- TABLE 9 PIPELINE CANDIDATES OF ALNYLAM PHARMACEUTICALS, INC.
- TABLE 10 PIPELINE CANDIDATES OF NOVARTIS AG
- TABLE 11 PIPELINE CANDIDATES OF IONIS PHARMACEUTICALS, INC.
- TABLE 12 PORTER’S FIVE FORCES ANALYSIS: RNA THERAPEUTICS MARKET
- TABLE 13 NORTH AMERICA: LIST OF REGULATORY BODIES, GOVERNMENT AGENCIES, AND OTHER ORGANIZATIONS
- TABLE 14 EUROPE: LIST OF REGULATORY BODIES, GOVERNMENT AGENCIES, AND OTHER ORGANIZATIONS
- TABLE 15 ASIA PACIFIC: LIST OF REGULATORY BODIES, GOVERNMENT AGENCIES, AND OTHER ORGANIZATIONS
- TABLE 16 REST OF THE WORLD: LIST OF REGULATORY BODIES, GOVERNMENT AGENCIES, AND OTHER ORGANIZATIONS
- TABLE 17 AVERAGE SELLING PRICE FOR RNA VACCINES AND DRUGS, BY REGION
- TABLE 18 KEY CONFERENCES AND EVENTS IN RNA THERAPEUTICS MARKET (2023–2024)
- TABLE 19 RNA THERAPEUTICS MARKET, BY PRODUCT, 2021–2028 (USD MILLION)
- TABLE 20 RNA THERAPEUTICS MARKET FOR VACCINES, BY REGION, 2021–2028 (USD MILLION)
- TABLE 21 NORTH AMERICA: RNA THERAPEUTICS MARKET FOR VACCINES, BY COUNTRY, 2021–2028 (USD MILLION)
- TABLE 22 EUROPE: RNA THERAPEUTICS MARKET FOR VACCINES, BY COUNTRY, 2021–2028 (USD MILLION)
- TABLE 23 ASIA PACIFIC: RNA THERAPEUTICS MARKET FOR VACCINES, BY COUNTRY, 2021–2028 (USD MILLION)
- TABLE 24 RNA THERAPEUTICS MARKET FOR DRUGS, BY REGION, 2021–2028 (USD MILLION)
- TABLE 25 NORTH AMERICA: RNA THERAPEUTICS MARKET FOR DRUGS, BY COUNTRY, 2021–2028 (USD MILLION)
- TABLE 26 EUROPE: RNA THERAPEUTICS MARKET FOR DRUGS, BY COUNTRY, 2021–2028 (USD MILLION)
- TABLE 27 ASIA PACIFIC: RNA THERAPEUTICS MARKET FOR DRUGS, BY COUNTRY, 2021–2028 (USD MILLION)
- TABLE 28 RNA THERAPEUTICS MARKET, BY TYPE, 2021–2028 (USD MILLION)
- TABLE 29 RNA THERAPEUTICS MARKET FOR MRNA THERAPEUTICS, BY REGION, 2021–2028 (USD MILLION)
- TABLE 30 NORTH AMERICA: RNA THERAPEUTICS MARKET FOR MRNA THERAPEUTICS, BY COUNTRY, 2021–2028 (USD MILLION)
- TABLE 31 EUROPE: RNA THERAPEUTICS MARKET FOR MRNA THERAPEUTICS, BY COUNTRY, 2021–2028 (USD MILLION)
- TABLE 32 ASIA PACIFIC: RNA THERAPEUTICS MARKET FOR MRNA THERAPEUTICS, BY COUNTRY, 2021–2028 (USD MILLION)
- TABLE 33 RNA THERAPEUTICS MARKET FOR RNA INTERFERENCE (RNAI) THERAPEUTICS, BY REGION, 2021–2028 (USD MILLION)
- TABLE 34 NORTH AMERICA: RNA THERAPEUTICS MARKET FOR RNA INTERFERENCE (RNAI) THERAPEUTICS, BY COUNTRY, 2021–2028 (USD MILLION)
- TABLE 35 EUROPE: RNA THERAPEUTICS MARKET FOR RNA INTERFERENCE (RNAI) THERAPEUTICS, BY COUNTRY, 2021–2028 (USD MILLION)
- TABLE 36 ASIA PACIFIC: RNA THERAPEUTICS MARKET FOR RNA INTERFERENCE (RNAI) THERAPEUTICS, BY COUNTRY, 2021–2028 (USD MILLION)
- TABLE 37 RNA THERAPEUTICS MARKET FOR ANTISENSE OLIGONUCLEOTIDE (ASO) THERAPEUTICS, BY REGION, 2021–2028 (USD MILLION)
- TABLE 38 NORTH AMERICA: RNA THERAPEUTICS MARKET FOR ANTISENSE OLIGONUCLEOTIDE (ASO) THERAPEUTICS, BY COUNTRY, 2021–2028 (USD MILLION)
- TABLE 39 EUROPE: RNA THERAPEUTICS MARKET FOR ANTISENSE OLIGONUCLEOTIDE (ASO) THERAPEUTICS, BY COUNTRY, 2021–2028 (USD MILLION)
- TABLE 40 ASIA PACIFIC: RNA THERAPEUTICS MARKET FOR ANTISENSE OLIGONUCLEOTIDE (ASO) THERAPEUTICS, BY COUNTRY, 2021–2028 (USD MILLION)
- TABLE 41 RNA THERAPEUTICS MARKET, BY INDICATION, 2021–2028 (USD MILLION)
- TABLE 42 RNA THERAPEUTICS MARKET FOR INFECTIOUS DISEASES, BY REGION, 2021–2028 (USD MILLION)
- TABLE 43 NORTH AMERICA: RNA THERAPEUTICS MARKET FOR INFECTIOUS DISEASES, BY COUNTRY, 2021–2028 (USD MILLION)
- TABLE 44 EUROPE: RNA THERAPEUTICS MARKET FOR INFECTIOUS DISEASES, BY COUNTRY, 2021–2028 (USD MILLION)
- TABLE 45 ASIA PACIFIC: RNA THERAPEUTICS MARKET FOR INFECTIOUS DISEASES, BY COUNTRY, 2021–2028 (USD MILLION)
- TABLE 46 RNA THERAPEUTICS MARKET FOR RARE GENETIC/HEREDITARY DISEASES, BY REGION, 2021–2028 (USD MILLION)
- TABLE 47 NORTH AMERICA: RNA THERAPEUTICS MARKET FOR RARE GENETIC/HEREDITARY DISEASES, BY COUNTRY, 2021–2028 (USD MILLION)
- TABLE 48 EUROPE: RNA THERAPEUTICS MARKET FOR RARE GENETIC/HEREDITARY DISEASES, BY COUNTRY, 2021–2028 (USD MILLION)
- TABLE 49 ASIA PACIFIC: RNA THERAPEUTICS MARKET FOR RARE GENETIC/HEREDITARY DISEASES, BY COUNTRY, 2021–2028 (USD MILLION)
- TABLE 50 RNA THERAPEUTICS MARKET FOR OTHER INDICATIONS, BY REGION, 2021–2028 (USD MILLION)
- TABLE 51 NORTH AMERICA: RNA THERAPEUTICS MARKET FOR OTHER INDICATIONS, BY COUNTRY, 2021–2028 (USD MILLION)
- TABLE 52 EUROPE: RNA THERAPEUTICS MARKET FOR OTHER INDICATIONS, BY COUNTRY, 2021–2028 (USD MILLION)
- TABLE 53 ASIA PACIFIC: RNA THERAPEUTICS MARKET FOR OTHER INDICATIONS, BY COUNTRY, 2021–2028 (USD MILLION)
- TABLE 54 RNA THERAPEUTICS MARKET, BY END USER, 2021–2028 (USD MILLION)
- TABLE 55 RNA THERAPEUTICS MARKET FOR HOSPITALS AND CLINICS, BY REGION, 2021–2028 (USD MILLION)
- TABLE 56 NORTH AMERICA: RNA THERAPEUTICS MARKET FOR HOSPITALS AND CLINICS, BY COUNTRY, 2021–2028 (USD MILLION)
- TABLE 57 EUROPE: RNA THERAPEUTICS MARKET FOR HOSPITALS AND CLINICS, BY COUNTRY, 2021–2028 (USD MILLION)
- TABLE 58 ASIA PACIFIC: RNA THERAPEUTICS MARKET FOR HOSPITALS AND CLINICS, BY COUNTRY, 2021–2028 (USD MILLION)
- TABLE 59 RNA THERAPEUTICS MARKET FOR RESEARCH SETTINGS, BY REGION, 2021–2028 (USD MILLION)
- TABLE 60 NORTH AMERICA: RNA THERAPEUTICS MARKET FOR RESEARCH SETTINGS, BY COUNTRY, 2021–2028 (USD MILLION)
- TABLE 61 EUROPE: RNA THERAPEUTICS MARKET FOR RESEARCH SETTINGS, BY COUNTRY, 2021–2028 (USD MILLION)
- TABLE 62 ASIA PACIFIC: RNA THERAPEUTICS MARKET FOR RESEARCH SETTINGS, BY COUNTRY, 2021–2028 (USD MILLION)
- TABLE 63 RNA THERAPEUTICS MARKET, BY REGION, 2021–2028 (USD MILLION)
- TABLE 64 NORTH AMERICA: RNA THERAPEUTICS MARKET, BY COUNTRY, 2021–2028 (USD MILLION)
- TABLE 65 NORTH AMERICA: RNA THERAPEUTICS MARKET, BY PRODUCT, 2021–2028 (USD MILLION)
- TABLE 66 NORTH AMERICA: RNA THERAPEUTICS MARKET, BY TYPE, 2021–2028 (USD MILLION)
- TABLE 67 NORTH AMERICA: RNA THERAPEUTICS MARKET, BY INDICATION, 2021–2028 (USD MILLION)
- TABLE 68 NORTH AMERICA: RNA THERAPEUTICS MARKET, BY END USER, 2021–2028 (USD MILLION)
- TABLE 69 LIST OF RECENT RNA THERAPEUTICS APPROVED BY FDA
- TABLE 70 US: RNA THERAPEUTICS MARKET, BY PRODUCT, 2021–2028 (USD MILLION)
- TABLE 71 US: RNA THERAPEUTICS MARKET, BY TYPE, 2021–2028 (USD MILLION)
- TABLE 72 US: RNA THERAPEUTICS MARKET, BY INDICATION, 2021–2028 (USD MILLION)
- TABLE 73 US: RNA THERAPEUTICS MARKET, BY END USER, 2021–2028 (USD MILLION)
- TABLE 74 CANADA: RNA THERAPEUTICS MARKET, BY PRODUCT, 2021–2028 (USD MILLION)
- TABLE 75 CANADA: RNA THERAPEUTICS MARKET, BY TYPE, 2021–2028 (USD MILLION)
- TABLE 76 CANADA: RNA THERAPEUTICS MARKET, BY INDICATION, 2021–2028 (USD MILLION)
- TABLE 77 CANADA: RNA THERAPEUTICS MARKET, BY END USER, 2021–2028 (USD MILLION)
- TABLE 78 EUROPE: RNA THERAPEUTICS MARKET, BY COUNTRY, 2021–2028 (USD MILLION)
- TABLE 79 EUROPE: RNA THERAPEUTICS MARKET, BY PRODUCT, 2021–2028 (USD MILLION)
- TABLE 80 EUROPE: RNA THERAPEUTICS MARKET, BY TYPE, 2021–2028 (USD MILLION)
- TABLE 81 EUROPE: RNA THERAPEUTICS MARKET, BY INDICATION, 2021–2028 (USD MILLION)
- TABLE 82 EUROPE: RNA THERAPEUTICS MARKET, BY END USER, 2021–2028 (USD MILLION)
- TABLE 83 GERMANY: RNA THERAPEUTICS MARKET, BY PRODUCT, 2021–2028 (USD MILLION)
- TABLE 84 GERMANY: RNA THERAPEUTICS MARKET, BY TYPE, 2021–2028 (USD MILLION)
- TABLE 85 GERMANY: RNA THERAPEUTICS MARKET, BY INDICATION, 2021–2028 (USD MILLION)
- TABLE 86 GERMANY: RNA THERAPEUTICS MARKET, BY END USER, 2021–2028 (USD MILLION)
- TABLE 87 FRANCE: RNA THERAPEUTICS MARKET, BY PRODUCT, 2021–2028 (USD MILLION)
- TABLE 88 FRANCE: RNA THERAPEUTICS MARKET, BY TYPE, 2021–2028 (USD MILLION)
- TABLE 89 FRANCE: RNA THERAPEUTICS MARKET, BY INDICATION, 2021–2028 (USD MILLION)
- TABLE 90 FRANCE: RNA THERAPEUTICS MARKET, BY END USER, 2021–2028 (USD MILLION)
- TABLE 91 UK: RNA THERAPEUTICS MARKET, BY PRODUCT, 2021–2028 (USD MILLION)
- TABLE 92 UK: RNA THERAPEUTICS MARKET, BY TYPE, 2021–2028 (USD MILLION)
- TABLE 93 UK: RNA THERAPEUTICS MARKET, BY INDICATION, 2021–2028 (USD MILLION)
- TABLE 94 UK: RNA THERAPEUTICS MARKET, BY END USER, 2021–2028 (USD MILLION)
- TABLE 95 REST OF EUROPE: RNA THERAPEUTICS MARKET, BY PRODUCT, 2021–2028 (USD MILLION)
- TABLE 96 REST OF EUROPE: RNA THERAPEUTICS MARKET, BY TYPE, 2021–2028 (USD MILLION)
- TABLE 97 REST OF EUROPE: RNA THERAPEUTICS MARKET, BY INDICATION, 2021–2028 (USD MILLION)
- TABLE 98 REST OF EUROPE: RNA THERAPEUTICS MARKET, BY END USER, 2021–2028 (USD MILLION)
- TABLE 99 ASIA PACIFIC: RNA THERAPEUTICS MARKET, BY COUNTRY, 2021–2028 (USD MILLION)
- TABLE 100 ASIA PACIFIC: RNA THERAPEUTICS MARKET, BY PRODUCT, 2021–2028 (USD MILLION)
- TABLE 101 ASIA PACIFIC: RNA THERAPEUTICS MARKET, BY TYPE, 2021–2028 (USD MILLION)
- TABLE 102 ASIA PACIFIC: RNA THERAPEUTICS MARKET, BY INDICATION, 2021–2028 (USD MILLION)
- TABLE 103 ASIA PACIFIC: RNA THERAPEUTICS MARKET, BY END USER, 2021–2028 (USD MILLION)
- TABLE 104 JAPAN: RNA THERAPEUTICS MARKET, BY PRODUCT, 2021–2028 (USD MILLION)
- TABLE 105 JAPAN: RNA THERAPEUTICS MARKET, BY TYPE, 2021–2028 (USD MILLION)
- TABLE 106 JAPAN: RNA THERAPEUTICS MARKET, BY INDICATION, 2021–2028 (USD MILLION)
- TABLE 107 JAPAN: RNA THERAPEUTICS MARKET, BY END USER, 2021–2028 (USD MILLION)
- TABLE 108 CHINA: RNA THERAPEUTICS MARKET, BY PRODUCT, 2021–2028 (USD MILLION)
- TABLE 109 CHINA: RNA THERAPEUTICS MARKET, BY TYPE, 2021–2028 (USD MILLION)
- TABLE 110 CHINA: RNA THERAPEUTICS MARKET, BY INDICATION, 2021–2028 (USD MILLION)
- TABLE 111 CHINA: RNA THERAPEUTICS MARKET, BY END USER, 2021–2028 (USD MILLION)
- TABLE 112 SOUTH KOREA: RNA THERAPEUTICS MARKET, BY PRODUCT, 2021–2028 (USD MILLION)
- TABLE 113 SOUTH KOREA: RNA THERAPEUTICS MARKET, BY TYPE, 2021–2028 (USD MILLION)
- TABLE 114 SOUTH KOREA: RNA THERAPEUTICS MARKET, BY INDICATION, 2021–2028 (USD MILLION)
- TABLE 115 SOUTH KOREA: RNA THERAPEUTICS MARKET, BY END USER, 2021–2028 (USD MILLION)
- TABLE 116 REST OF ASIA PACIFIC: RNA THERAPEUTICS MARKET, BY PRODUCT, 2021–2028 (USD MILLION)
- TABLE 117 REST OF ASIA PACIFIC: RNA THERAPEUTICS MARKET, BY TYPE, 2021–2028 (USD MILLION)
- TABLE 118 REST OF ASIA PACIFIC: RNA THERAPEUTICS MARKET, BY INDICATION, 2021–2028 (USD MILLION)
- TABLE 119 REST OF ASIA PACIFIC: RNA THERAPEUTICS MARKET, BY END USER, 2021–2028 (USD MILLION)
- TABLE 120 REST OF THE WORLD: RNA THERAPEUTICS MARKET, BY PRODUCT, 2021–2028 (USD MILLION)
- TABLE 121 REST OF THE WORLD: RNA THERAPEUTICS MARKET, BY TYPE, 2021–2028 (USD MILLION)
- TABLE 122 REST OF THE WORLD: RNA THERAPEUTICS MARKET, BY INDICATION, 2021–2028 (USD MILLION)
- TABLE 123 REST OF THE WORLD: RNA THERAPEUTICS MARKET, BY END USER, 2021–2028 (USD MILLION)
- TABLE 124 DEGREE OF COMPETITION: RNA THERAPEUTICS MARKET
- TABLE 125 DETAILED LIST OF KEY START-UPS/SMES: RNA THERAPEUTICS MARKET
- TABLE 126 KEY PRODUCT APPROVALS, JANUARY 2021–AUGUST 2023
- TABLE 127 KEY DEALS, JANUARY 2021–AUGUST 2023
- TABLE 128 OTHER KEY DEVELOPMENTS, JANUARY 2021–AUGUST 2023
- TABLE 129 MODERNA, INC.: COMPANY OVERVIEW
- TABLE 130 ALNYLAM PHARMACEUTICALS, INC.: COMPANY OVERVIEW
- TABLE 131 NOVARTIS AG: COMPANY OVERVIEW
- TABLE 132 IONIS PHARMACEUTICALS, INC.: COMPANY OVERVIEW
- TABLE 133 SAREPTA THERAPEUTICS, INC.: COMPANY OVERVIEW
- TABLE 134 SANOFI: COMPANY OVERVIEW
- TABLE 135 PFIZER INC.: COMPANY OVERVIEW
- FIGURE 1 RESEARCH DESIGN
- FIGURE 2 BREAKDOWN OF PRIMARIES: RNA THERAPEUTICS MARKET
- FIGURE 3 RNA THERAPEUTICS MARKET SIZE ESTIMATION (SUPPLY SIDE ANALYSIS), 2022
- FIGURE 4 MARKET SIZE ESTIMATION: COMPANY REVENUE ANALYSIS-BASED ESTIMATION, 2022
- FIGURE 5 MARKET SIZE VALIDATION FROM PRIMARY SOURCES
- FIGURE 6 RNA THERAPEUTICS MARKET (SUPPLY SIDE): CAGR PROJECTIONS
- FIGURE 7 GROWTH ANALYSIS OF DEMAND SIDE DRIVERS: RNA THERAPEUTICS MARKET
- FIGURE 8 DATA TRIANGULATION METHODOLOGY
- FIGURE 9 RNA THERAPEUTICS MARKET, BY PRODUCT, 2023 VS. 2028 (USD MILLION)
- FIGURE 10 RNA THERAPEUTICS MARKET, BY TYPE, 2023 VS. 2028 (USD MILLION)
- FIGURE 11 RNA THERAPEUTICS MARKET, BY INDICATION, 2023 VS. 2028 (USD MILLION)
- FIGURE 12 RNA THERAPEUTICS MARKET, BY END USER, 2023 VS. 2028 (USD MILLION)
- FIGURE 13 REGIONAL SNAPSHOT: RNA THERAPEUTICS MARKET
- FIGURE 14 GROWING PARTNERSHIPS AND COLLABORATIONS AMONG KEY PLAYERS TO DRIVE MARKET
- FIGURE 15 VACCINES ACCOUNTED FOR LARGEST SHARE OF NORTH AMERICAN RNA THERAPEUTICS MARKET IN 2022
- FIGURE 16 INFECTIOUS DISEASES TO DOMINATE NORTH AMERICAN RNA THERAPEUTICS MARKET DURING FORECAST PERIOD
- FIGURE 17 DRIVERS, RESTRAINTS, OPPORTUNITIES, AND CHALLENGES: RNA THERAPEUTICS MARKET
- FIGURE 18 PIPELINE THERAPIES, BY CATEGORY, 2022
- FIGURE 19 VALUE CHAIN ANALYSIS OF RNA THERAPEUTICS MARKET: R&D AND MANUFACTURING PHASES ADD MAXIMUM VALUE
- FIGURE 20 TRENDS/DISRUPTIONS IMPACTING CUSTOMERS’ BUSINESSES
- FIGURE 21 INFLUENCE OF STAKEHOLDERS ON BUYING PROCESS OF RNA-BASED THERAPEUTICS
- FIGURE 22 KEY BUYING CRITERIA FOR END USERS
- FIGURE 23 NORTH AMERICA: RNA THERAPEUTICS MARKET SNAPSHOT
- FIGURE 24 ASIA PACIFIC: RNA THERAPEUTICS MARKET SNAPSHOT
- FIGURE 25 KEY PLAYER STRATEGIES IN RNA THERAPEUTICS MARKET, 2021–2023
- FIGURE 26 MARKET SHARE ANALYSIS OF TOP 3 PLAYERS IN RNA THERAPEUTICS MARKET, 2022
- FIGURE 27 REVENUE SHARE ANALYSIS OF TOP 4 PLAYERS IN RNA THERAPEUTICS MARKET, 2020–2022
- FIGURE 28 COMPANY EVALUATION MATRIX FOR KEY PLAYERS: RNA THERAPEUTICS MARKET, 2022
- FIGURE 29 COMPANY EVALUATION MATRIX FOR START-UPS/SMES: RNA THERAPEUTICS MARKET, 2022
- FIGURE 30 MODERNA, INC.: COMPANY SNAPSHOT (2022)
- FIGURE 31 ALNYLAM PHARMACEUTICALS, INC.: COMPANY SNAPSHOT (2022)
- FIGURE 32 NOVARTIS AG: COMPANY SNAPSHOT (2022)
- FIGURE 33 IONIS PHARMACEUTICALS, INC.: COMPANY SNAPSHOT (2022)
- FIGURE 34 SAREPTA THERAPEUTICS, INC.: COMPANY SNAPSHOT (2022)
- FIGURE 35 SANOFI: COMPANY SNAPSHOT (2022)
- FIGURE 36 PFIZER INC.: COMPANY SNAPSHOT (2022)
This study involved four major activities in estimating the current size of the RNA therapeutics market. Exhaustive secondary research was carried out to collect information on the market, its peer markets, and its parent market. The next step was to validate these findings, assumptions, and sizing with industry experts across the value chain through primary research. Both top-down and bottom-up approaches were employed to estimate the complete market size. After that, market breakdown and data triangulation procedures were used to estimate the market size of segments.
Secondary Research
Secondary research was used mainly to identify and collect information for the extensive, technical, market-oriented, and commercial study of the gene editing market. The secondary sources referred to for this research study include publications from government sources, such as National Institutes of Health (NIH), US Food and Drug Administration (US FDA), the World Health Organization (WHO), the European Pharmaceutical Review, American Society of Gene & Cell Therapy (ASGCT), European Society of Gene and Cell Therapy (ESGCT), RNA Society (US), European Medicines Agency (EMA), Alliance for Regenerative Medicine (ARM), Vaccines Europe, and Central Drugs Standard Control Organization (India). Secondary sources also include corporate and regulatory filings, such as annual reports, SEC filings, investor presentations, and financial statements; business magazines and research journals; press releases; and trade, business, and professional associations. Secondary data was collected and analyzed to arrive at the overall size of the global RNA therapeutics market, which was validated through primary research. These sources were also used to obtain key information about major players, market classification, and segmentation according to industry trends, regional/country-level markets, market developments, and technology perspectives.
Primary Research
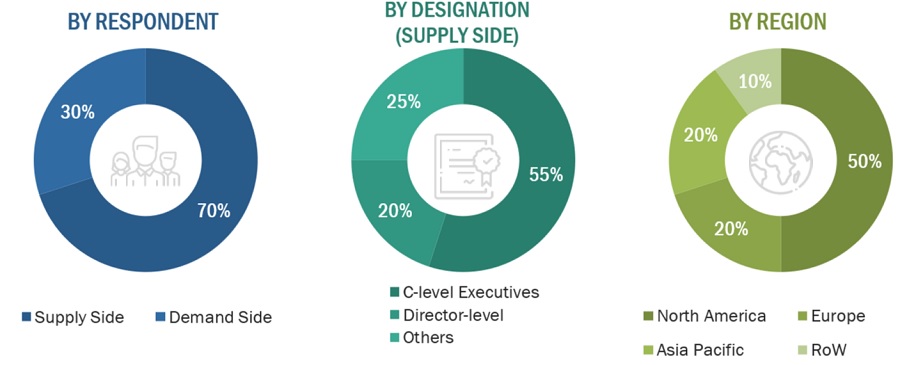
In-depth interviews were conducted with various primary respondents, including key industry participants, subject-matter experts (SMEs), C-level executives of key market players, and industry consultants, among other experts, to obtain and verify the critical qualitative and quantitative information as well as assess the prospects of the market. Various primary sources from both the supply and demand sides of the market were interviewed to obtain qualitative and quantitative information.
To know about the assumptions considered for the study, download the pdf brochure
Market Size Estimation
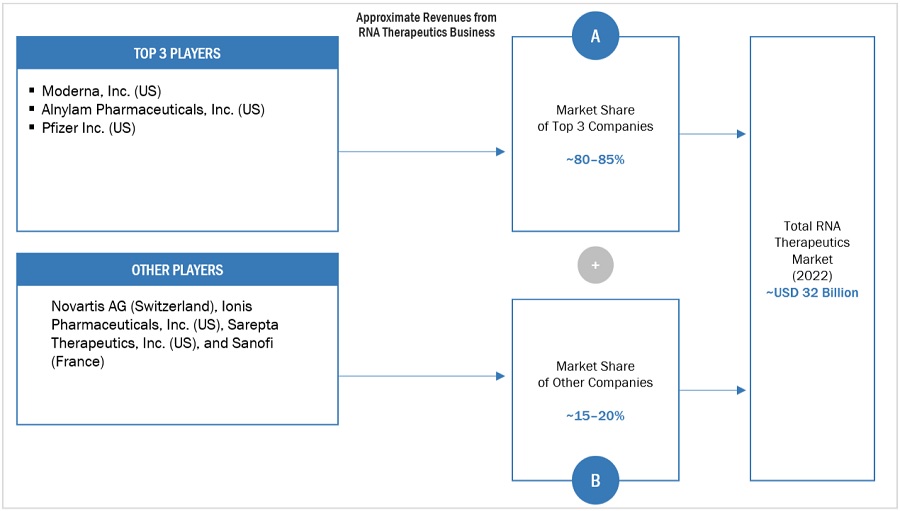
The global size of the RNA therapeutics market was estimated through multiple approaches. A detailed market estimation approach was followed to estimate and validate the value of the RNA therapeutics market and other dependent submarkets. The research methodology used to estimate the market size includes the following:
- The key players in the industry and markets have been identified through extensive secondary research
- The industry’s supply chain and market size, in terms of value, have been determined through primary and secondary research processes.
- All percentage shares, splits, and breakdowns have been determined using secondary sources and verified through primary sources.
Data Triangulation
After arriving at the overall market size—using the market size estimation processes—the market was split into several segments. To complete the overall market engineering process and arrive at the exact statistics of each market segment, data triangulation and market breakdown procedures were employed, wherever applicable. The data was triangulated by studying various factors and trends from both the demand and supply sides in the RNA therapeutics industry.
Market Definition
RNA therapeutics uses both coding RNA (such as mRNA) and non-coding RNAs, which include small interfering RNAs (siRNA), aptamers, antisense oligonucleotides (ASO), ribozymes, and clustered regularly interspaced short palindromic repeats-CRISPR-associated (CRISPR/Cas) endonuclease to target proteins and DNA. RNA therapeutics have diverse abilities to target the desired protein/gene, and the ongoing research in RNA modification and delivery systems has helped in developing unique RNA-based formulations. As of 2022, the use of RNA therapeutics is approved for indications such as COVID-19, hemophilia A and B, cholesterol reduction, spinal muscular atrophy (SMA), polyneuropathy of hereditary transthyretin-mediated amyloidosis-(ATTR), and familial chylomicronaemia syndrome (FCS).
Stakeholders
- RNA drugs and vaccine product manufacturers
- Suppliers and distributors of vaccine manufacturing systems and consumables
- Contract manufacturing organizations
- Pharmaceutical and biotechnology companies
- Research centers and medical colleges
- Contract research organizations
- Government associations and research institutes
- Healthcare associations/institutes
- Regulatory authorities
- Business research firms
Report Objectives
- To define, describe, and forecast the RNA therapeutics market based on product, type, end-user, and region
- To provide detailed information about the drivers, restraints, opportunities, and challenges influencing the market growth
- To strategically analyze micromarkets1 with respect to individual growth trends, prospects, and contributions to the overall RNA therapeutics market
- To analyze market opportunities for stakeholders and provide details of the competitive landscape for key players
- To forecast the size of market segments in North America, Europe, the Asia Pacific (APAC), and Rest of the World (ROW)
- To profile the key players and comprehensively analyze their core competencies2 in terms of key developments, product portfolios, and financials
- To track and analyze competitive developments, such as product launches, partnerships, collaborations, agreements, and acquisitions, in the RNA therapeutics market
- Micromarkets are the further segments and subsegments of the RNA therapeutics market.
- Core competencies of companies are captured in terms of the key developments, market shares, and key strategies adopted to sustain their positions in the market.
Available Customizations:
With the given market data, MarketsandMarkets offers customizations as per the company’s specific needs. The following customization options are available for the report:
- Company Information: Detailed analysis and profiling of additional market players (up to five)
- Geographic Analysis: Further breakdown of the RoW RNA therapeutics market, by region (Latin America & Middle East). Further breakdown of the RoAPAC, RoE RNA therapeutics market, by country.


Growth opportunities and latent adjacency in RNA Therapeutics Market