Bronze Market by Type (Aluminum, Phosphor, Silicon, Leaded Tin), End User (Industrial, Marine, Infrastructure & Construction, Automotive, Electrical & Electronics, Aerospace & Defense), and Region - Global Forecast to 2022


[190 Pages Report] Bronze Market was valued at USD 8.51 Billion in 2016 and is projected to reach USD 10.08 Billion by 2022, at a CAGR of 2.8% between 2017 and 2022.
The objectives of this study are:
- To define, describe, and analyze the global bronze market
- To determine and forecast the global bronze market in different regions
- To analyze the impact of the factors that influence the growth of the market
- To identify opportunities in the market for bronze manufacturers and suppliers
- To study company profiles, developments, upcoming trends & technologies, growth strategies, and industry activities in the market
- To identify current and future trends, along with factors that may drive or restrain the growth of the global bronze market and its end users
Years considered for the study are:
- Base Year � 2016
- Estimated Year � 2017
- Projected Year �2022
- Forecast Period � 2017 to 2022
For company profiles, 2016 has been considered as the base year. In the cases, wherein information was not available for the base year, the years prior to it have been considered.
Research Methodology
This study aims to estimate the bronze market size for 2017 and projects its demand till 2022. It also provides a detailed qualitative and quantitative analysis of the bronze market. Various secondary sources, including directories, industry journals, various associations, and databases (such as Hoovers, Bloomberg, Chemical Weekly, Factiva, government and private websites, and metal associations) have been used to identify and collect information useful for this extensive commercial study of the bronze market. Primary sources such as experts from related industries and suppliers have been interviewed to obtain and verify critical information as well as assess prospects of the bronze market. The breakdown of profiles of primaries is shown in the figure below:
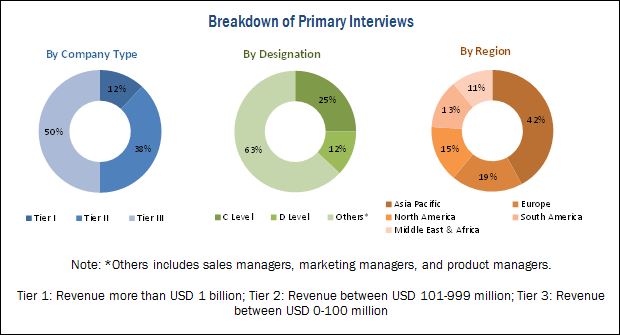
To know about the assumptions considered for the study, download the pdf brochure
The ecosystem of the bronze market includes bronze alloy fabricators and service centers. Some of the key players in the bronze market are Lebronze Alloys (France), Diehl Metall Stiftung & Co. KG (Germany), Wieland Metals Inc. (US), KME Germany GMBH & Co. KG (Germany), LDM B.V. (Netherlands), Concast Metal Products Co. (US), National Bronze & Metals, Inc. (US), PMX Industries Inc. (US), Ningbo Boway Alloy Material Co Ltd (China), Ningbo Xingye Shengtai Group Co., Ltd (China), etc.
Key Target Audience
- Bronze Fabricators
- Bronze Traders, Distributors, and Suppliers
- End Users
- Government and Research Organizations
- Associations and Industrial Bodies
- Research and Consulting Firms
- R&D Institutions
- Environment Support Agencies
- Investment Banks and Private Equity Firms
Scope of the report: This research report categorizes the bronze market based on type, end user, and region. The report forecasts revenues as well as analyzes the trends in each of these submarkets.
Bronze Market, by Type:
- Aluminum Bronze
- Phosphor Bronze
- Silicon Bronze
- Leaded Tin Bronze
- Others
Bronze Market, by End User:
- Industrial
- Marine
- Infrastructure & Construction
- Automotive
- Electrical & Electronics
- Aerospace & Defense
- Others
Bronze Market, by Region:
- Asia Pacific
- Europe
- North America
- South America
- Middle East & Africa
Available Customizations
Along with the given market data, MarketsandMarkets offers customizations according to the company�s specific needs. The following customization options are available for the report:
- New Product Analysis
Product matrix, which gives a detailed comparison of new products and market trends in each industry
- Geographic Analysis
Further breakdown of a region with respect to a particular country and end users
- Company Information
Detailed analysis and profiling of additional market players (up to five)
Customer Interested in this Report also can view
-
Nickel Alloys Market by Function (Corrosion Resistant, Heat Resistant, High Performance, Electronic Alloys), End-Use Industry (Aerospace & Defense, Oil & Gas, Chemical, Energy & Power), and Region - Global Forecast to 2022
The bronze market was valued at USD 8.76 Billion in 2017 and is projected to reach USD 10.08 Billion by 2022, at a CAGR of 2.8% between 2017 and 2022. The increasing demand for bronze from various end users such as marine, automotive, industrial, and aerospace & defense is expected to drive the demand for bronze in the future.
Based on type, the aluminum bronze segment is projected to grow at the highest CAGR during the forecast period. Aluminum bronze is designed to function in extremely corrosive and high-pressure situations, and due to this reason, this type is in high demand from industrial and marine end users. The growing demand for bronze products from industrial and marine end users, along with the demand from automotive and growing aerospace industries is expected to propel the growth of the aluminum bronze segment during the forecast period.
Based on end user, the industrial segment is expected to lead the bronze market in 2017. Resistance to corrosion is one the important properties of bronze products, which enables it to be used in critical industrial applications. Bronze is also used in the manufacturing of components of ships and the growth of the shipbuilding industry in the Asia Pacific region is expected to drive the demand for bronze. The marine end user segment is expected to grow at the highest CAGR during the forecast period.
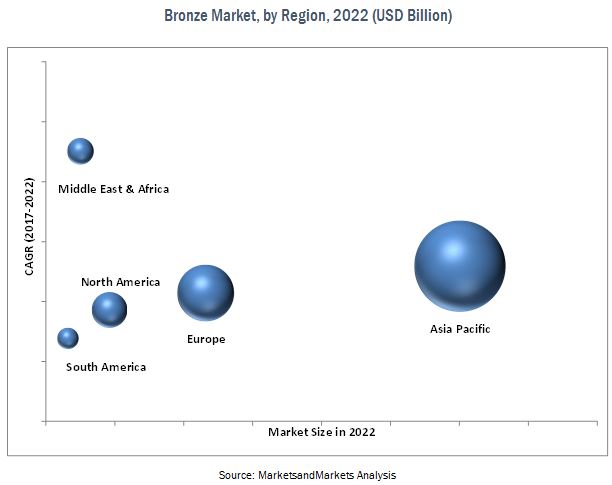
The bronze market in South America is projected to grow at the highest CAGR from 2017 to 2022. However, Asia Pacific remains a major consumer of bronze, which is used by industrial, marine, infrastructure & construction, automotive, aerospace & defense, electrical & electronics, and other end users. The demand for bronze is increasing in both developed and emerging countries of the Asia Pacific region such as Japan, China, India, and South Korea. Bronze is widely used in the marine industry for the manufacturing of different components. Asia Pacific remains a key region for the supply of ultra-large ship vessels, which are preferred for their fuel efficiency. The growing marine end user segment is expected to drive the bronze market. Key manufacturers from the US and Europe are now focusing on expanding their footprint in the Asia Pacific region.
Some of the factors that are likely to hinder the growth of the bronze market during the forecast period are the growing concerns over the use of lead in bronze products and a dearth of skilled laborers for bronze foundry operations.
Key companies in the bronze market include Lebronze Alloys (France), Diehl Metall Stiftung & Co. KG (Germany), Wieland Metals Inc. (US), KME Germany GMBH & Co. KG (Germany), LDM B.V. (Netherlands), Concast Metal Products Co. (US), National Bronze & Metals, Inc. (US), PMX Industries Inc. (US), Ningbo Boway Alloy Material Co Ltd (China), Ningbo Xingye Shengtai Group Co., Ltd (China), etc. Some of these players are increasingly investing in expanding their sales network across different regions to cater to the emerging needs of different end-use industries. They also have strong technical and market development capabilities, which enable them to upgrade their existing products for new applications.
To speak to our analyst for a discussion on the above findings, click Speak to Analyst
 Exclusive indicates content/data unique to MarketsandMarkets and not available with any competitors.
Table of Contents
1 Introduction
1.1 Objectives of the Study
1.2 Market Definition
1.3 Markets Covered
1.4 Currency & Years Considered for the Study
1.5 Stakeholders
2 Research Methodology
2.1 Research Data
2.1.1 Secondary Data
2.1.1.1 Key Data From Secondary Sources
2.1.2 Primary Data
2.1.2.1 Key Data From Primary Sources
2.1.2.2 Breakdown of Primary Interviews
2.2 Market Size Estimation
2.2.1 Bottom Up Approach
2.2.2 Top Down Approach
2.3 Data Triangulation
2.4 Research Assumptions
3 Executive Summary
3.1 Introduction
4 Premium Insights
4.1 Attractive Opportunities in the Global Bronze Market
4.2 Global Bronze Market, By Type
4.3 Global Bronze Market, By End User
4.4 Global Bronze Market Growth
4.5 Global Bronze Market: Emerging & Developed Countries
5 Market Overview
5.1 Introduction
5.2 Market Dynamics
5.2.1 Drivers
5.2.2 Restraints
5.2.3 Opportunities
5.3 Porter�s Five Forces Analysis
5.3.1 Threat of New Entrants
5.3.2 Bargaining Power of Suppliers
5.3.3 Bargaining Power of Buyers
5.3.4 Intensity of Competitive Rivalry
5.3.5 Threat of Substitutes
5.4 Economic Indicators
5.4.1 Trends and Forecast of GDP Countries, 2015 to 2022 (USD Billion)
5.4.2 Trends and Forecast of the Copper Industry
6 Bronze Market, By Type
6.1 Introduction
6.2 Aluminum Bronze
6.3 Phosphor Bronze
6.4 Silicon Bronze
6.5 Leaded Tin Bronze
6.6 Others
7 Bronze Market, By End User
7.1 Introduction
7.2 Industrial
7.3 Marine
7.4 Infrastructure & Construction
7.5 Automotive
7.6 Electrical & Electronics
7.7 Aerospace & Defense
7.8 Others
8 Bronze Market, By Region
8.1 Introduction
8.2 Asia Pacific
8.3 Europe
8.4 North America
8.5 South America
8.6 Middle East & Africa
9 Competitive Landscape
9.1 Overview
9.1.1 Visionary Leaders
9.1.2 Innovators
9.1.3 Dynamic Differentiators
9.1.4 Emerging Companies
9.2 Competitive Benchmarking
9.2.1 Strength of Product Portfolio
9.2.2 Business Strategies Excellence
9.3 Market Ranking
10 Company Profiles
10.1 Lebronze Alloys
10.2 Diehl Metall Stiftung & Co. Kg
10.3 Wieland Metals Inc.
10.4 KME Germany GmbH & Co Kg.
10.5 LDM B.V.
10.6 Concast Metal Products Co
10.7 National Bronze & Metals, Inc.
10.8 PMX Industries Inc.
10.9 Ningbo Boway Alloy Material Co Ltd
10.10 Ningbo Xingye Shengtai Group Co., Ltd
10.11 Other Major Companies
11 Appendix
11.1 Discussion Guide
11.2 Knowledge Store: Marketsandmarkets� Subscription Portal
11.3 Introducing RT: Real Time Market Intelligence
11.4 Authors Details
List of Table (93 Tables)
Table 1 General Assumptions
Table 2 Bronze Market, By Type, 2015-2022 (Kilo Tons)
Table 3 By Market, By Type, 2015-2022 (USD Million)
Table 4 Aluminium Bronze Segment, By Region, 2015-2022 (Kilo Tons)
Table 5 Aluminium Bronze Segment, By Region, 2015-2022 (USD Million)
Table 6 Phosphor Bronze Segment, By Region, 2015-2022 (Kilo Tons)
Table 7 Phosphor Bronze Segment, By Region, 2015-2022 (USD Million)
Table 8 Silicon Bronze Segment, By Region, 2015-2022 (Kilo Tons)
Table 9 Silicon Bronze Segment, By Region, 2015-2022 (USD Million)
Table 10 Leaded Tin Bronze Segment, By Region, 2015-2022 (Kilo Tons)
Table 11 Leaded Tin Bronze Segment, By Region, 2015-2022 (USD Million)
Table 12 Others Segment, By Region, 2015-2022 (Kilo Tons)
Table 13 Others Segment, By Region, 2015-2022 (USD Million)
Table 14 By Market, By End User, 2015-2022 (Kilo Tons)
Table 15 Bronze Market, By End User, 2015-2022 (USD Million)
Table 16 Industrial Segment, By Region, 2015-2022 (Kilo Tons)
Table 17 Industrial Segment, By Region, 2015-2022 (USD Million)
Table 18 Marine Segment, By Region, 2015-2022 (Kilo Tons)
Table 19 Marine Segment, By Region, 2015-2022 (USD Million)
Table 20 Infrastructure & Construction Segment, By Region, 2015-2022 (Kilo Tons)
Table 21 Infrastructure & Construction Segment, By Region, 2015-2022 (USD Million)
Table 22 Automotive Segment, By Region, 2015-2022 (Kilo Tons)
Table 23 Automotive Segment, By Region, 2015-2022 (USD Million)
Table 24 Electrical & Electronics Segment, By Region, 2015-2022 (Kilo Tons)
Table 25 Electrical & Electronics Segment, By Region, 2015-2022 (USD Million)
Table 26 Aerospace & Defense Segment, By Region, 2015-2022 (Kilo Tons)
Table 27 Aerospace & Defense Segment, By Region, 2015-2022 (USD Million)
Table 28 Others Segment, By Region, 2015-2022 (Kilo Tons)
Table 29 Others Segment, By Region, 2015-2022 (USD Million)
Table 30 Global Bronze Market, By Region, 2015-2022 (Kilo Tons)
Table 31 Global Bronze Market, By Region, 2015-2022 (USD Million)
Table 32 Asia Pacific: By Market, By Country, 2015-2022 (Kilo Tons)
Table 33 Asia Pacific: By Market, By Country, 2015-2022 (USD Million)
Table 34 Asia Pacific Bronze Market, By End User, 2015-2022 (Kilo Tons)
Table 35 Asia Pacific : By Market, By End User, 2015-2022 (USD Million)
Table 36 China Bronze Market, By End User, 2015-2022 (Kilo Tons)
Table 37 China : By Market, By End User, 2015-2022 (USD Million)
Table 38 South Korea Bronze Market, By End User, 2015-2022 (Kilo Tons)
Table 39 South Korea : By Market, By End User, 2015-2022 (USD Million)
Table 40 Japan Bronze Market, By End User, 2015-2022 (Kilo Tons)
Table 41 Japan : By Market, By End User, 2015-2022 (USD Million)"
Table 42 India Bronze Market, By End User, 2015-2022 (Kilo Tons)
Table 43 India : By Market, By End User, 2015-2022 (USD Million)"
Table 44 Rest of Asia Pacific Bronze Market, By End User, 2015-2022 (Kilo Tons)
Table 45 Rest of Asia Pacific : By Market, By End User, 2015-2022 (USD Million)"
Table 46 Europe Bronze Market, By Country, 2015-2022 (Kilo Tons)
Table 47 Europe : By Market, By Country, 2015-2022 (USD Million)
Table 48 Europe Bronze Market, By End User, 2015-2022 (Kilo Tons)
Table 49 Europe : By Market, By End User, 2015-2022 (USD Million)
Table 50 Germany Bronze Market, By End User, 2015-2022 (Kilo Tons)
Table 51 Germany : By Market, By End User, 2015-2022 (USD Million)
Table 52 UK Bronze Market, By End User, 2015-2022 (Kilo Tons)
Table 53 UK : By Market, By End User, 2015-2022 (USD Million)
Table 54 France Bronze Market, By End User, 2015-2022 (Kilo Tons)
Table 55 France : By Market, By End User, 2015-2022 (USD Million)
Table 56 Italy Bronze Market, By End User, 2015-2022 (Kilo Tons)
Table 57 Italy : By Market, By End User, 2015-2022 (USD Million)
Table 58 Russia Bronze Market, By End User, 2015-2022 (Kilo Tons)
Table 59 Russia : By Market, By End User, 2015-2022 (USD Million)
Table 60 Spain Bronze Market, By End User, 2015-2022 (Kilo Tons)
Table 61 Spain : By Market, By End User, 2015-2022 (USD Million)
Table 62 Rest of Europe Bronze Market, By End User, 2015-2022 (Kilo Tons)
Table 63 Rest of Europe : By Market, By End User, 2015-2022 (USD Million)
Table 64 North America Bronze Market, By Country, 2015-2022 (Kilo Tons)
Table 65 North America : By Market, By Country, 2015-2022 (USD Million)
Table 66 North America Bronze Market, By End User, 2015-2022 (Kilo Tons)
Table 67 North America : By Market, By End User, 2015-2022 (USD Million)
Table 68 US Bronze Market, By End User, 2015-2022 (Kilo Tons)
Table 69 US : By Market, By End User, 2015-2022 (USD Million)
Table 70 Canada Bronze Market, By End User, 2015-2022 (Kilo Tons)
Table 71 Canada : By Market, By End User, 2015-2022 (USD Million)
Table 72 Mexico Bronze Market, By End User, 2015-2022 (Kilo Tons)
Table 73 Mexico : By Market, By End User, 2015-2022 (USD Million)
Table 74 South America Bronze Market, By Country, 2015-2022 (Kilo Tons)
Table 75 South : By Bronze Market, By Country, 2015-2022 (USD Million)
Table 76 South America Bronze Market, By End User, 2015-2022 (Kilo Tons)
Table 77 South America Bronze Market, By End User, 2015-2022 (USD Million)
Table 78 Brazil Bronze Market, By End User2015-2022 (Kilo Tons)
Table 79 Brazil Bronze Market, By End User, 2015-2022 (USD Million)
Table 80 Argentina Bronze Market, By End User, 2015-2022 (Kilo Tons)
Table 81 Argentina Bronze Market, By End User, 2015-2022 (USD Million)
Table 82 Rest of South America Bronze Market, By End User, 2015-2022 (Kilo Tons)
Table 83 Rest of South America Bronze Market, By End User, 2015-2022 (USD Million)
Table 84 Middle East & Africa Bronze Market, By Country, 2015-2022 (Kilo Tons)
Table 85 Middle East & Africa Bronze Market, By Country, 2015-2022 (USD Million)
Table 86 Middle East & Africa Bronze Market, By End User, 2015-2022 (Kilotons)
Table 87 Middle East & Africa Bronze Market, By End User, 2015-2022 (USD Million)
Table 88 Saudi Arabia Bronze Market, By End User, 2015-2022 (Kilo Tons)
Table 89 Saudi Arabia Bronze Market, By End User, 2015-2022 (USD Million)
Table 90 South Africa Bronze Market, By End User, 2015-2022 (Kilo Tons)
Table 91 South Africa Bronze Market, By End User, 2015-2022 (USD Million)
Table 92 Rest of Middle East & Africa Bronze Market, By End User, 2015-2022 (Kilo Tons)
Table 93 Rest of Middle East & Africa Bronze Market, By End User, 2015-2022 (USD Million)
List of Figures (43 Figures)
Figure 1 Markets Covered
Figure 2 Bronze Market: Research Methodology
Figure 3 By Market: Top-Down Approach
Figure 4 Bronze Market: Bottom-Up Approach
Figure 5 By Market: Data Triangulation
Figure 6 Bronze Market By Type (2017 vs 2022)
Figure 7 By Market, By End User (2017 vs 2022)
Figure 8 Bronze Market, By Region
Figure 9 Increasing Demand From Marine End User Segment is Expected to Propel the Growth of the Bronze Market
Figure 10 Aluminum Bronze Type Segment is Expected to Grow at the Highest CAGR During the Forecast Period
Figure 11 Industrial End User Segment is Estimated to Lead the Global Bronze Market in 2017
Figure 12 Industrial End User Segment Accounted for the Largest Share of the Asia Pacific Bronze Market in 2016
Figure 13 Bronze Market in Brazil is Projected to Grow at the Highest CAGR During the Forecast Period
Figure 14 By Market: Drivers and Barriers
Figure 15 Contribution of Infrastructure & Construction Industry to GDP, By Country, 2015-2022 (USD Billion)
Figure 16 Bronze Market, By Type, 2015-2022 (Kilotons)
Figure 17 By Market, By Type, 2015-2022 (USD Million)
Figure 18 Bronze Market, By End User, 2015-2022 (Kilotons)
Figure 19 By Market, By End User, 2015-2022 (USD Million)
Figure 20 Global Snapshot (2017-2022): Brazil is Expected to Be the Fastest-Growing Market for Bronze During the Forecast Period
Figure 21 Global Bronze Market, By Region, 2015-2022 (Kilotons)
Figure 22 Global Bronze Market, By Region, 2015-2022 (USD Million)
Figure 23 Asia Pacific Bronze Market, By Country, 2015-2022 (Kilotons)
Figure 24 Asia Pacific Bronze Market, By Country, 2015-2022 (USD Million)
Figure 25 Asia Pacific Bronze Market, By End User, 2015-2022 (Kilotons)
Figure 26 Asia Pacific Bronze Market, By End User, 2015-2022 (USD Million)
Figure 27 Europe Bronze Market, By Country, 2015-2022 (Kilotons)
Figure 28 Europe Bronze Market, By Country, 2015-2022 (USD Million)
Figure 29 Europe Bronze Market, By End User, 2015-2022 (Kilo Tons)
Figure 30 Europe Bronze Market, By End User, 2015-2022 (USD Million)
Figure 31 North America Bronze Market, By Country, 2015-2022 (Kilotons)
Figure 32 North America Bronze Market, By Country, 2015-2022 (USD Million)
Figure 33 North America Bronze Market, By End User, 2015-2022 (Kilotons)
Figure 34 North America Bronze Market, By End User, 2015-2022 (USD Million)
Figure 35 South America Bronze Market, By Country, 2015-2022 (Kilo Tons)
Figure 36 South America Bronze Market, By Country, 2015-2022 (USD Million)
Figure 37 South America Bronze Market, By End User, 2015-2022 (Kilo Tons)
Figure 38 South America Bronze Market, By End User, 2015-2022 (USD Million)
Figure 39 Middle East & Africa Bronze Market, By Country, 2015-2022 (Kilo Tons)
Figure 40 Middle East & Africa Bronze Market, By Country, 2015-2022 (USD Million)
Figure 41 Middle East & Africa Bronze Market, By End User, 2015-2022 (Kilo Tons)
Figure 42 Middle East & Africa Bronze Market, By End User, 2015-2022 (USD Million)
Figure 43 Company Snapshot"


Growth opportunities and latent adjacency in Bronze Market